Chapter 12. Logging and Aggregation
Logging provides the capability to send detailed logs to third-party external log aggregation services. Services connected to this data feed serve as a means of gaining insight into automation controller use or technical trends. The data can be used to analyze events in the infrastructure, monitor for anomalies, and correlate events in one service with events in another.
The types of data that are most useful to automation controller are job fact data, job events or job runs, activity stream data, and log messages. The data is sent in JSON format over a HTTP connection using minimal service-specific adjustments engineered in a custom handler or through an imported library.
The version of rsyslog that is installed by automation controller does not include the following rsyslog modules:
- rsyslog-udpspoof.x86_64
- rsyslog-libdbi.x86_64
After installing automation controller, you must only use the automation controller provided rsyslog package for any logging outside of automation controller that might have previously been done with the RHEL provided rsyslog package.
If you already use rsyslog for logging system logs on the automation controller instances, you can continue to use rsyslog to handle logs from outside of automation controller by running a separate rsyslog process (using the same version of rsyslog that automation controller uses), and pointing it to a separate /etc/rsyslog.conf file.
Use the /api/v2/settings/logging/ endpoint to configure how the automation controller rsyslog process handles messages that have not yet been sent in the event that your external logger goes offline:
LOG_AGGREGATOR_ACTION_MAX_DISK_USAGE_GB: Maximum disk persistence for rsyslogd action queuing in GB.Specifies the amount of data to store (in gigabytes) during an outage of the external log aggregator (defaults to 1).
Equivalent to the
rsyslogd queue.maxDiskSpacesetting.LOG_AGGREGATOR_ACTION_QUEUE_SIZE: Maximum number of messages that can be stored in the log action queue.Defines how large the rsyslog action queue can grow in number of messages stored. This can have an impact on memory use. When the queue reaches 75% of this number, the queue starts writing to disk (
queue.highWatermarkinrsyslog). When it reaches 90%,NOTICE,INFO, andDEBUGmessages start to be discarded (queue.discardMarkwith 'queue.discardSeverity=5`).Equivalent to the
rsyslogd queue.sizesetting on the action.
It stores files in the directory specified by LOG_AGGREGATOR_MAX_DISK_USAGE_PATH.
-
LOG_AGGREGATOR_MAX_DISK_USAGE_PATH: Specifies the location to store logs that should be retried after an outage of the external log aggregator (defaults to/var/lib/awx). Equivalent to thersyslogd queue.spoolDirectorysetting.
For example, if Splunk goes offline, rsyslogd stores a queue on the disk until Splunk comes back online. By default, it stores up to 1GB of events (while Splunk is offline) but you can increase that to more than 1GB if necessary, or change the path where you save the queue.
12.1. Loggers
The following are special loggers (except for awx, which constitutes generic server logs) that provide large amounts of information in a predictable structured or semi-structured format, using the same structure as if obtaining the data from the API:
-
job_events: Provides data returned from the Ansible callback module. -
activity_stream: Displays the record of changes to the objects within the application. -
system_tracking: Provides fact data gathered by Ansiblesetupmodule, that is,gather_facts: truewhen job templates are run with Enable Fact Cache selected. -
awx: Provides generic server logs, which include logs that would normally be written to a file. It contains the standard metadata that all logs have, except it only has the message from the log statement.
These loggers only use the log-level of INFO, except for the awx logger, which can be any given level.
Additionally, the standard automation controller logs are deliverable through this same mechanism. It should be apparent how to enable or disable each of these five sources of data without manipulating a complex dictionary in your local settings file, and how to adjust the log-level consumed from the standard automation controller logs.
From the navigation panel, select . Then select Logging settings from the list of System options to configure the logging components in automation controller.
12.1.1. Log message schema
Common schema for all loggers:
-
cluster_host_id: Unique identifier of the host within the automation controller cluster. -
level: Standard python log level, roughly reflecting the significance of the event. All of the data loggers as a part of 'level' useINFOlevel, but the other automation controller logs use different levels as appropriate. -
logger_name: Name of the logger we use in the settings, for example, "activity_stream". -
@timestamp: Time of log. -
path: File path in code where the log was generated.
12.1.2. Activity stream schema
This uses the fields common to all loggers listed in Log message schema.
It has the following additional fields:
-
actor: Username of the user who took the action documented in the log. -
changes: JSON summary of what fields changed, and their old or new values. -
operation: The basic category of the changes logged in the activity stream, for instance, "associate". -
object1: Information about the primary object being operated on, consistent with what is shown in the activity stream. -
object2: If applicable, the second object involved in the action.
This logger reflects the data being saved into job events, except when they would otherwise conflict with expected standard fields from the logger, in which case the fields are nested. Notably, the field host on the job_event model is given as event_host. There is also a sub-dictionary field, event_data within the payload, which contains different fields depending on the specifics of the Ansible event.
This logger also includes the common fields in Log message schema.
12.1.3. Scan / fact / system tracking data schema
These contain detailed dictionary-type fields that are either services, packages, or files.
services: For services scans, this field is included and has keys based on the name of the service.NotePeriods are not allowed by elastic search in names, and are replaced with "_" by the log formatter.
-
package: Included for log messages from package scans. -
files: Included for log messages from file scans. -
host: Name of the host the scan applies to. -
inventory_id: The inventory id the host is inside of.
This logger also includes the common fields in Log message schema.
12.1.4. Job status changes
This is a lower-volume source of information about changes in job states compared to job events, and captures changes to types of unified jobs other than job template based jobs.
This logger also includes the common fields in Log message schema and fields present on the job model.
12.1.5. Automation controller logs
This logger also includes the common fields in Log message schema.
In addition, this contains a msg field with the log message. Errors contain a separate traceback field. From the navigation panel, select . Then select Logging settings from the list of System options and use the ENABLE EXTERNAL LOGGING option to enable or disable the logging components.
12.1.6. Logging Aggregator Services
The logging aggregator service works with the following monitoring and data analysis systems:
12.1.6.1. Splunk
Automation controller’s Splunk logging integration uses the Splunk HTTP Collector. When configuring a SPLUNK logging aggregator, add the full URL to the HTTP Event Collector host, as in the following example:
https://<yourcontrollerfqdn>/api/v2/settings/logging

{
    "LOG_AGGREGATOR_HOST": "https://<yoursplunk>:8088/services/collector/event",
    "LOG_AGGREGATOR_PORT": null,
    "LOG_AGGREGATOR_TYPE": "splunk",
    "LOG_AGGREGATOR_USERNAME": "",
    "LOG_AGGREGATOR_PASSWORD": "$encrypted$",
    "LOG_AGGREGATOR_LOGGERS": [
        "awx",
        "activity_stream",
        "job_events",
        "system_tracking"
    ],
    "LOG_AGGREGATOR_INDIVIDUAL_FACTS": false,
    "LOG_AGGREGATOR_ENABLED": true,
    "LOG_AGGREGATOR_CONTROLLER_UUID": ""
}
The Splunk HTTP Event Collector listens on port 8088 by default, so you must provide the full HEC event URL (with the port number) for LOG_AGGREGATOR_HOST for incoming requests to be processed successfully.
Typical values are shown in the following example:
For more information on configuring the HTTP Event Collector, see the Splunk documentation.
12.1.6.2. Loggly
For more information on sending logs through Loggly’s HTTP endpoint, see the Loggly documentation.
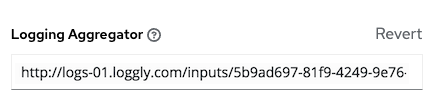
Loggly uses the URL convention shown in the Logging Aggregator field in the following example:
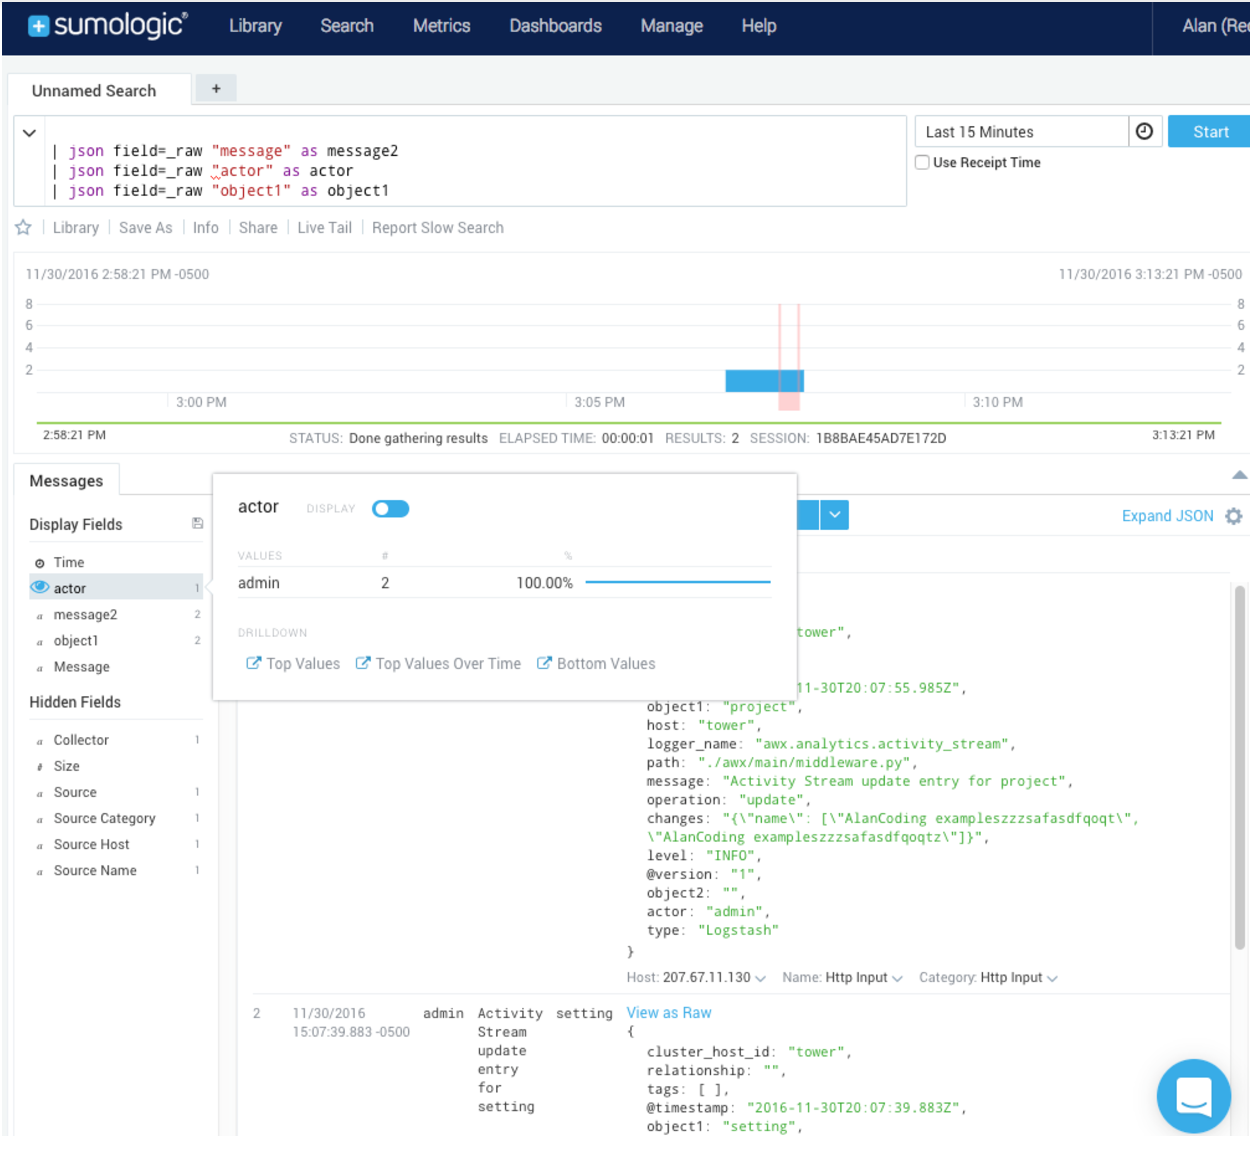
12.1.6.3. Sumologic
In Sumologic, create a search criteria containing the JSON files that provide the parameters used to collect the data you need.
12.1.6.4. Elastic stack (formerly ELK stack)
If you are setting up your own version of the elastic stack, the only change you require is to add the following lines to the logstash logstash.conf file:
filter {
  json {
    source => "message"
  }
}Backward-incompatible changes were introduced with Elastic 5.0.0, and different configurations might be required depending on what version you are using.
12.2. Setting Up Logging
Use the following procedure to set up logging to any of the aggregator types.
Procedure
- From the navigation panel, select .
- Select Logging settings from the list of System options.
- On the Logging settings screen, click .
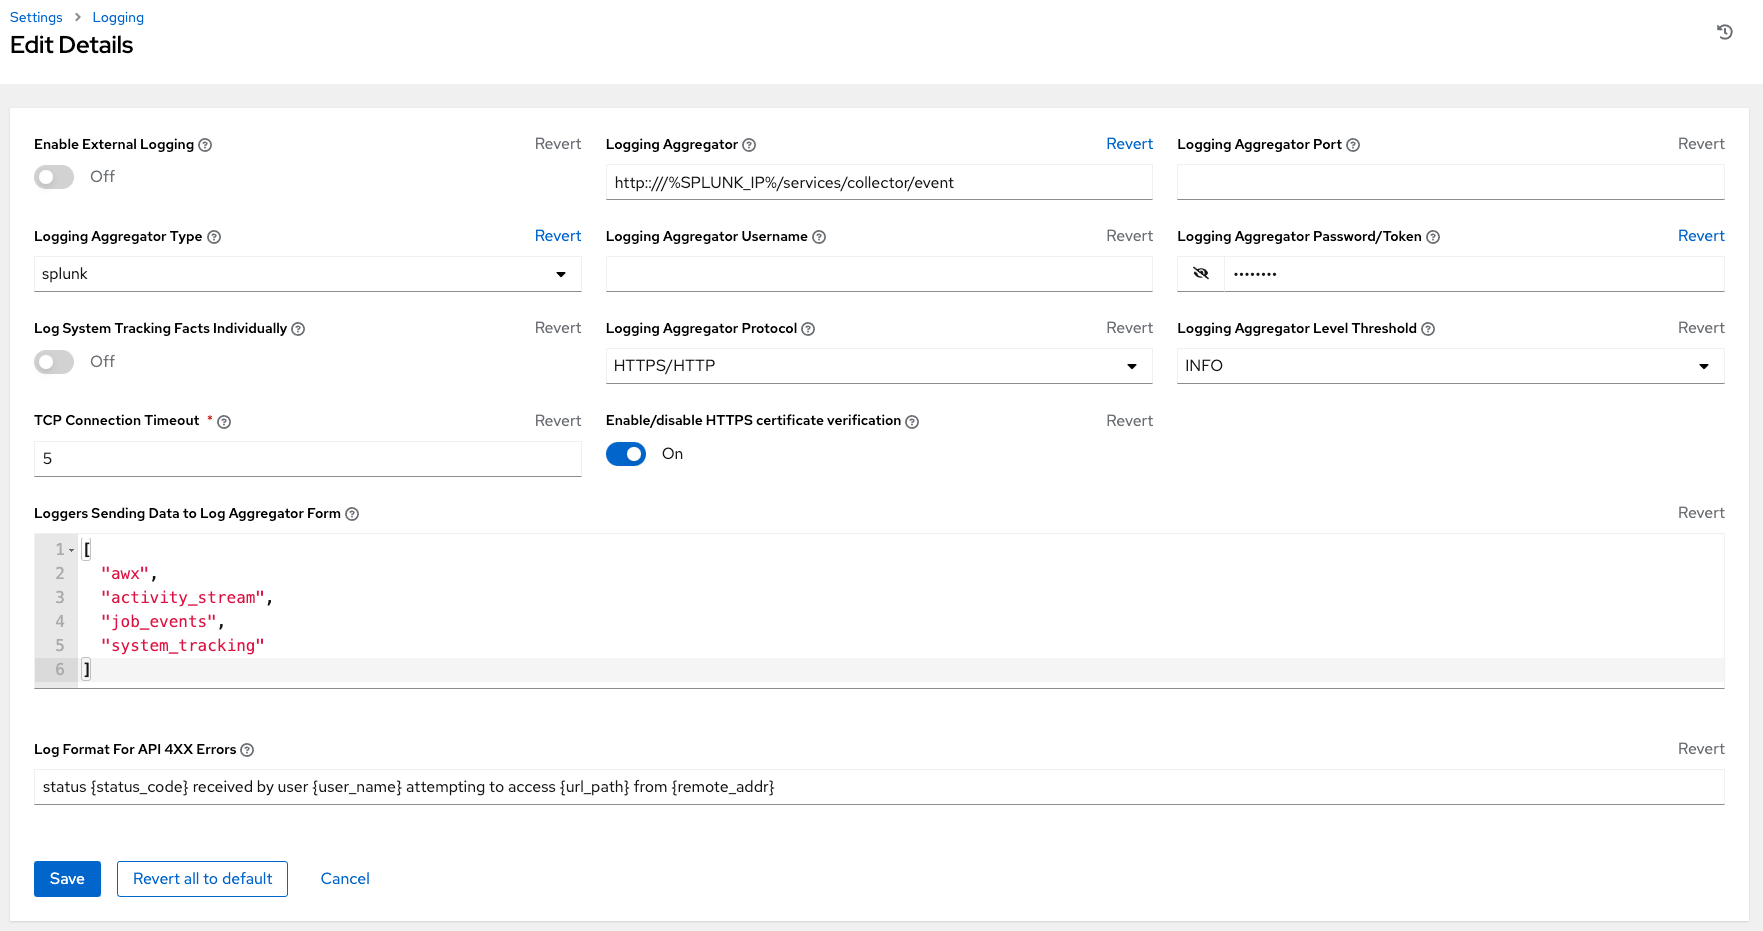
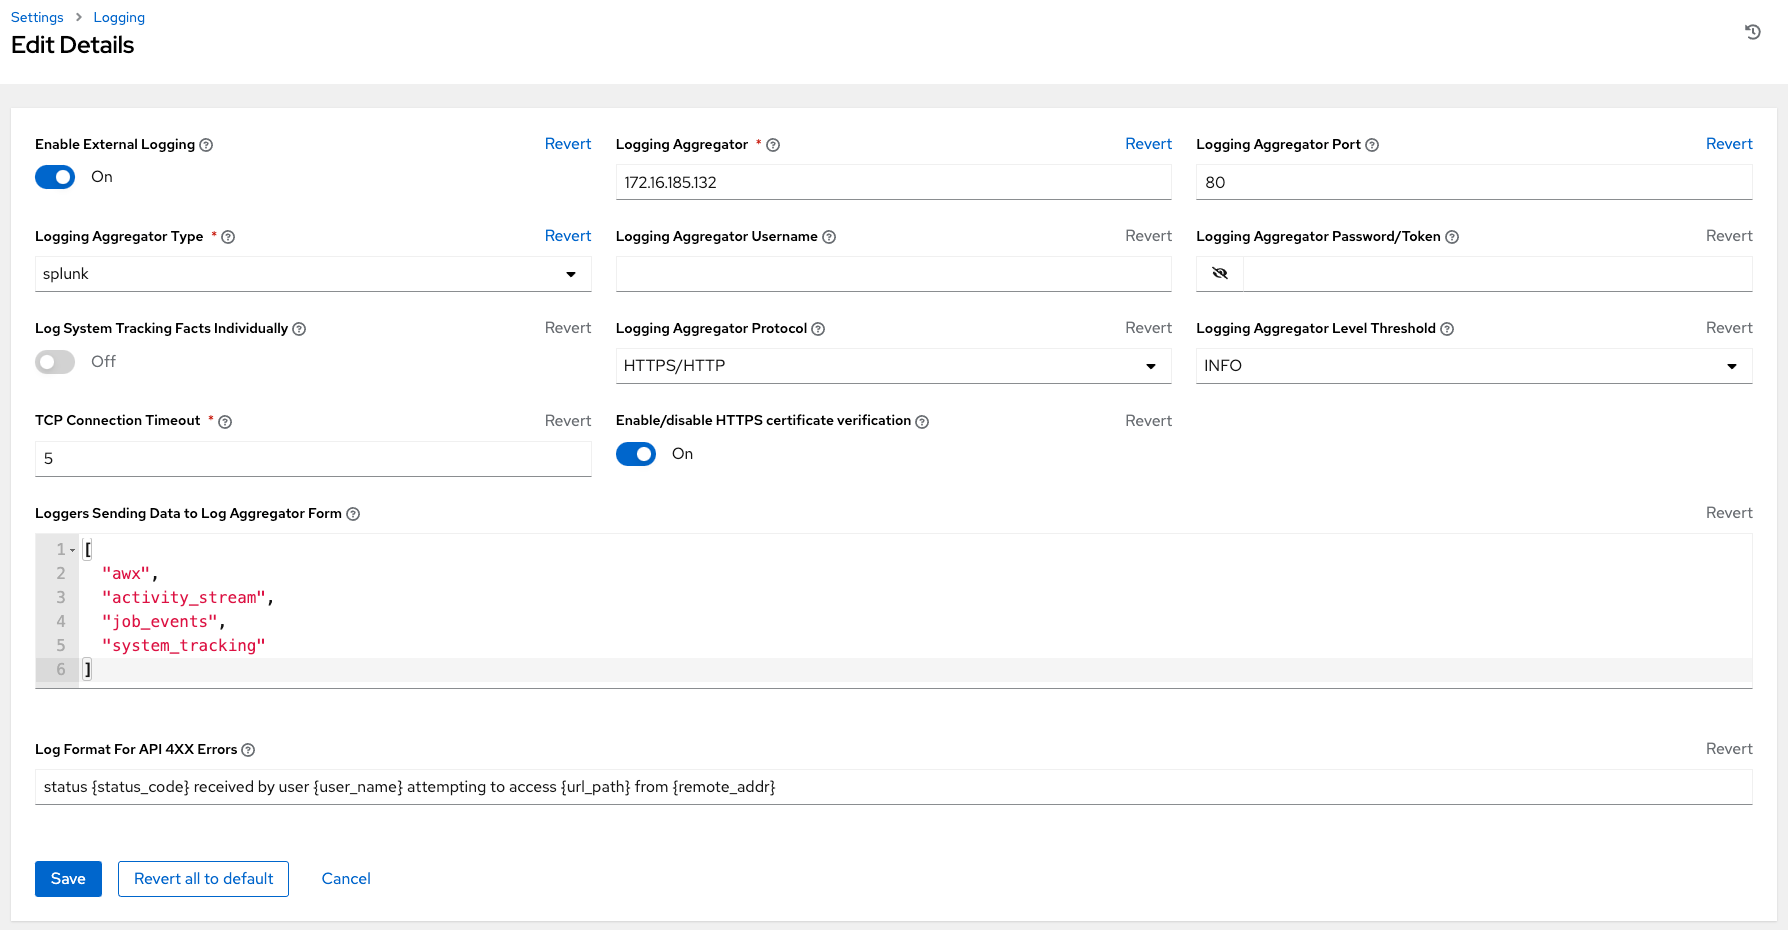
Set the following configurable options:
- Enable External Logging: Click the toggle button to ON if you want to send logs to an external log aggregator.
- Logging Aggregator: Enter the hostname or IP address that you want to send logs to.
Logging Aggregator Port: Specify the port for the aggregator if it requires one.
NoteWhen the connection type is HTTPS, you can enter the hostname as a URL with a port number, after which, you are not required to enter the port again. However, TCP and UDP connections are determined by the hostname and port number combination, rather than URL. Therefore, in the case of a TCP or UDP connection, supply the port in the specified field. If a URL is entered in the Logging Aggregator field instead, its hostname portion is extracted as the hostname.
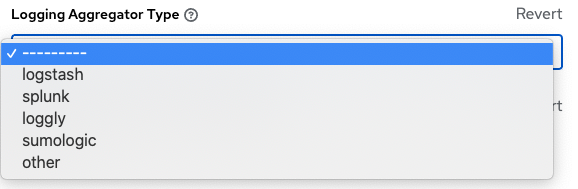
Logging Aggregator Type: Click to select the aggregator service from the list:
- Logging Aggregator Username: Enter the username of the logging aggregator if required.
- Logging Aggregator Password/Token: Enter the password of the logging aggregator if required.
-
Log System Tracking Facts Individually: Click the tooltip
 icon for additional information, such as whether or not you want to turn it on, or leave it off by default.
- Logging Aggregator Protocol: Click to select a connection type (protocol) to communicate with the log aggregator. Subsequent options vary depending on the selected protocol.
- Logging Aggregator Level Threshold: Select the level of severity you want the log handler to report.
- TCP Connection Timeout: Specify the connection timeout in seconds. This option is only applicable to HTTPS and TCP log aggregator protocols.
- Enable/disable HTTPS certificate verification: Certificate verification is enabled by default for the HTTPS log protocol. Set the toggle to OFF if you do not want the log handler to verify the HTTPS certificate sent by the external log aggregator before establishing a connection.
-
Loggers to Send Data to the Log Aggregator Form: All four types of data are pre-populated by default. Click the tooltip
icon next to the field for additional information on each data type. Delete the data types you do not want.
- Log Format For API 4XX Errors: Configure a specific error message. For more information, see API 4XX Error Configuration.
Review your entries for your chosen logging aggregation. The following example is set up for Splunk:
- Click or to abandon the changes.
12.3. API 4XX Error Configuration
When the API encounters an issue with a request, it typically returns an HTTP error code in the 400 range along with an error. When this happens, an error message is generated in the log that follows the following pattern:
' status {status_code} received by user {user_name} attempting to access {url_path} from {remote_addr} 'These messages can be configured as required. Use the following procedure to modify the default API 4XX errors log message format.
Procedure
- From the navigation panel, select then select Logging settings.
- On the Logging settings page, click .
- Modify the field Log Format For API 4XX Errors.
Items surrounded by {} are substituted when the log error is generated. The following variables can be used:
- status_code: The HTTP status code the API is returning.
- user_name: The name of the user that was authenticated when making the API request.
- url_path: The path portion of the URL being called (the API endpoint).
- remote_addr: The remote address received by automation controller.
- error: The error message returned by the API or, if no error is specified, the HTTP status as text.
12.4. Troubleshooting logging
Logging Aggregation
If you have sent a message with the test button to your configured logging service through http or https, but did not receive the message, check the /var/log/tower/rsyslog.err log file. This is where errors are stored if they occurred when authenticating rsyslog with an http or https external logging service. Note that if there are no errors, this file does not exist.
API 4XX Errors
You can include the API error message for 4XX errors by modifying the log format for those messages. Refer to the API 4XX Error Configuration.
LDAP
You can enable logging messages for the LDAP adapter. For more information, see API 4XX Error Configuration.
SAML
You can enable logging messages for the SAML adapter the same way you can enable logging for LDAP. Refer to the Enabling logging for LDAP section for more detail.