Chapter 28. Usability Analytics and Data Collection
Usability data collection is included with automation controller to collect data to better understand how automation controller users interact with it.
Only users installing a trial of or a fresh installation of are opted-in for this data collection.
Automation controller collects user data automatically to help improve the product. You can opt out or control the way automation controller collects data by setting your participation level in the User Interface settings in the menu.
28.1. Setting up data collection participation
Use the following procedure to set your participation level for data collection.
Procedure
- From the navigation panel, select .
- Select User Interface settings from the User Interface option.
Click .
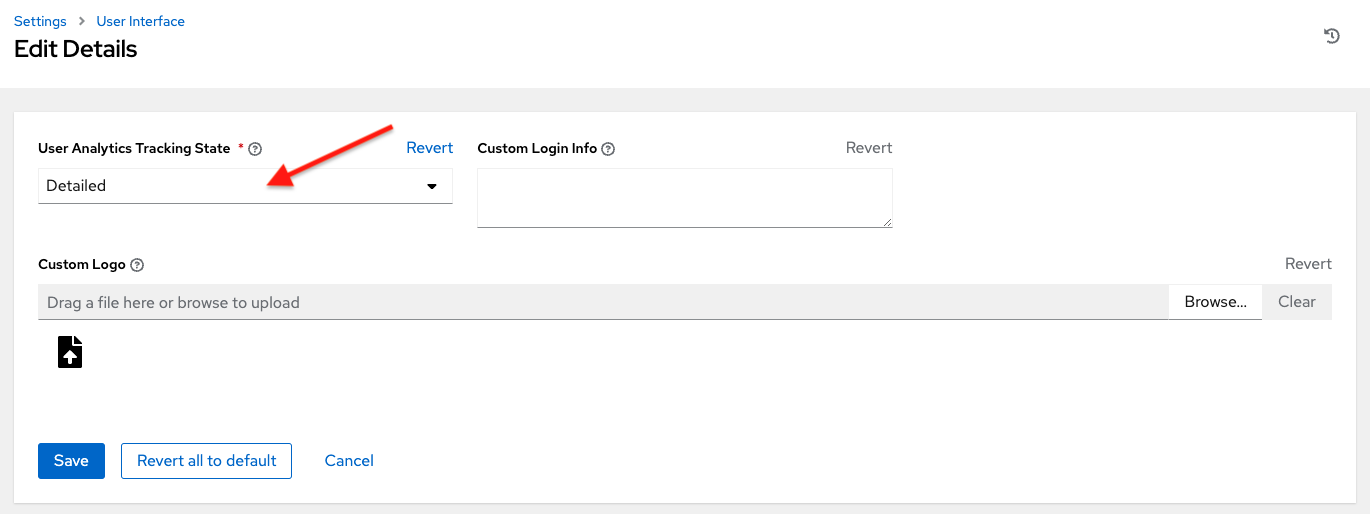
Select the desired level of data collection from the User Analytics Tracking State list:
- Off: Prevents any data collection.
- Anonymous: Enables data collection without your specific user data.
- Detailed: Enables data collection including your specific user data.
- Click to apply the settings, or to abandon the changes.
For more information, see the Red Hat Privacy Statement.
28.2. Automation Analytics
When you imported your license for the first time, you were automatically opted in for the collection of data that powers Automation Analytics, a cloud service that is part of the Ansible Automation Platform subscription.
For opt-in of Automation Analytics to have any effect, your instance of automation controller must be running on Red Hat Enterprise Linux.
As with Red Hat Insights, Automation Analytics is built to collect the minimum amount of data needed. No credential secrets, personal data, automation variables, or task output is gathered.
For more information, see Details of data collection.
To set up Automation Analytics, you must first create a service account for the purposes of authentication.
28.2.1. Creating and configuring Ansible Automation Platform to use a service account for Automation Analytics
Prerequisites
- A service account created with the Analytics Administrator viewer role in console.redhat.com. For more information see, Creating a service account.
Procedure
- From the navigation panel, select .
- Select Miscellaneous System settings from the list of System options.
- Click .
- Toggle the Gather data for Automation Analytics switch so that it is on.
- In the field labeled Red Hat Client ID for Analytics, enter the client ID you received when you created your service account.
- In the field labeled Red Hat Client Secret for Analytics, enter the client secret you received when you created your service account.
- Click .
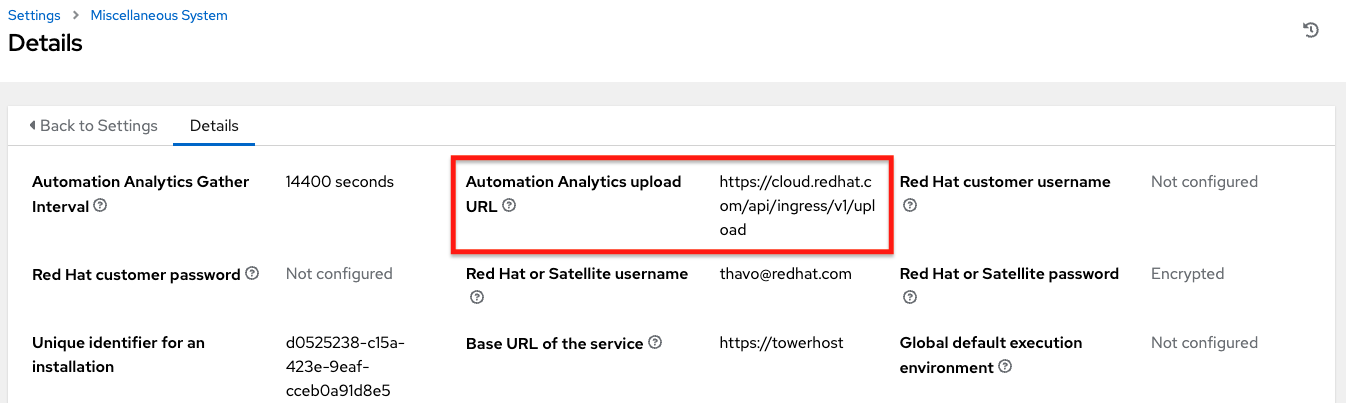
You can view the location where insights data is uploaded in the Automation Analytics upload URL field on the Details page.
By default, the data is collected every four hours. When you enable this feature, data is collected up to a month in arrears (or until the previous collection). You can turn off this data collection at any time in the Miscellaneous System settings of the System configuration window.
This setting can also be enabled through the API by specifying INSIGHTS_TRACKING_STATE = true in either of these endpoints:
-
api/v2/settings/all -
api/v2/settings/system
You can find Automation Analytics generated from this data collection on the Red Hat Cloud Services portal.
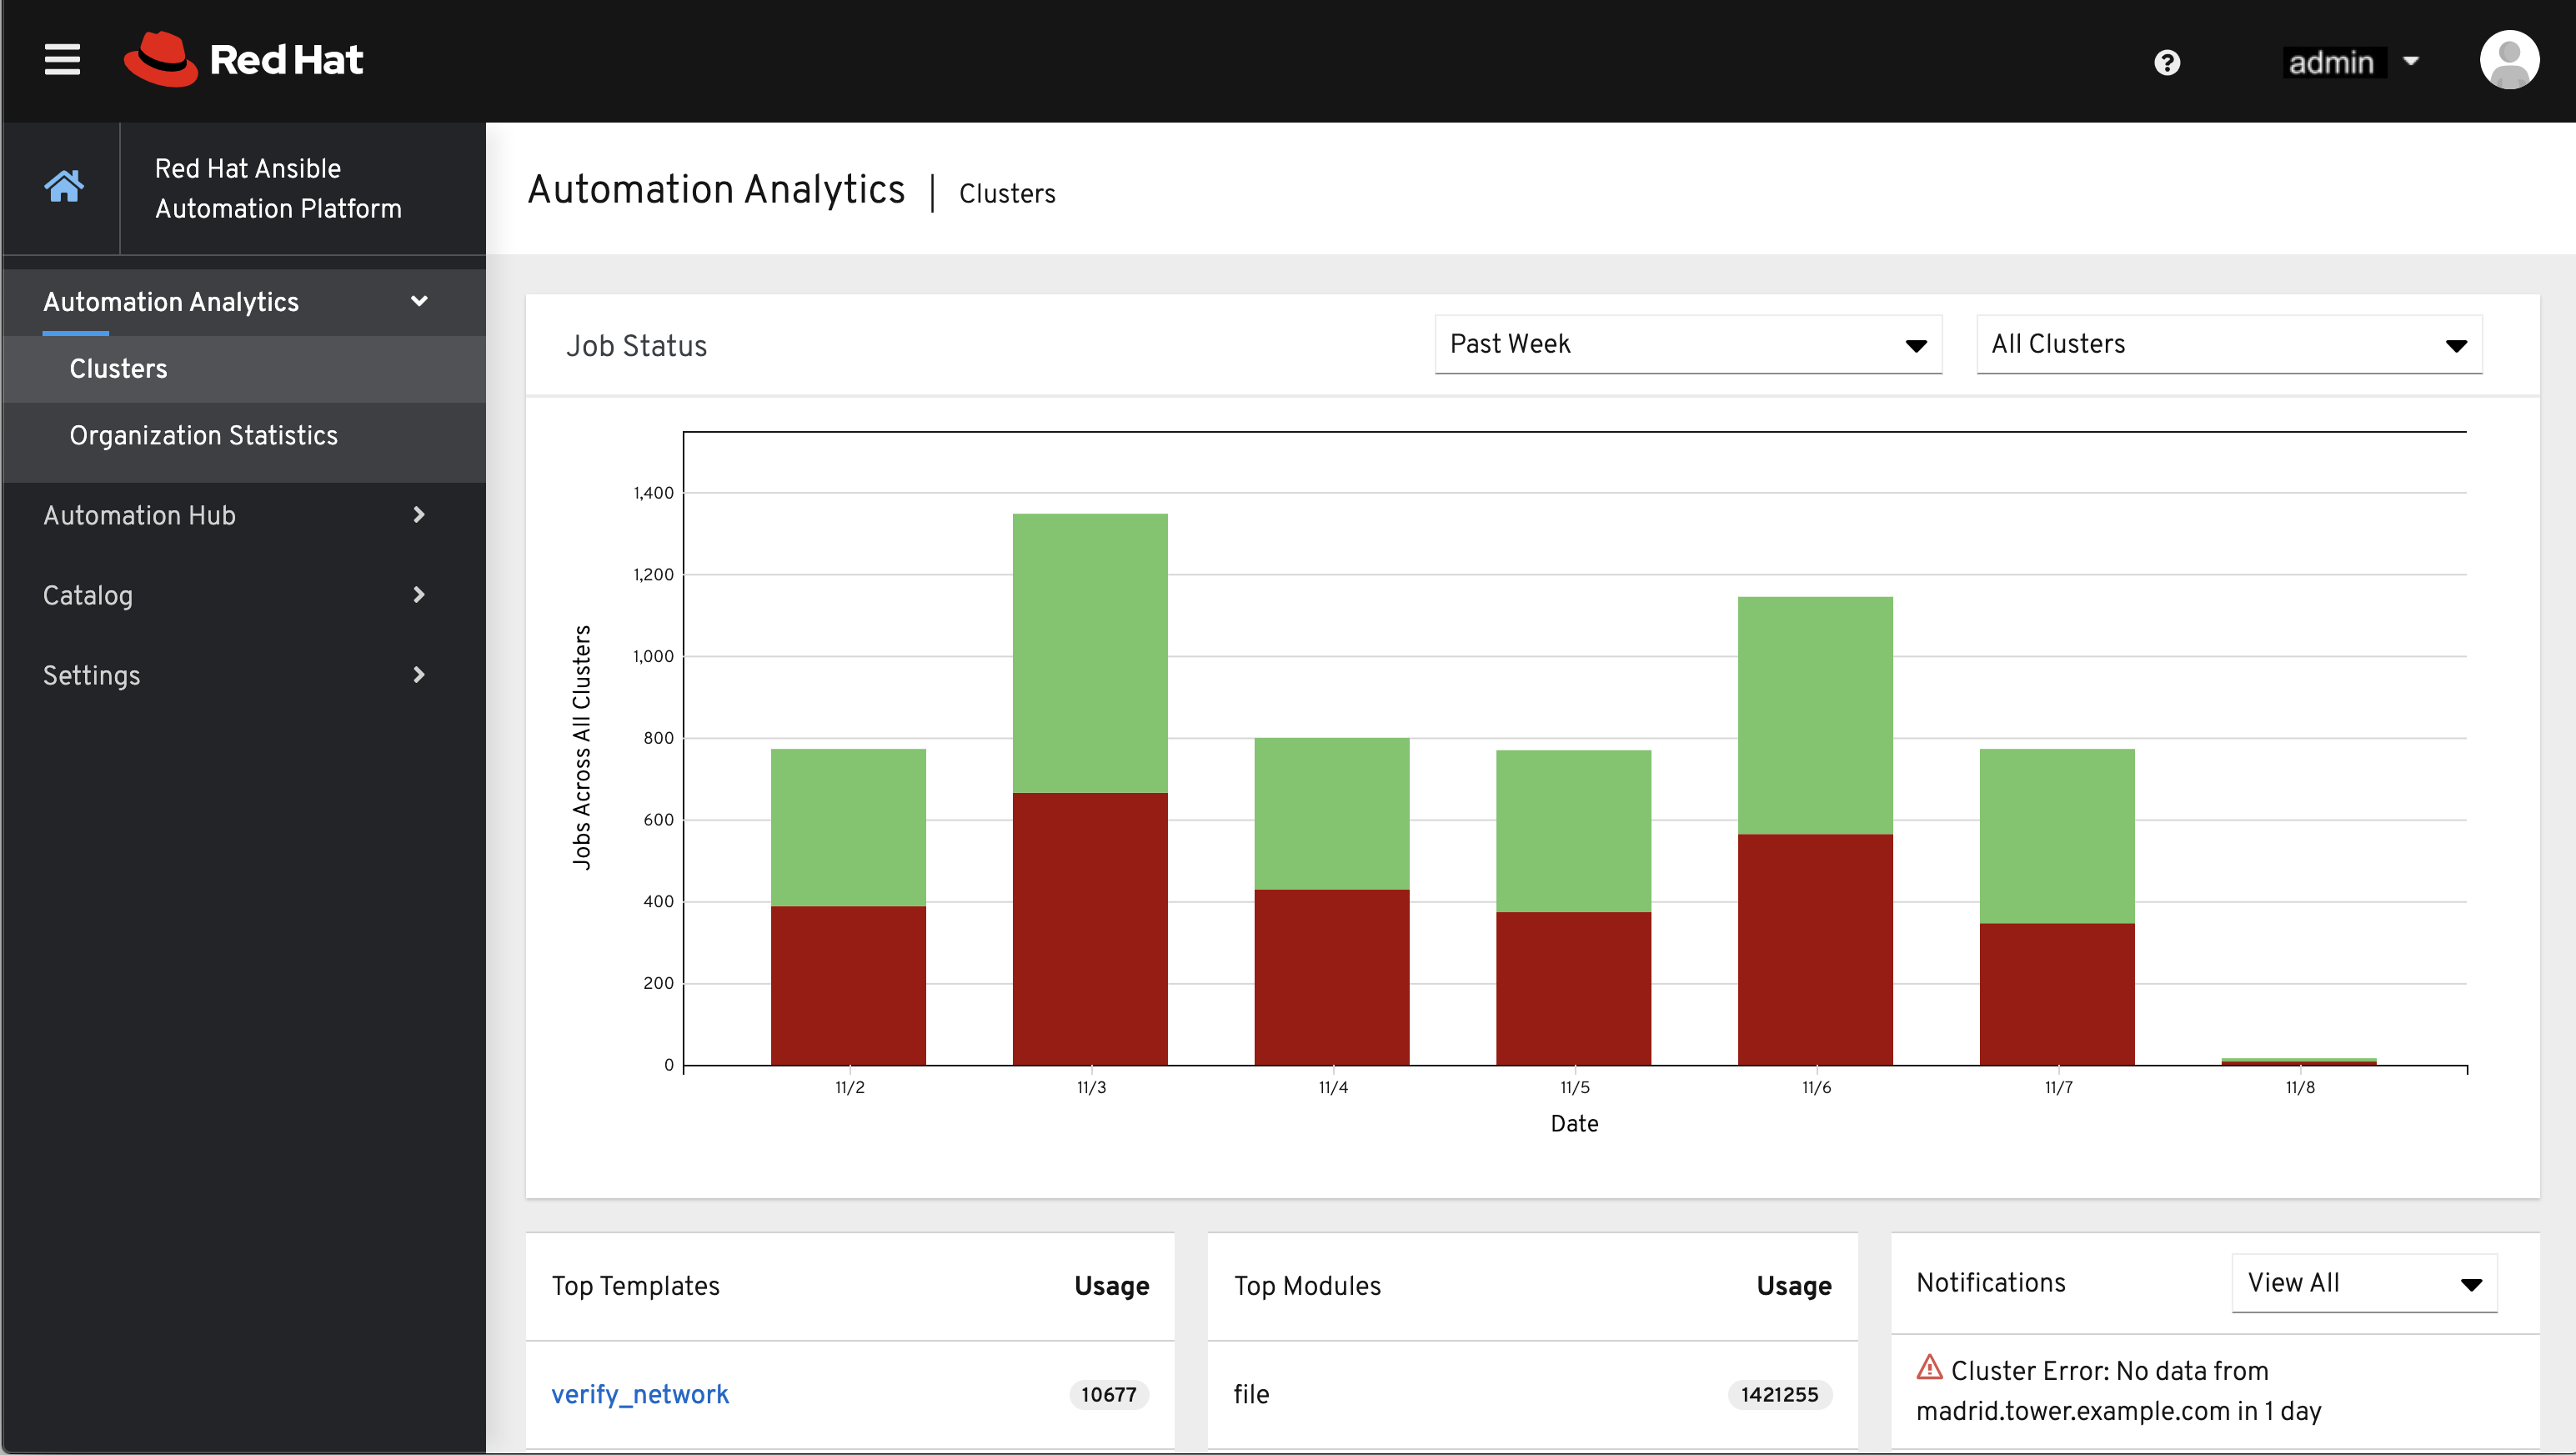
Clusters data is the default view. This graph represents the number of job runs across all automation controller clusters over a period of time. The earlier example shows a span of a week in a stacked bar-style chart that is organized by the number of jobs that ran successfully (in green) and jobs that failed (in red).
You can also select a single cluster to view its job status information.
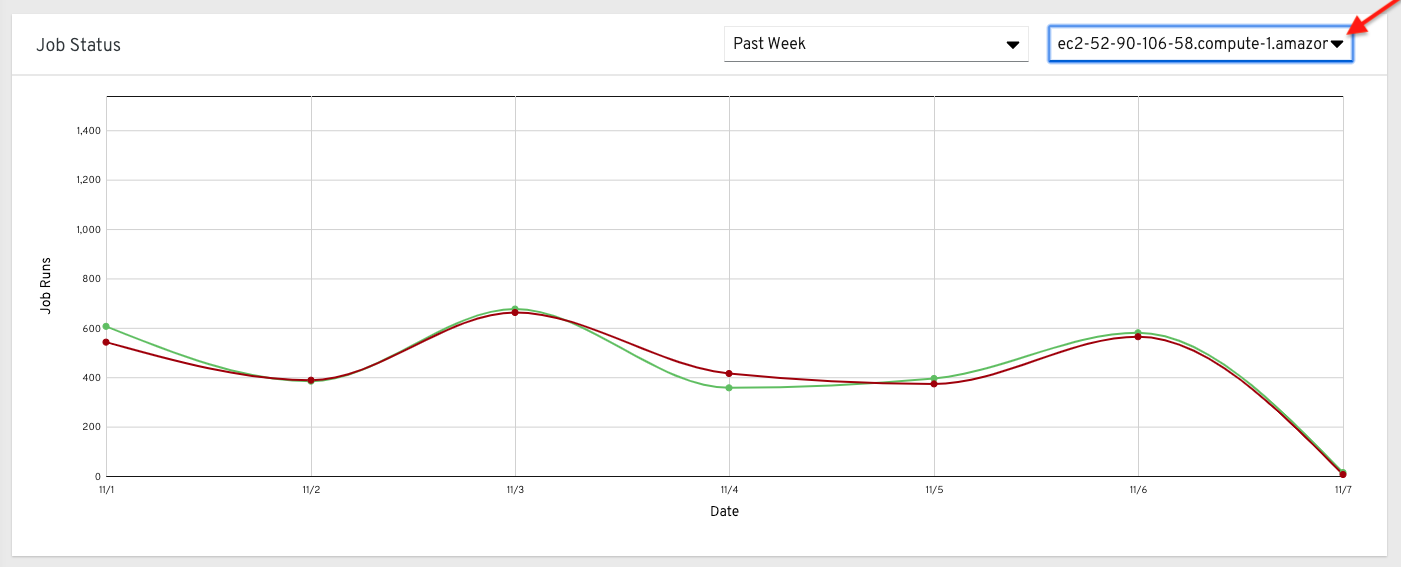
This multi-line chart represents the number of job runs for a single automation controller cluster for a specified period of time. The preceding example shows a span of a week, organized by the number of successfully running jobs (in green) and jobs that failed (in red). You can specify the number of successful and failed job runs for a selected cluster over a span of one week, two weeks, and monthly increments.
On the clouds navigation panel, select to view information for the following:
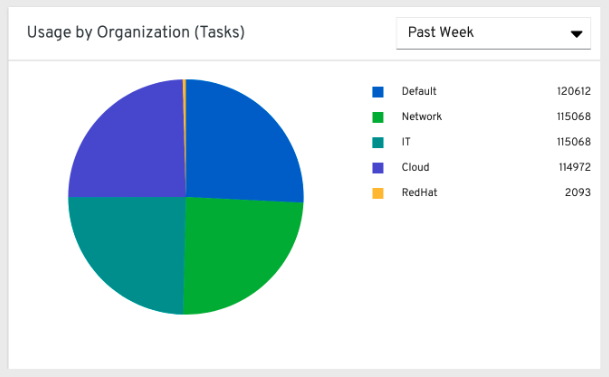
28.2.2. Use by organization
The following chart represents the number of tasks run inside all jobs by a particular organization.
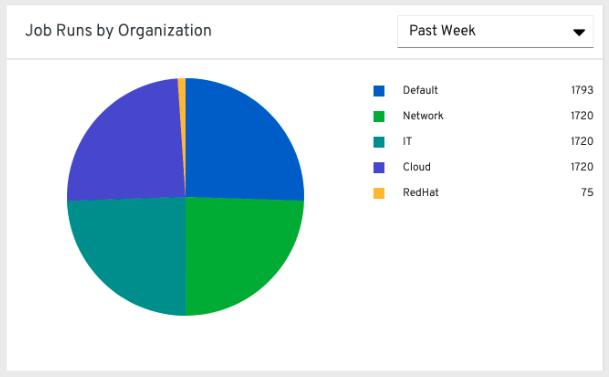
28.2.3. Job runs by organization
This chart represents automation controller use across all automation controller clusters by organization, calculated by the number of jobs run by that organization.
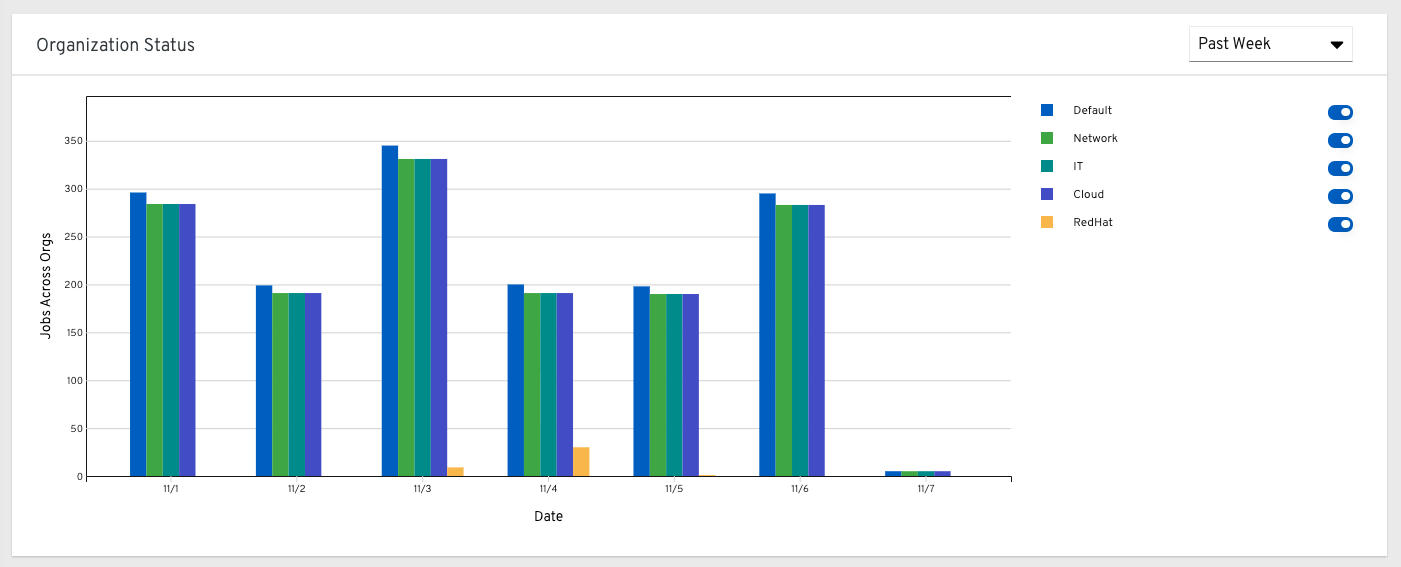
28.2.4. Organization status
This bar chart represents automation controller use by organization and date, which is calculated by the number of jobs run by that organization on a particular date.
Alternatively, you can specify to show the number of job runs per organization in one week, two weeks, and monthly increments.
28.3. Details of data collection
Automation Analytics collects the following classes of data from automation controller:
- Basic configuration, such as which features are enabled, and what operating system is being used
- Topology and status of the automation controller environment and hosts, including capacity and health
Counts of automation resources:
- organizations, teams, and users
- inventories and hosts
- credentials (indexed by type)
- projects (indexed by type)
- templates
- schedules
- active sessions
- running and pending jobs
- Job execution details (start time, finish time, launch type, and success)
- Automation task details (success, host id, playbook/role, task name, and module used)
You can use awx-manage gather_analytics (without --ship) to inspect the data that automation controller sends, so that you can satisfy your data collection concerns. This creates a tarball that contains the analytics data that is sent to Red Hat.
This file contains a number of JSON and CSV files. Each file contains a different set of analytics data.
- manifest.json
- config.json
- instance_info.json
- counts.json
- org_counts.json
- cred_type_counts.json
- inventory_counts.json
- projects_by_scm_type.json
- query_info.json
- job_counts.json
- job_instance_counts.json
- unified_job_template_table.csv
- unified_jobs_table.csv
- workflow_job_template_node_table.csv
- workflow_job_node_table.csv
- events_table.csv
28.3.1. manifest.json
manifest.json is the manifest of the analytics data. It describes each file included in the collection, and what version of the schema for that file is included.
The following is an example manifest.json file:
  "config.json": "1.1",
  "counts.json": "1.0",
  "cred_type_counts.json": "1.0",
  "events_table.csv": "1.1",
  "instance_info.json": "1.0",
  "inventory_counts.json": "1.2",
  "job_counts.json": "1.0",
  "job_instance_counts.json": "1.0",
  "org_counts.json": "1.0",
  "projects_by_scm_type.json": "1.0",
  "query_info.json": "1.0",
  "unified_job_template_table.csv": "1.0",
  "unified_jobs_table.csv": "1.0",
  "workflow_job_node_table.csv": "1.0",
  "workflow_job_template_node_table.csv": "1.0"
}
28.3.2. config.json
The config.json file contains a subset of the configuration endpoint /api/v2/config from the cluster. An example config.json is:
{
    "ansible_version": "2.9.1",
    "authentication_backends": [
        "social_core.backends.azuread.AzureADOAuth2",
        "django.contrib.auth.backends.ModelBackend"
    ],
    "external_logger_enabled": true,
    "external_logger_type": "splunk",
    "free_instances": 1234,
    "install_uuid": "d3d497f7-9d07-43ab-b8de-9d5cc9752b7c",
    "instance_uuid": "bed08c6b-19cc-4a49-bc9e-82c33936e91b",
    "license_expiry": 34937373,
    "license_type": "enterprise",
    "logging_aggregators": [
        "awx",
        "activity_stream",
        "job_events",
        "system_tracking"
    ],
    "pendo_tracking": "detailed",
    "platform": {
        "dist": [
            "redhat",
            "7.4",
            "Maipo"
        ],
        "release": "3.10.0-693.el7.x86_64",
        "system": "Linux",
        "type": "traditional"
    },
    "total_licensed_instances": 2500,
    "controller_url_base": "https://ansible.rhdemo.io",
    "controller_version": "3.6.3"
}
Which includes the following fields:
- ansible_version: The system Ansible version on the host
- authentication_backends: The user authentication backends that are available. For more information, see Setting up social authentication or Setting up LDAP authentication.
- external_logger_enabled: Whether external logging is enabled
- external_logger_type: What logging backend is in use if enabled. For more information, see Logging and aggregation.
- logging_aggregators: What logging categories are sent to external logging. For more information, see Logging and aggregation.
- free_instances: How many hosts are available in the license. A value of zero means the cluster is fully consuming its license.
- install_uuid: A UUID for the installation (identical for all cluster nodes)
- instance_uuid: A UUID for the instance (different for each cluster node)
- license_expiry: Time to expiry of the license, in seconds
- license_type: The type of the license (should be 'enterprise' for most cases)
-
pendo_tracking: State of
usability_data_collection - platform: The operating system the cluster is running on
- total_licensed_instances: The total number of hosts in the license
- controller_url_base: The base URL for the cluster used by clients (shown in Automation Analytics)
- controller_version: Version of the software on the cluster
28.3.3. instance_info.json
The instance_info.json file contains detailed information on the instances that make up the cluster, organized by instance UUID.
The following is an example instance_info.json file:
{
    "bed08c6b-19cc-4a49-bc9e-82c33936e91b": {
        "capacity": 57,
        "cpu": 2,
        "enabled": true,
        "last_isolated_check": "2019-08-15T14:48:58.553005+00:00",
        "managed_by_policy": true,
        "memory": 8201400320,
        "uuid": "bed08c6b-19cc-4a49-bc9e-82c33936e91b",
        "version": "3.6.3"
    }
    "c0a2a215-0e33-419a-92f5-e3a0f59bfaee": {
        "capacity": 57,
        "cpu": 2,
        "enabled": true,
        "last_isolated_check": "2019-08-15T14:48:58.553005+00:00",
        "managed_by_policy": true,
        "memory": 8201400320,
        "uuid": "c0a2a215-0e33-419a-92f5-e3a0f59bfaee",
        "version": "3.6.3"
    }
}
Which includes the following fields:
- capacity: The capacity of the instance for executing tasks.
- cpu: Processor cores for the instance
- memory: Memory for the instance
- enabled: Whether the instance is enabled and accepting tasks
- managed_by_policy: Whether the instance’s membership in instance groups is managed by policy, or manually managed
- version: Version of the software on the instance
28.3.4. counts.json
The counts.json file contains the total number of objects for each relevant category in a cluster.
The following is an example counts.json file:
{
    "active_anonymous_sessions": 1,
    "active_host_count": 682,
    "active_sessions": 2,
    "active_user_sessions": 1,
    "credential": 38,
    "custom_inventory_script": 2,
    "custom_virtualenvs": 4,
    "host": 697,
    "inventories": {
        "normal": 20,
        "smart": 1
    },
    "inventory": 21,
    "job_template": 78,
    "notification_template": 5,
    "organization": 10,
    "pending_jobs": 0,
    "project": 20,
    "running_jobs": 0,
    "schedule": 16,
    "team": 5,
    "unified_job": 7073,
    "user": 28,
    "workflow_job_template": 15
}
Each entry in this file is for the corresponding API objects in /api/v2, with the exception of the active session counts.
28.3.5. org_counts.json
The org_counts.json file contains information on each organization in the cluster, and the number of users and teams associated with that organization.
The following is an example org_counts.json file:
{
    "1": {
        "name": "Operations",
        "teams": 5,
        "users": 17
    },
    "2": {
        "name": "Development",
        "teams": 27,
        "users": 154
    },
    "3": {
        "name": "Networking",
        "teams": 3,
        "users": 28
    }
}
28.3.6. cred_type_counts.json
The cred_type_counts.json file contains information on the different credential types in the cluster, and how many credentials exist for each type.
The following is an example cred_type_counts.json file:
{
    "1": {
        "credential_count": 15,
        "managed_by_controller": true,
        "name": "Machine"
    },
    "2": {
        "credential_count": 2,
        "managed_by_controller": true,
        "name": "Source Control"
    },
    "3": {
        "credential_count": 3,
        "managed_by_controller": true,
        "name": "Vault"
    },
    "4": {
        "credential_count": 0,
        "managed_by_controller": true,
        "name": "Network"
    },
    "5": {
        "credential_count": 6,
        "managed_by_controller": true,
        "name": "Amazon Web Services"
    },
    "6": {
        "credential_count": 0,
        "managed_by_controller": true,
        "name": "OpenStack"
    },
28.3.7. inventory_counts.json
The inventory_counts.json file contains information on the different inventories in the cluster.
The following is an example inventory_counts.json file:
{
    "1": {
        "hosts": 211,
        "kind": "",
        "name": "AWS Inventory",
        "source_list": [
            {
                "name": "AWS",
                "num_hosts": 211,
                "source": "ec2"
            }
        ],
        "sources": 1
    },
    "2": {
        "hosts": 15,
        "kind": "",
        "name": "Manual inventory",
        "source_list": [],
        "sources": 0
    },
    "3": {
        "hosts": 25,
        "kind": "",
        "name": "SCM inventory - test repo",
        "source_list": [
            {
                "name": "Git source",
                "num_hosts": 25,
                "source": "scm"
            }
        ],
        "sources": 1
    }
    "4": {
        "num_hosts": 5,
        "kind": "smart",
        "name": "Filtered AWS inventory",
        "source_list": [],
        "sources": 0
    }
}
28.3.8. projects_by_scm_type.json
The projects_by_scm_type.json file provides a breakdown of all projects in the cluster, by source control type.
The following is an example projects_by_scm_type.json file:
{
    "git": 27,
    "hg": 0,
    "insights": 1,
    "manual": 0,
    "svn": 0
}
28.3.9. query_info.json
The query_info.json file provides details on when and how the data collection happened.
The following is an example query_info.json file:
{
    "collection_type": "manual",
    "current_time": "2019-11-22 20:10:27.751267+00:00",
    "last_run": "2019-11-22 20:03:40.361225+00:00"
}
collection_type is one of manual or automatic.
28.3.10. job_counts.json
The job_counts.json file provides details on the job history of the cluster, describing both how jobs were launched, and what their finishing status is.
The following is an example job_counts.json file:
    "launch_type": {
        "dependency": 3628,
        "manual": 799,
        "relaunch": 6,
        "scheduled": 1286,
        "scm": 6,
        "workflow": 1348
    },
    "status": {
        "canceled": 7,
        "failed": 108,
        "successful": 6958
    },
    "total_jobs": 7073
}
28.3.11. job_instance_counts.json
The job_instance_counts.json file provides the same detail as job_counts.json, broken down by instance.
The following is an example job_instance_counts.json file:
{
    "localhost": {
        "launch_type": {
            "dependency": 3628,
            "manual": 770,
            "relaunch": 3,
            "scheduled": 1009,
            "scm": 6,
            "workflow": 1336
        },
        "status": {
            "canceled": 2,
            "failed": 60,
            "successful": 6690
        }
    }
}
Note that instances in this file are by hostname, not by UUID as they are in instance_info.
28.3.12. unified_job_template_table.csv
The unified_job_template_table.csv file provides information on job templates in the system. Each line contains the following fields for the job template:
- id: Job template id.
- name: Job template name.
- polymorphic_ctype_id: The id of the type of template it is.
-
model: The name of the
polymorphic_ctype_idfor the template. Examples includeproject,systemjobtemplate,jobtemplate,inventorysource, andworkflowjobtemplate. - created: When the template was created.
- modified: When the template was last updated.
-
created_by_id: The
useridthat created the template. Blank if done by the system. -
modified_by_id: The
useridthat last modified the template. Blank if done by the system. - current_job_id: Currently executing job id for the template, if any.
- last_job_id: Last execution of the job.
- last_job_run: Time of last execution of the job.
-
last_job_failed: Whether the
last_job_idfailed. -
status: Status of
last_job_id. - next_job_run: Next scheduled execution of the template, if any.
-
next_schedule_id: Schedule id for
next_job_run, if any.
28.3.13. unified_jobs_table.csv
The unified_jobs_table.csv file provides information on jobs run by the system.
Each line contains the following fields for a job:
- id: Job id.
- name: Job name (from the template).
- polymorphic_ctype_id: The id of the type of job it is.
-
model: The name of the
polymorphic_ctype_idfor the job. Examples includejobandworkflow. - organization_id: The organization ID for the job.
-
organization_name: Name for the
organization_id. - created: When the job record was created.
- started: When the job started executing.
- finished: When the job finished.
- elapsed: Elapsed time for the job in seconds.
- unified_job_template_id: The template for this job.
-
launch_type: One of
manual,scheduled,relaunched,scm,workflow, ordependency. - schedule_id: The id of the schedule that launched the job, if any,
- instance_group_id: The instance group that executed the job.
- execution_node: The node that executed the job (hostname, not UUID).
- controller_node: The automation controller node for the job, if run as an isolated job, or in a container group.
- cancel_flag: Whether the job was canceled.
- status: Status of the job.
- failed: Whether the job failed.
- job_explanation: Any additional detail for jobs that failed to execute properly.
- forks: Number of forks executed for this job.
28.3.14. workflow_job_template_node_table.csv
The workflow_job_template_node_table.csv file provides information on the nodes defined in workflow job templates on the system.
Each line contains the following fields for a worfklow job template node:
- id: Node id.
- created: When the node was created.
- modified: When the node was last updated.
- unified_job_template_id: The id of the job template, project, inventory, or other parent resource for this node.
- workflow_job_template_id: The workflow job template that contains this node.
- inventory_id: The inventory used by this node.
- success_nodes: Nodes that are triggered after this node succeeds.
- failure_nodes: Nodes that are triggered after this node fails.
- always_nodes: Nodes that always are triggered after this node finishes.
- all_parents_must_converge: Whether this node requires all its parent conditions satisfied to start.
28.3.15. workflow_job_node_table.csv
The workflow_job_node_table.csv provides information on the jobs that have been executed as part of a workflow on the system.
Each line contains the following fields for a job run as part of a workflow:
- id: Node id.
- created: When the node was created.
- modified: When the node was last updated.
- job_id: The job id for the job run for this node.
- unified_job_template_id: The id of the job template, project, inventory, or other parent resource for this node.
- workflow_job_template_id: The workflow job template that contains this node.
- inventory_id: The inventory used by this node.
- success_nodes: Nodes that are triggered after this node succeeds.
- failure_nodes: Nodes that are triggered after this node fails.
- always_nodes: Nodes that always are triggered after this node finishes.
- do_not_run: Nodes that were not run in the workflow due to their start conditions not being triggered.
- all_parents_must_converge: Whether this node requires all its parent conditions satisfied to start.
28.3.16. events_table.csv
The events_table.csv file provides information on all job events from all job runs in the system.
Each line contains the following fields for a job event:
- id: Event id.
- uuid: Event UUID.
- created: When the event was created.
- parent_uuid: The parent UUID for this event, if any.
- event: The Ansible event type.
-
task_action: The module associated with this event, if any (such as
commandoryum). -
failed: Whether the event returned
failed. -
changed: Whether the event returned
changed. - playbook: Playbook associated with the event.
- play: Play name from playbook.
- task: Task name from playbook.
- role: Role name from playbook.
- job_id: Id of the job this event is from.
- host_id: Id of the host this event is associated with, if any.
- host_name: Name of the host this event is associated with, if any.
- start: Start time of the task.
- end: End time of the task.
- duration: Duration of the task.
- warnings: Any warnings from the task or module.
- deprecations: Any deprecation warnings from the task or module.
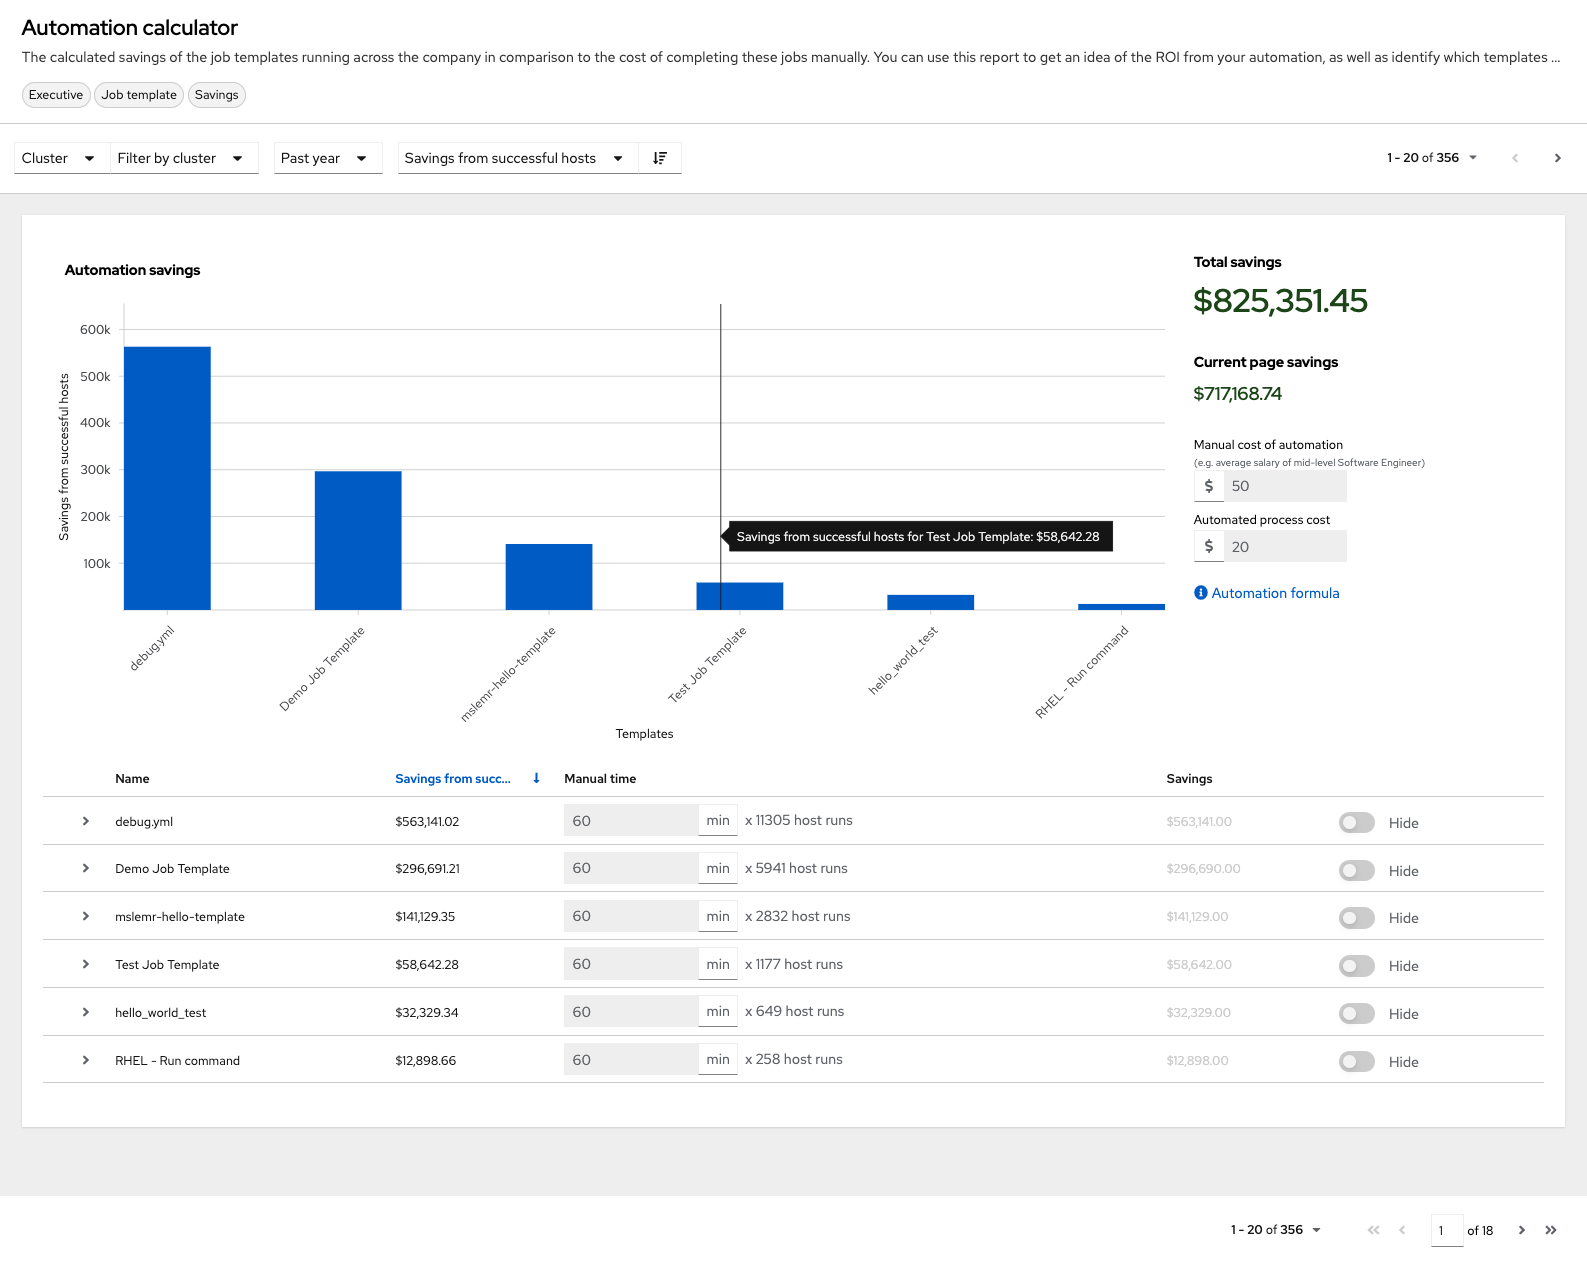
28.4. Analytics Reports
Reports from collection are accessible through the automation controller UI if you have superuser-level permissions. By including the analytics view on-prem where it is most convenient, you can access data that can affect your day-to-day work. This data is aggregated from the automation provided on console.redhat.com.
Currently available is a view-only version of the Automation Calculator utility that shows a report that represents (possible) savings to the subscriber.
This option is available for technical preview and is subject to change in a future release. To preview the analytic reports view, set the Enable Preview of New User Interface toggle to On from the Miscellaneous System Settings option of the menu.
After saving, logout and log back in to access the options under the Analytics section on the navigation panel.
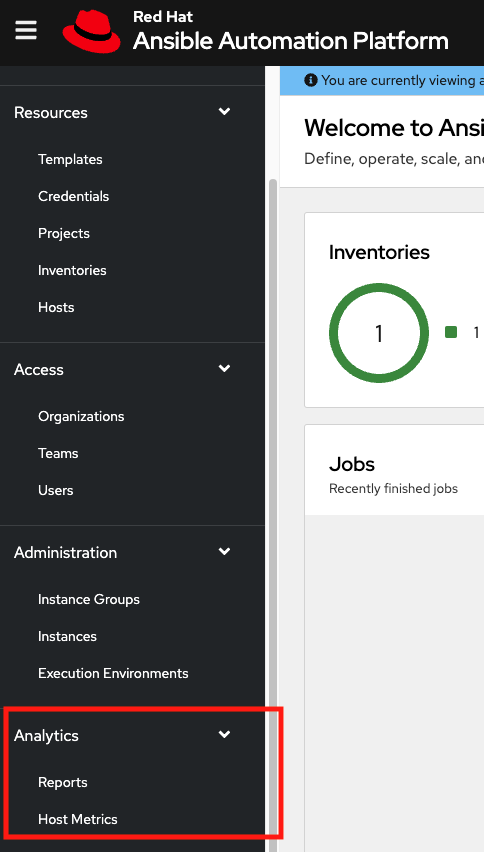
Host Metrics is another analytics report collected for host data. The ability to access this option from this part of the UI is currently in tech preview and is subject to change in a future release. For more information, see the Host Metrics view in Automation controller configuration.