Chapter 7. Managing the Cluster
7.1. Managing the Cluster
The management functions of the dashboard allow you to view and modify configuration settings, and manage cluster resources.
7.2. Viewing the CRUSH map
The CRUSH map contains a list of OSDs and related information. Together, the CRUSH map and CRUSH algorithm determine how and where data is stored. The Red Hat Ceph Storage dashboard allows you to view different aspects of the CRUSH map, including OSD hosts, OSD daemons, ID numbers, device class, and more.
The CRUSH map allows you to determine which node a specific OSD ID is running on. This is helpful if there is an issue with an OSD.
Prerequisites
- A running Red Hat Ceph Storage cluster.
- Dashboard is installed.
Procedure
- Log in to the Dashboard.
- On the navigation bar, click Cluster.
Click CRUSH map.
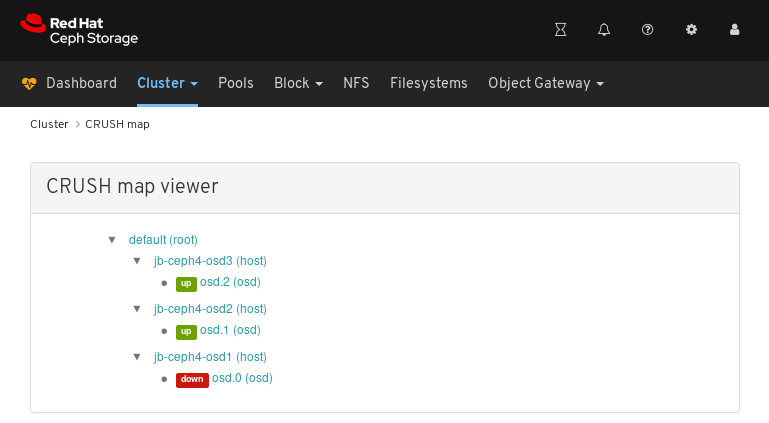
In the above example, you can see the default CRUSH map, three nodes, and OSDs running on two of the three nodes.
Click on the CRUSH map name, nodes, or OSDs, to view details about each object.
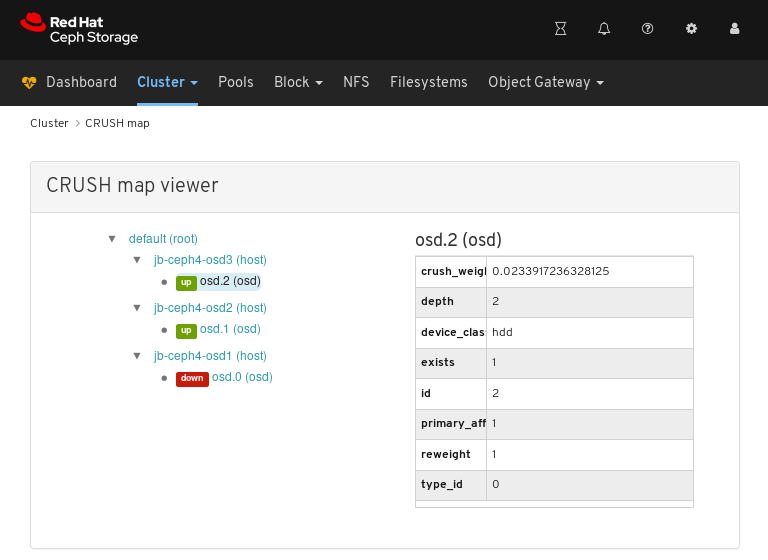
In the above example, you can see the values of variables related to an OSD running on the
jb-rhel-osd3node. In particular, note theidis2.
Additional Resources
- For more information about the CRUSH map, see CRUSH administration in the Storage strategies guide.
7.3. Configuring manager modules
The Red Hat Ceph Storage dashboard allows you to view and configure manager module parameters.
Prerequisites
- A running Red Hat Ceph Storage cluster.
- Dashboard is installed.
Procedure
- Log in to the Dashboard.
- On the navigation bar, click Cluster.
Click Manager modules:
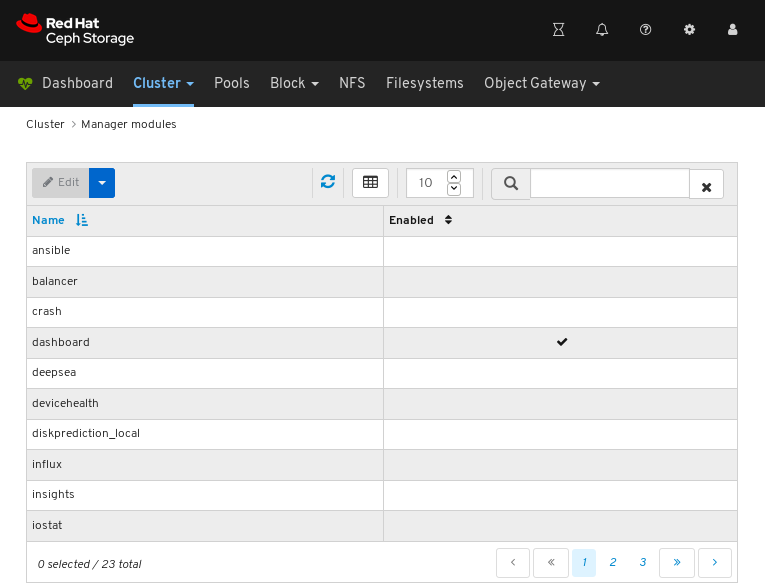
The above screenshot shows the first of three pages of manager modules.
Click on a row for a module you want to configure:

Not all modules have configurable parameters. If a module is not configurable, the Edit button is disabled.
Towards the upper left of the page, click the Edit button to load the page with the configurable parameters.
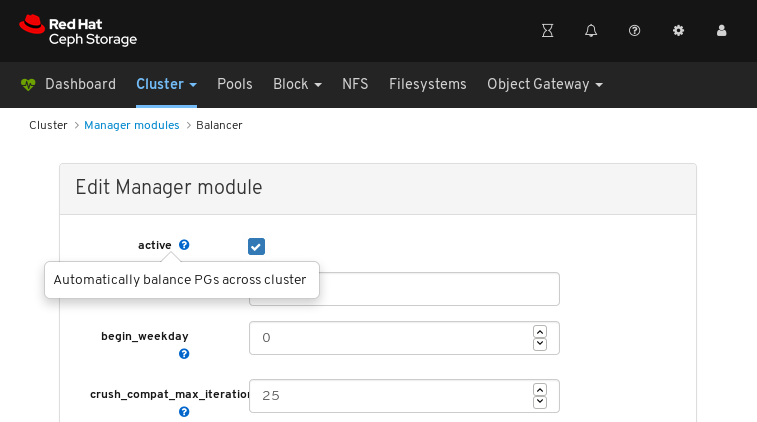
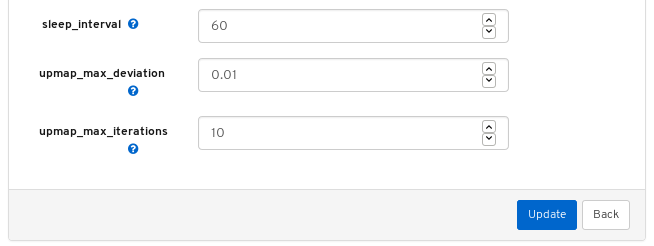
The above screenshot shows parameters that you can change for the balancer module. To display a description of a parameter, click the question mark button.
To change a parameter, modify the state of the parameter and click the Update button at the bottom of the page:
A notification confirming the change appears in the upper-right corner of the page:

Additional Resources
- See Using the Ceph Manager balancer module in the Red Hat Ceph Storage Operations Guide.
7.4. Filtering logs
The Red Hat Ceph Storage Dashboard allows you to view and filter logs based on several criteria. The criteria include priority, keyword, date, and time range.
Prerequisites
- A running Red Hat Ceph Storage cluster.
- The Dashboard is installed.
- Log entries have been generated since the Monitor was last started.
The Dashboard logging feature only displays the thirty latest high level events. The events are stored in memory by the Monitor. The entries disappear after restarting the Monitor. If you need to review detailed or older logs, refer to the file based logs. See Additional Resources below for more information about file based logs.
Procedure
- Log in to the Dashboard.
-
Click the
Clusterdrop-down menu in the top navigation bar. -
Click
Logsin the drop-down menu. View the last thirty unfiltered log entries.
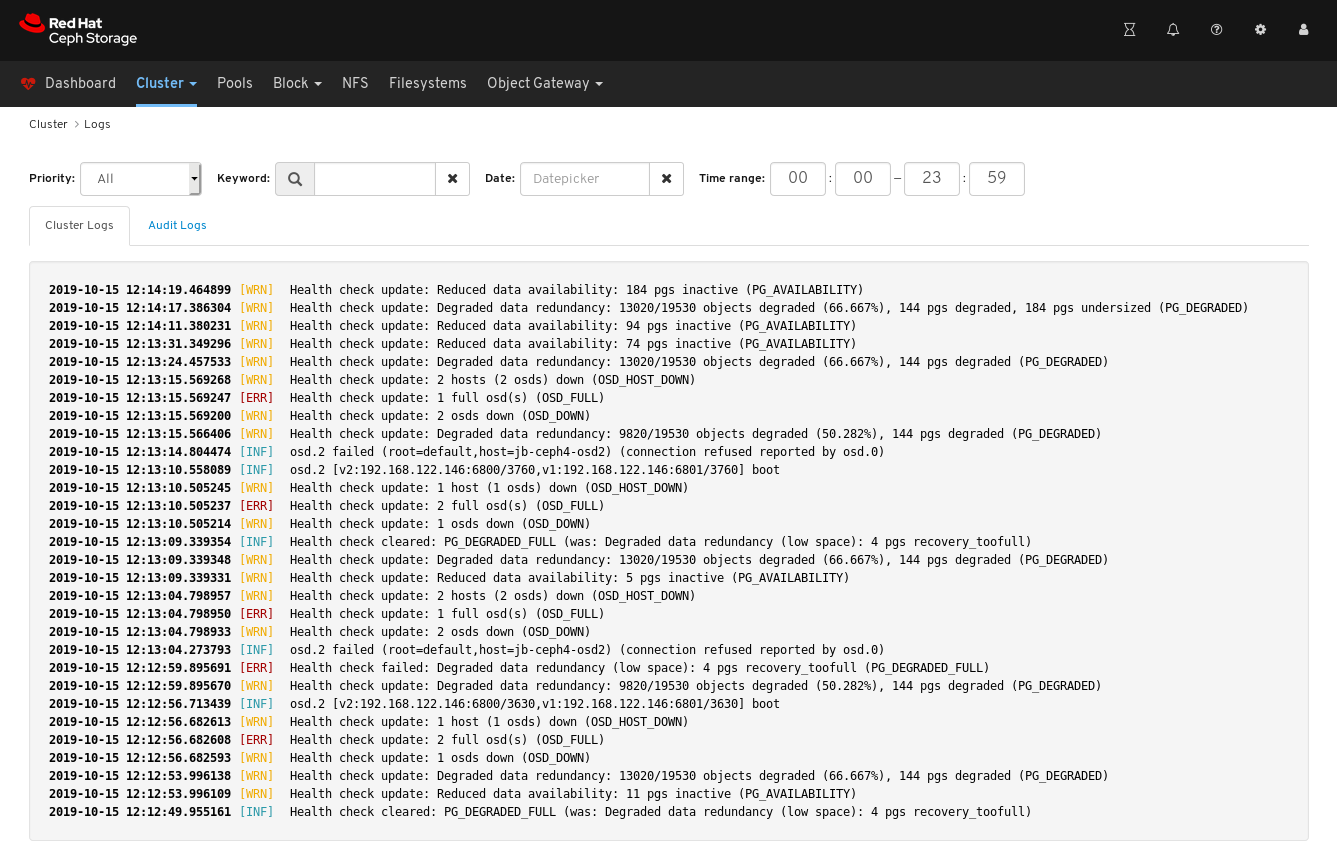
To filter by priority, click the
Prioritydrop-down menu and select eitherInfo,Warning, orError. The example below only shows log entries with the priority ofError.
To filter by keyword, enter text into the
Keywordform. The example below only shows log entries that include the textosd.2.
To filter by date, click the
Dateform and either use the date picker to select a date from the menu, or enter a date in the form of YYYY-MM-DD. The example below only shows log entries with the date of2019-10-15.
To filter by time, enter a range in the
Time rangefields using the HH:MM - HH:MM format. Hours must be entered using numbers0to23. The example below only shows log entries from12:14to12:23.
To combine filters, set two or more filters. The example below only shows entries that have both a Priority of
Warningand the keyword ofosd.
Additional Resources
- See the Configuring Logging section in the Troubleshooting Guide for more information.
- See the Understanding Ceph Logs section in the Troubleshooting Guide for more information.
7.5. Configuring OSD recovery settings
As a storage administrator, you can change the OSD recovery priority and customize how the cluster recovers. This allows you to influence your cluster’s rebuild performance or recovery speed.
Prerequisites
- A Red Hat Ceph Storage cluster.
- The dashboard is installed.
Procedure
- Log in to the dashboard.
- Click the Cluster drop-down menu in the top navigation bar.
- Click OSDs in the drop-down menu.
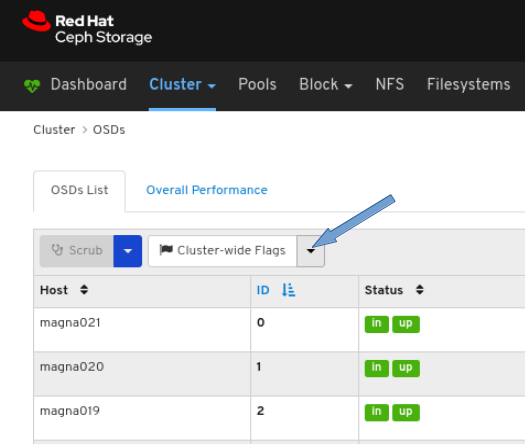
Click the Cluster-Wide Flags drop-down menu.
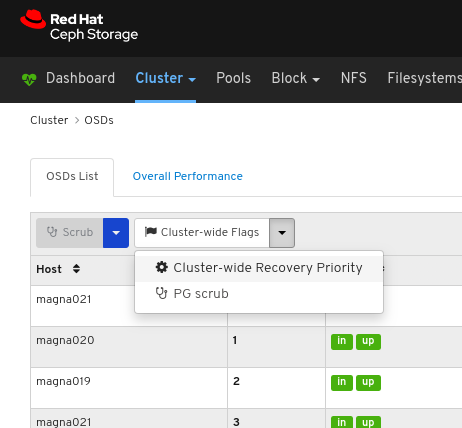
Select Cluster-wide Recovery Priority in the drop-down.
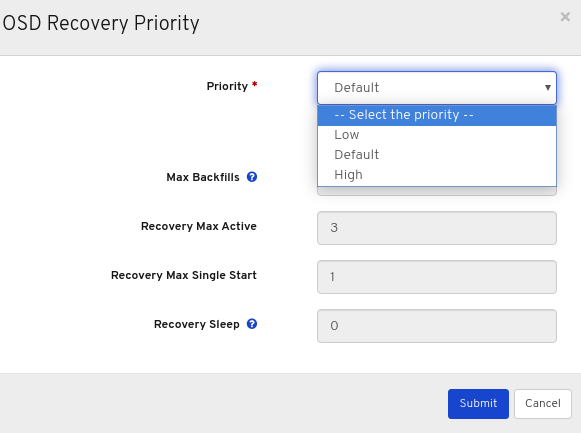
Optional: Select Priority in the drop-down menu , and then click the Submit button.
NoteThere are 3 predefined options: Low, Default, High
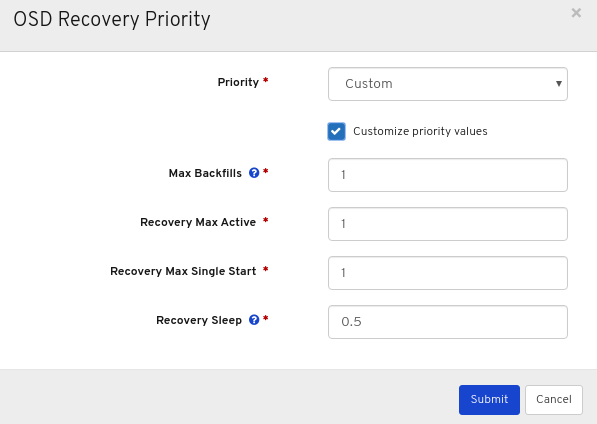
Optional: Click Customize priority values, make the required changes, and then click the Submit button.
A notification towards the top right corner of the page pops up indicating the flags were updated successfully.

Additional Resources
- For more information on OSD recovery, see OSD Recovery in the Configuration Guide.
7.6. Viewing and monitoring configuration
The Red Hat Ceph Storage Dashboard allows you to view the list of all configuration options for the Ceph cluster. You can also edit the configuration on the Dashboard.
Prerequisites
- A running Red Hat Ceph Storage cluster.
- Dashboard is installed.
Procedure
- Log in to the Dashboard.
- On the navigation bar, click Cluster and then click Configuration.
To view the details of the configuration, click its row:
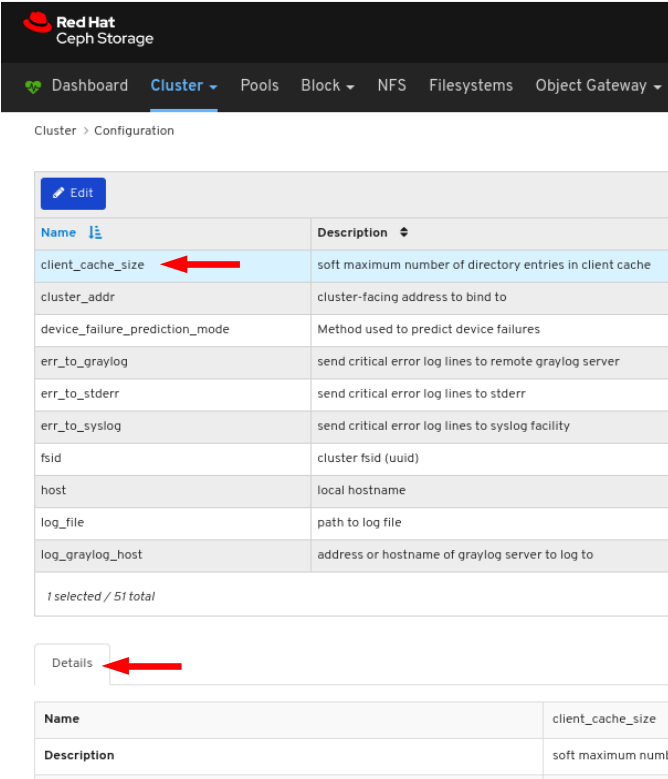
You can search for the configuration using the Search box:

You can filter for the configuration using Level, Service or Source drop-down:

To edit a configuration, click its row and click the Edit button:

In the dialog window, edit the required parameters and Click the Save button:
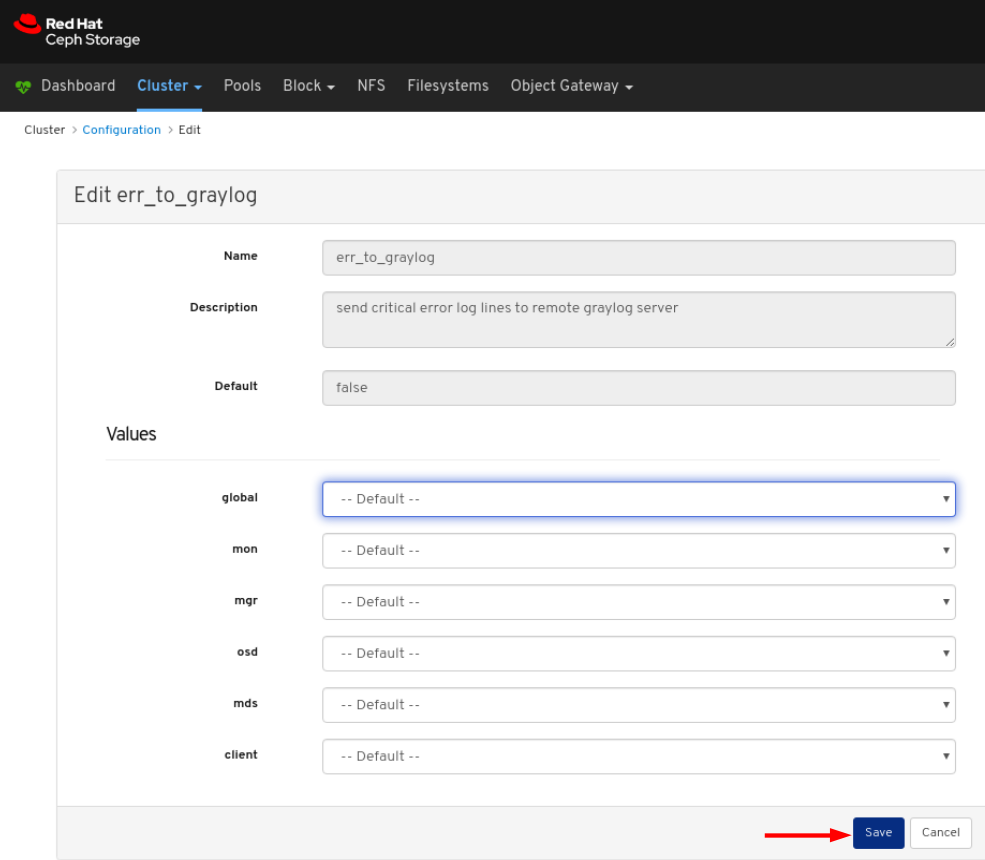
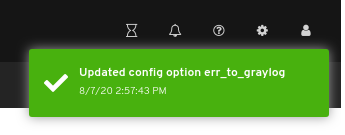
A notification confirming the change appears in the upper-right corner of the page.
Additional Resources
- See the Ceph Network Configuration chapter in the Red Hat Ceph Storage Configuration Guide for more details.
7.7. Managing the Prometheus environment
To monitor a Ceph storage cluster with Prometheus you can configure and enable the Prometheus exporter so the metadata information about the Ceph storage cluster can be collected.
Prerequisites
- A running Red Hat Ceph Storage 3.1 or higher cluster.
- Installation of the Red Hat Ceph Storage Dashboard.
- Root-level access to the Red Hat Ceph Storage Dashboard node.
Procedure
Open and edit the
/etc/prometheus/prometheus.ymlfile.Under the
globalsection, set thescrape_intervalandevaluation_intervaloptions to 15 seconds.Example
global:
  scrape_interval:     15s
  evaluation_interval: 15s
Under the
scrape_configssection, add thehonor_labels: trueoption, and edit thetargets, andinstanceoptions for each of theceph-mgrnodes.Example
scrape_configs: - job_name: 'node' honor_labels: true static_configs: - targets: [ 'node1.example.com:9100' ] labels: instance: "node1.example.com" - targets: ['node2.example.com:9100'] labels: instance: "node2.example.com"NoteUsing the
honor_labelsoption enables Ceph to output properly-labelled data relating to any node in the Ceph storage cluster. This allows Ceph to export the properinstancelabel without Prometheus overwriting it.To add a new node, simply add the
targets, andinstanceoptions in the following format:Example
- targets: [ 'new-node.example.com:9100' ] labels: instance: "new-node"NoteThe
instancelabel has to match what appears in Ceph’s OSD metadatainstancefield, which is the short host name of the node. This helps to correlate Ceph stats with the node’s stats.
Add Ceph targets to the
/etc/prometheus/ceph_targets.ymlfile in the following format.Example
[
    {
        "targets": [ "cephnode1.example.com:9283" ],
        "labels": {}
    }
]
Enable the Prometheus module:
[root@mon ~]# ceph mgr module enable prometheus
7.8. Restoring grafana-server and Prometheus
The grafana-server includes the Grafana UI, Prometheus, the containers, and the Red Hat Ceph Storage configuration. When the grafana-server crashes or is faulty, you can restore it by taking a back-up of the files and restoring it using the backed-up files. For Prometheus, you can take an external back-up and then restore the data.
Prerequisites
- A running Red Hat Ceph Storage cluster.
- Root-level access to the Grafana nodes.
Procedure
Take the back-up of the Grafana database:
On the grafana-server node, stop the Grafana service:
Example
[root@node04 ~]# systemctl stop grafana-server.service
[root@node04 ~]# systemctl status grafana-server.service
Take the back-up of the Grafana database:
Example
[root@node04 ~]# cp /var/lib/grafana/grafana.db /var/lib/grafana/grafana_backup.dbOn the grafana-server node, restart the Grafana service:
Example
[root@node04 ~]# systemctl restart grafana-server.service
Restore the grafana-server:
On the grafana-server node, if the Grafana service is running, stop the service:
Example
[root@node04 ~]# systemctl stop grafana-server.service
[root@node04 ~]# systemctl status grafana-server.service
Move the backed-up
grafana.dbfile to/var/lib/grafana/directory:Example
[root@node04 ~]# mv /var/lib/grafana/grafana_backup.db /var/lib/grafana/On the grafana-server node, restart the Grafana service:
Example
[root@node04 ~]# systemctl restart grafana-server.service
For the Prometheus alerts, you have to take external back-up of
prometheus_data_dirdirectory, a Ceph-Ansible setting which by default isvar/lib/prometheusdirectory and restore the service using the backed-up directory.On the grafana-server node, stop the Prometheus service:
Example
[root@node04 ~]# systemctl stop prometheus.service
[root@node04 ~]# systemctl status prometheus.service
Take the back-up of the default Prometheus directory:
Example
[root@node04 ~]# cp /var/lib/prometheus/ /var/lib/prometheus_backup/Replace the
prometheus_data_dirdirectory with the backed-up directory:Example
[root@node04 ~]# mv /var/lib/prometheus_backup/ /var/lib/prometheus_data_dirOn the grafana-server node, restart the prometheus service:
Example
[root@node04 ~]# systemctl restart prometheus.service [root@node04 ~]# systemctl status prometheus.serviceNoteIf you have made changes to the Prometheus parameters in
group_vars/all.ymlfile, then you have to rerun the playbook.
Optional: If the changes do not reflect on the Red Hat Ceph Storage Dashboard, then you have to disable and then enable the dashboard:
Example
[root@node04 ~]# ceph mgr module disable dashboard
[root@node04 ~]# ceph mgr module enable dashboard
7.9. Viewing and managing alerts
As a storage administrator, you can see the details of alerts and create silences for them on the Red Hat Ceph Storage dashboard. This includes the following pre-defined alerts:
- OSD(s) Down
- Ceph Health Error
- Ceph Health Warning
- Cluster Capacity Low
- Disk(s) Near Full
- MON(s) Down
- Network Errors
- OSD Host Loss Check
- OSD Host(s) Down
- OSD(s) with High PG Count
- PG(s) Stuck
- Pool Capacity Low
- Slow OSD Responses
7.9.1. Viewing alerts
After an alert has fired, you can view it on the Red Hat Ceph Storage Dashboard. You can also enable the dashboard to send an email about the alert.
Simple mail transfer protocol (SMTP) and SSL is not supported in Red Hat Ceph Storage 4 cluster.
Prerequisite
- A running Red Hat Ceph Storage cluster.
- Dashboard is installed.
- An alert fired.
Procedure
- Log in to the Dashboard.
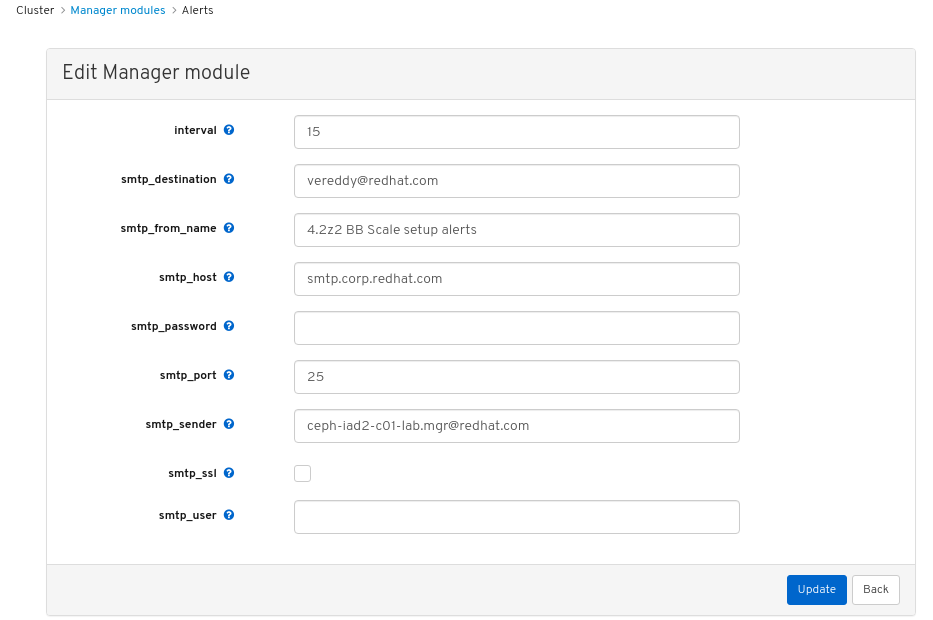
Customize the alerts module on the dashboard to get an email alert for the storage cluster:
- On the navigation bar, click Cluster.
- Select Manager modules.
- Select alerts module.
- In the Edit drop-down menu, select Edit.
In the Edit Manager module, update the required parameters and click Update.
Figure 7.1. Edit Manager module for alerts
- On the navigation bar, click Cluster.
- Select Monitoring from the drop-down menu.
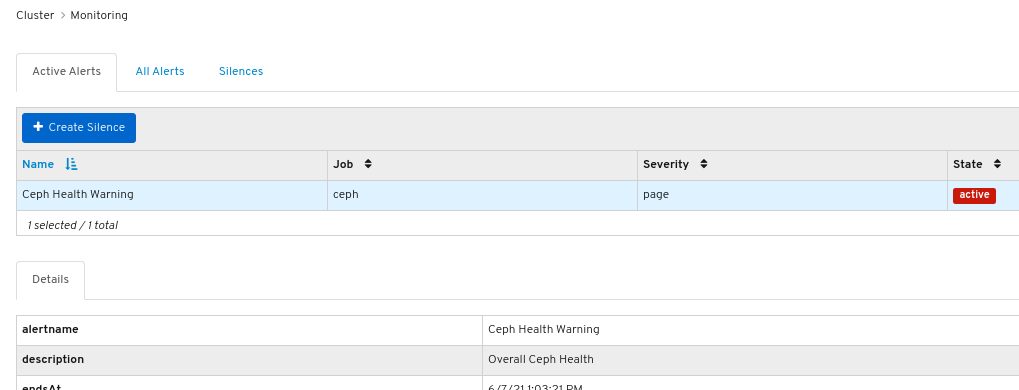
To view details about the alert, click on its row:
Figure 7.2. Alert Details
- To view the source of an alert, click on its row, and then click Source.
7.9.2. Creating a silence
You can create a silence for an alert for a specified amount of time on the Red Hat Ceph Storage Dashboard.
Prerequisite
- A running Red Hat Ceph Storage cluster.
- Dashboard is installed.
- An alert fired.
Procedure
- Log in to the Dashboard.
- On the navigation bar, click Cluster.
- Select Monitoring from the drop-down menu.
- Click on the row for the alert and then click +Create Silence.
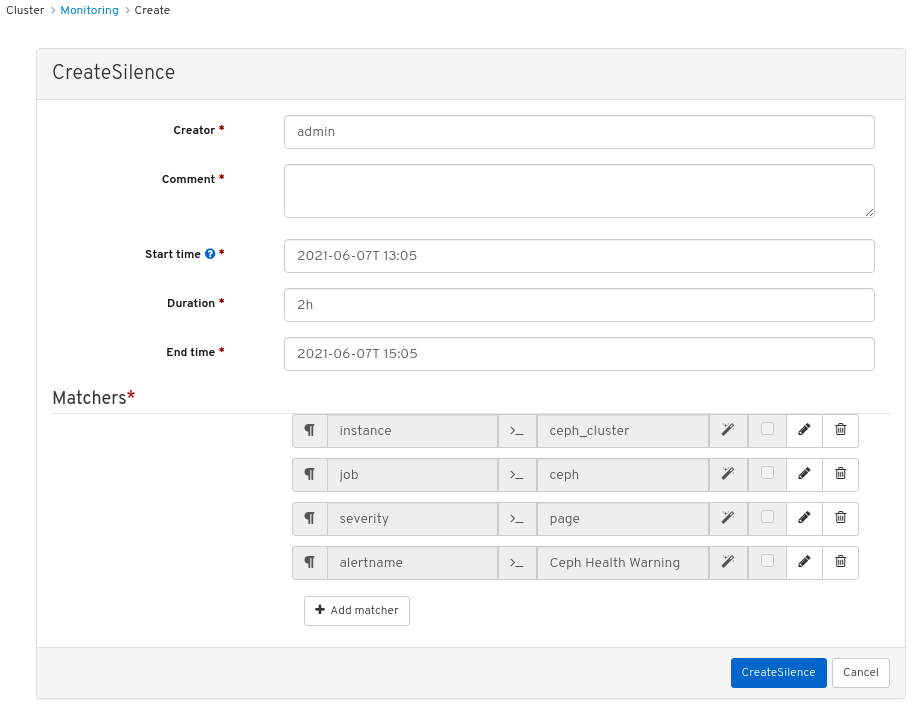
In the CreateSilence window, Add the details for the Duration and click Create Silence.
Figure 7.3. Create Silence
- You get a notification that the silence was created successfully.
7.9.3. Re-creating a silence
You can re-create a silence from an expired silence on the Red Hat Ceph Storage Dashboard.
Prerequisite
- A running Red Hat Ceph Storage cluster.
- Dashboard is installed.
- An alert fired.
- A silence created for the alert.
Procedure
- Log in to the Dashboard.
- Select Monitoring from the drop-down menu.
- Click the Silences tab.
- Click on the row for the expired silence.
- Click the Recreate button.
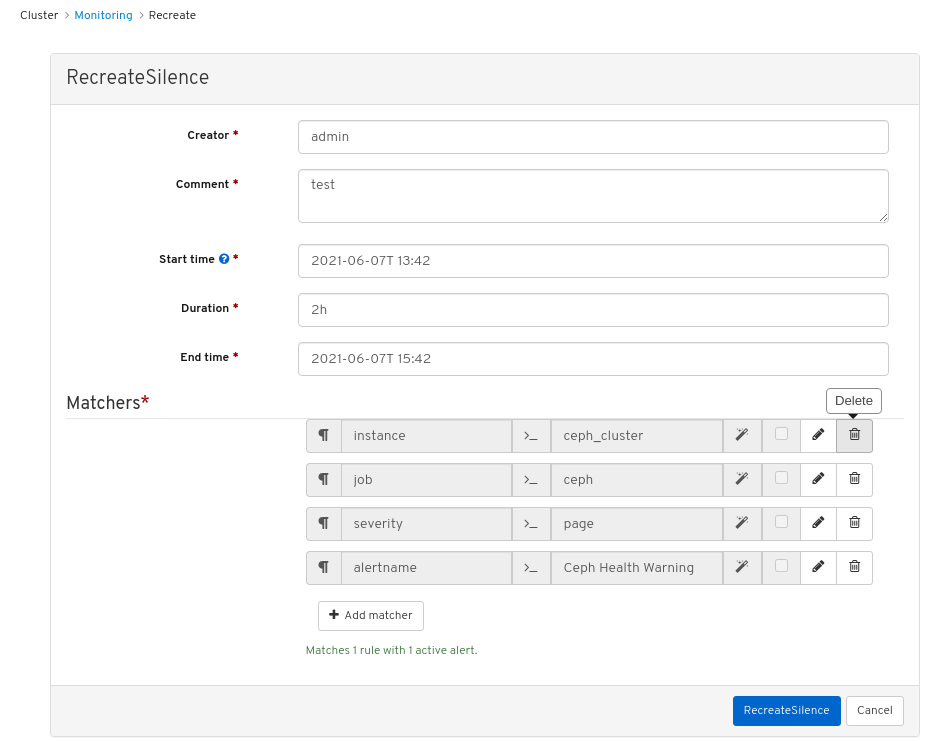
In the RecreateSilence window, add the details and click RecreateSilence.
Figure 7.4. Recreate silence
- You get a notification that the silence was recreated successfully.
7.9.4. Editing a silence
You can edit an active silence, for example, to extend the time it is active on the Red Hat Ceph Storage Dashboard. If the silence has expired, you can either recreate a silence or create a new silence for the alert.
Prerequisite
- A running Red Hat Ceph Storage cluster.
- Dashboard is installed.
- An alert fired.
- A silence created for the alert.
Procedure
- Log in to the Dashboard.
- On the navigation bar, click Cluster.
- Select Monitoring from the drop-down menu.
- Click the Silences tab.
- Click on the row for the silence.
- In the Edit drop-down menu, select Edit.
In the EditSilence window, update the details and click Edit Silence.
Figure 7.5. Edit silence

- You get a notification that the silence was updated successfully.
7.9.5. Expiring a silence
You can expire a silence so any matched alerts will not be suppressed on the Red Hat Ceph Storage Dashboard.
Prerequisite
- A running Red Hat Ceph Storage cluster.
- Dashboard is installed.
- An alert fired.
- A silence created for the alert.
Procedure
- Log in to the Dashboard.
- On the navigation bar, click Cluster.
- Select Monitoring from the drop-down menu.
- Click the Silences tab.
- Click on the row for the silence.
- In the Edit drop-down menu, select Expire.
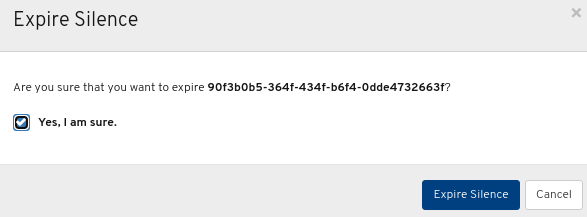
In the Expire Silence dialog box, select Yes, I am sure, and then click Expire Silence.
Figure 7.6. Expire Silence
- You get a notification that the silence was expired successfully.
7.10. Managing pools
As a storage administrator, you can create, delete, and edit pools.
Prerequisites
- A running Red Hat Ceph Storage cluster.
- Dashboard is installed
7.10.1. Creating pools
You can create pools to logically partition your storage objects.
Prerequisites
- A running Red Hat Ceph Storage cluster.
- Dashboard is installed.
Procedure
- Log in to the dashboard.
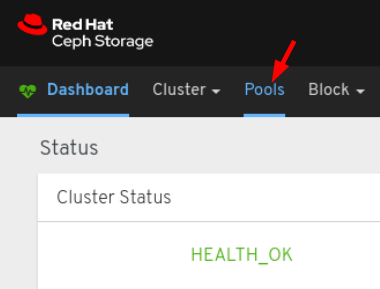
On the navigation bar, click Pools.
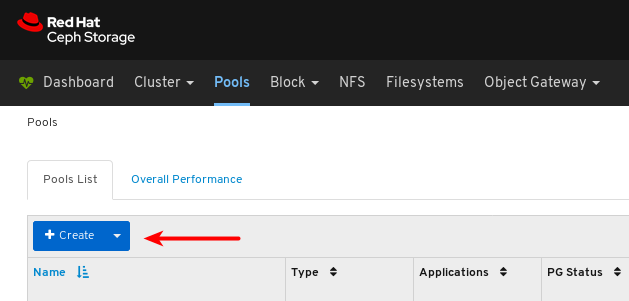
Click the Create button towards the top left corner of the page.
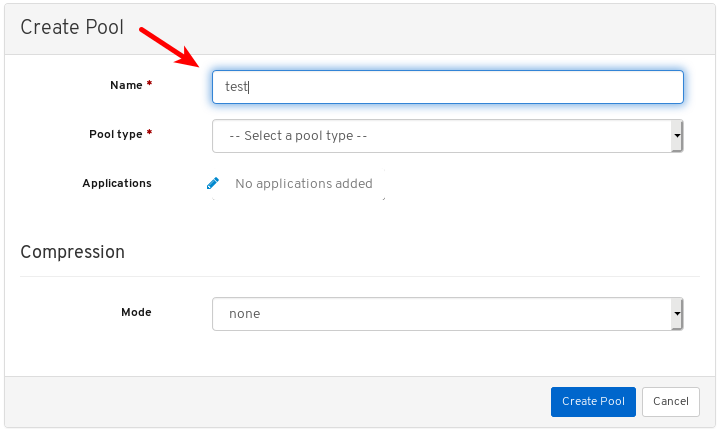
In the dialog window, set the name.
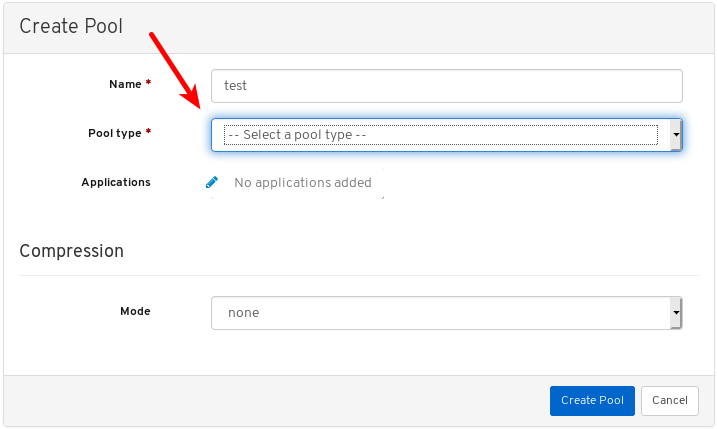
Select either replicated or Erasure Coded (EC) pool type.
Set the Placement Group (PG) number.
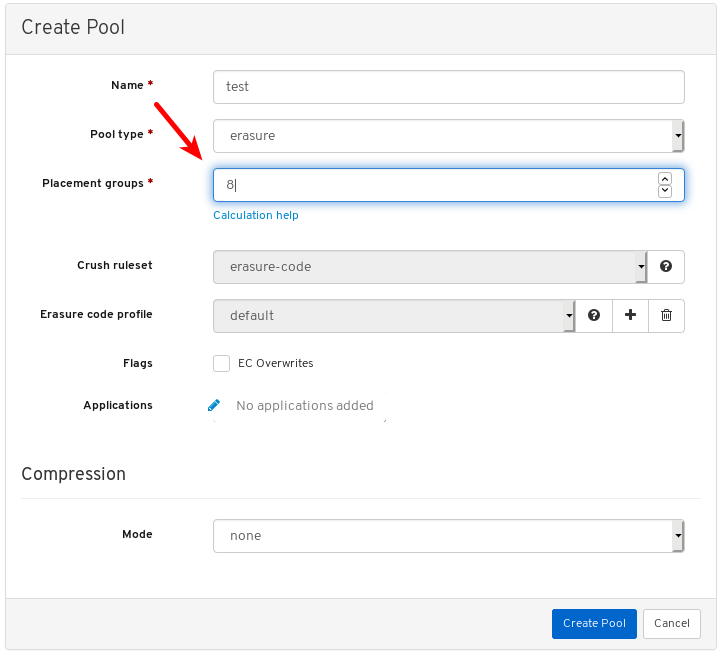
For assistance in choosing the PG number, use the PG calculator. Contact Red Hat Technical Support if unsure.
Optional: If using a replicated pool type, set the replicated size.

Optional: If using an EC pool type configure the following additional settings.
Optional: To see the settings for the currently selected EC profile, click the question mark.

A table of the settings for the selected EC profile is shown.

Optional: Add a new EC profile by clicking the plus symbol.

Set the name of the new EC profile, at 1, click any question mark symbol for info about that setting, at 2, and after modifying all required settings, click Create EC Profile, at 3.

Select the new EC profile.

Optional: If EC overwrites are required, click its button.

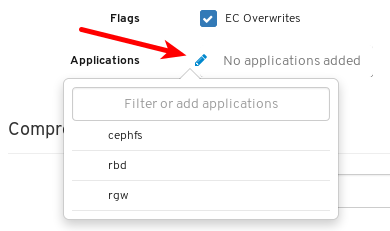
Optional: Click the pencil symbol to select an application for the pool.
Optional: If compression is required, select passive, aggressive, or force.

Click the Create Pool button.

Notifications towards the top right corner of the page indicate the pool was created successfully.

Additional Resources
- For more information, see Ceph pools in the Architecture Guide.
7.10.2. Editing pools
The Red Hat Ceph Storage Dashboard allows editing of pools.
Prerequisites
- A running Red Hat Ceph Storage cluster.
- Dashboard is installed.
- A pool is created.
Procedure
- Log in to the dashboard.
On the navigation bar, click Pools.

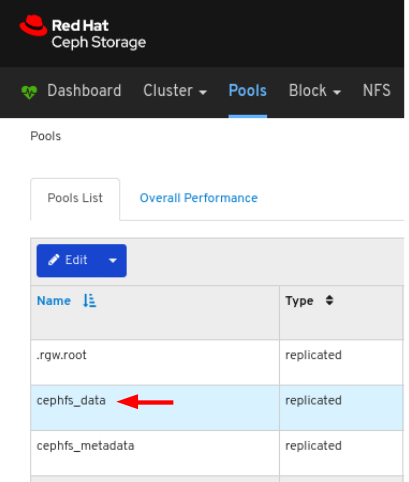
To edit the pool, click its row:
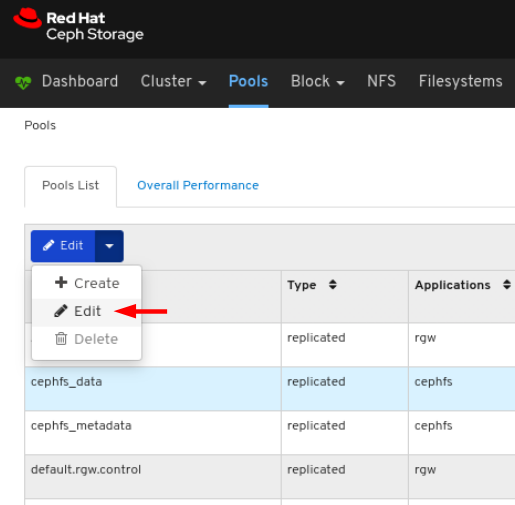
Select Edit In the Edit drop-down:
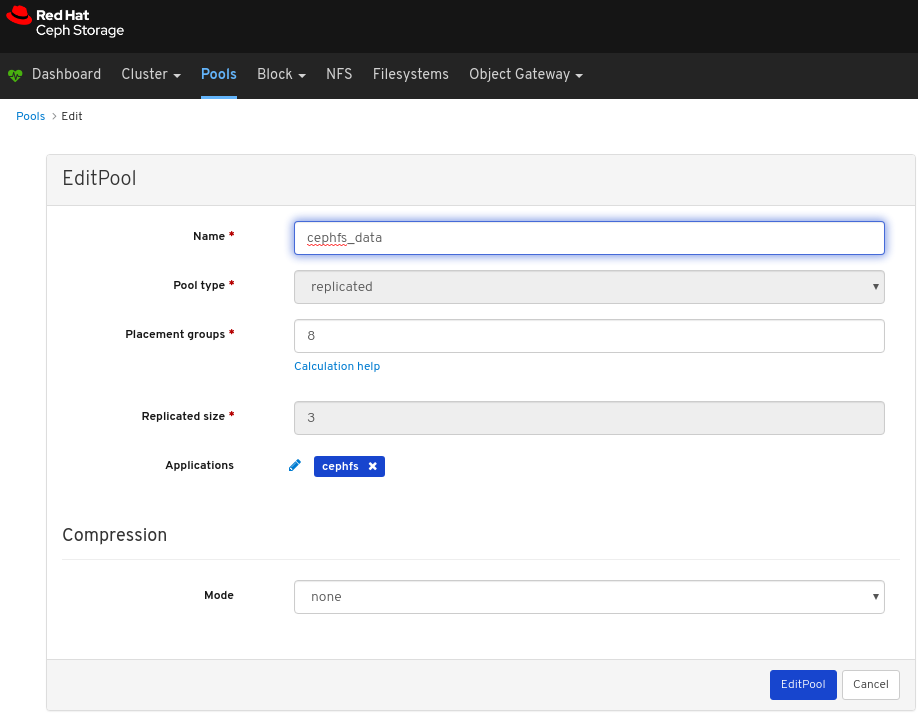
In the dialog window, edit the required parameters and click the EditPool button:
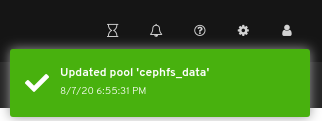
A notifications towards the top right corner of the page indicates the pool was updated successfully.
Additional Resources
- See the Ceph pools in the Red Hat Ceph Storage Architecture Guide for more information.
- See the Pool values in the Red Hat Ceph Storage Storage Strategies Guide for more information on Compression Modes.
7.10.3. Deleting pools
The Red Hat Ceph Storage Dashboard allows deletion of pools.
Prerequisites
- A running Red Hat Ceph Storage cluster.
- Dashboard is installed.
- A pool is created.
Procedure
- Log in to the dashboard.
Ensure the values of
mon_allow_pool_deleteis set totrue:- On the navigation bar, click Cluster and then click Configuration.
In the Level drop-down menu, select Advanced:

Search for
mon_allow_pool_deleteand set the values totrue
On the navigation bar, click Pools:

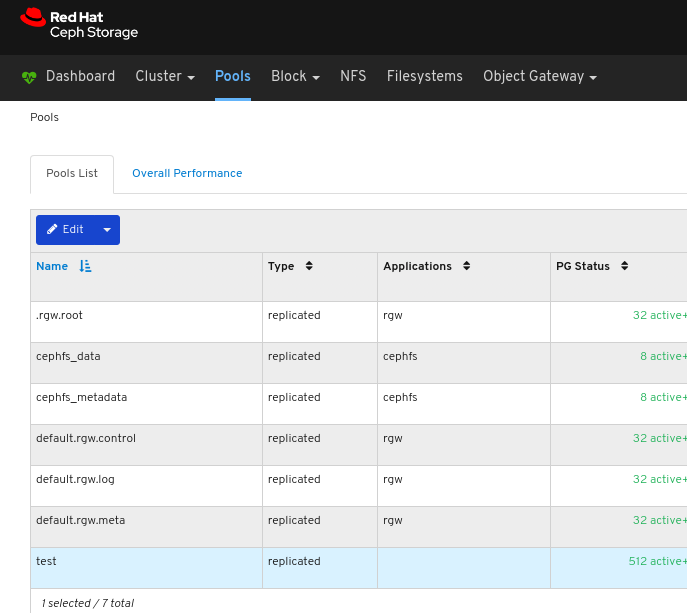
To delete the pool, click on its row:
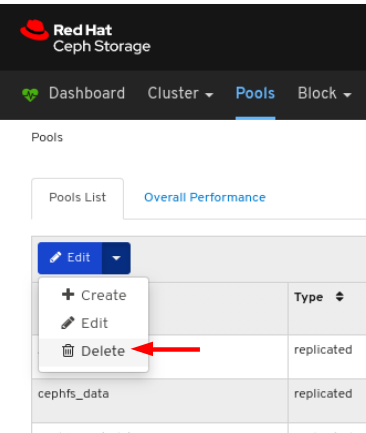
Select Delete in the Edit drop-down:
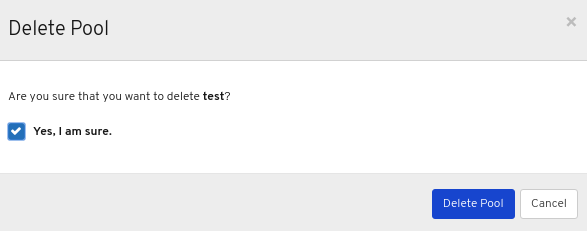
In the Delete Pool dialog window, Click the Yes, I am sure box and then Click Delete Pool to save the settings:
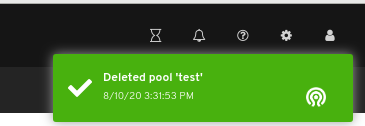
A notification towards the top right corner of the page indicates the pool was deleted successfully.
Additional Resources
- See the Ceph pools in the Red Hat Ceph Storage Architecture Guide for more information.
- See the Monitoring Configuration in the Red Hat Ceph Storage Dashboard Guide for more inforamtion.
- See the Pool values in the Red Hat Ceph Storage Storage Strategies Guide for more information on Compression Modes.