Chapter 6. Monitoring specific functions
As a storage administrator, you can use Red Hat Ceph Storage Dashboard to monitor specific aspects of the cluster based on type of host, services, data access method, and more.
6.1. Monitoring monitors
The Red Hat Ceph Storage Dashboard allows you to view various details about Monitor nodes.
Prerequisites
- A running Red Hat Ceph Storage cluster.
- Dashboard is installed.
Procedure
- Log in to the Dashboard.
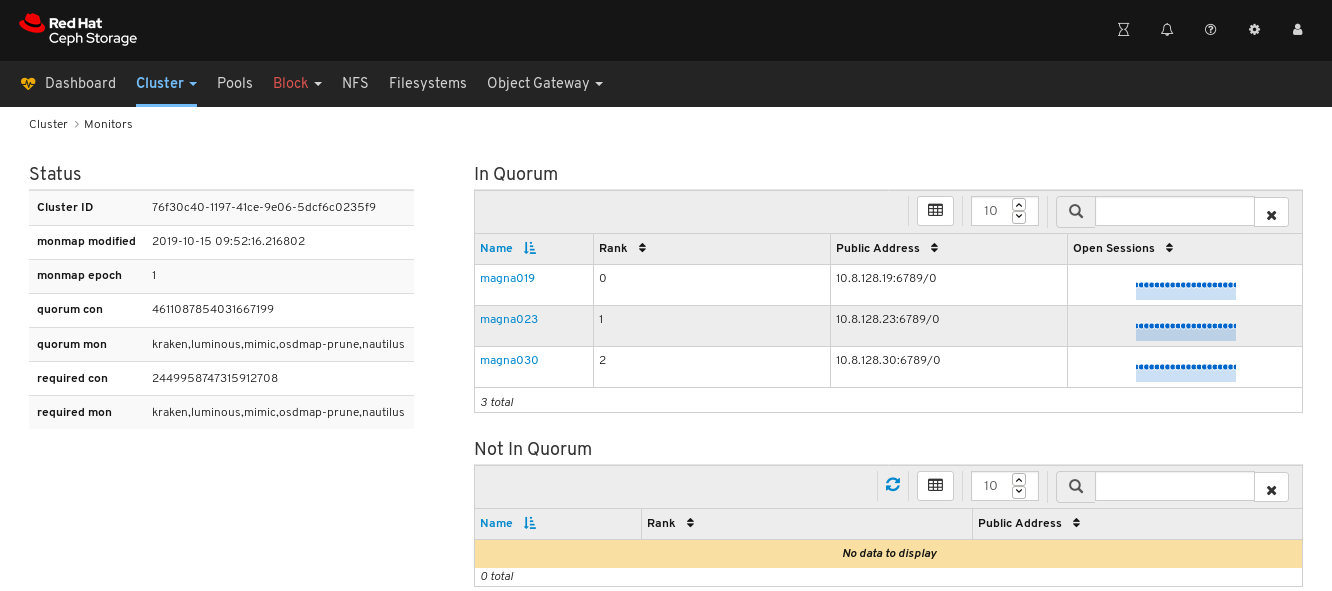
- On the navigation bar, click Cluster and then click Monitors.
The Monitors overview page displays information about the overall monitor status as well as tables of in Quorum and Not in quorum Monitor nodes:
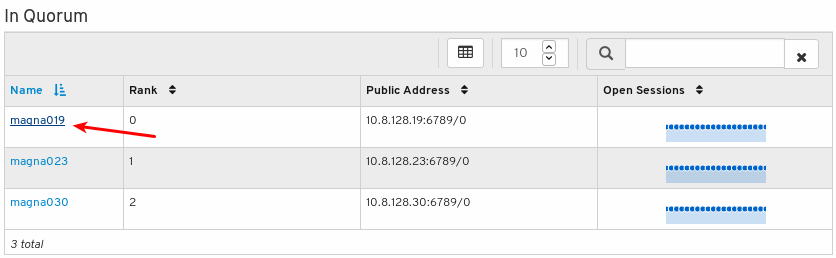
To see the number of open sessions, hover the cursor over the blue dotted trail:

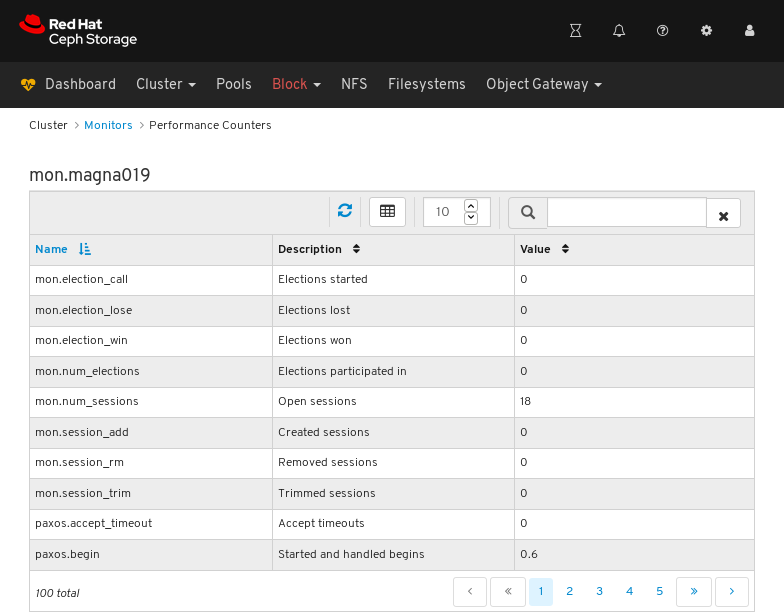
To see performance counters for any monitor, click its host name:
View the performance counters:
Additional Resources
- For more information about Monitors, see Ceph monitors in the Operations guide.
- For more information about performance counters, see Performance counters in the Administration Guide
6.2. Monitoring Hosts
The Red Hat Ceph Storage Dashboard allows you to view various details about hosts.
Prerequisites
- A running Red Hat Ceph Storage cluster.
- Dashboard is installed.
Procedure
- Log in to the Dashboard.
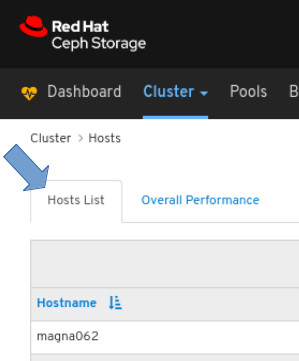
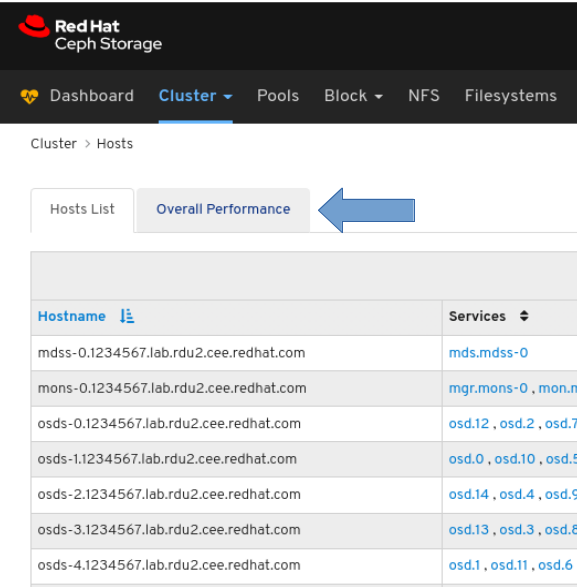
- On the navigation bar, click Cluster and then click Hosts.
To view the list of hosts, click the Hosts List tab:
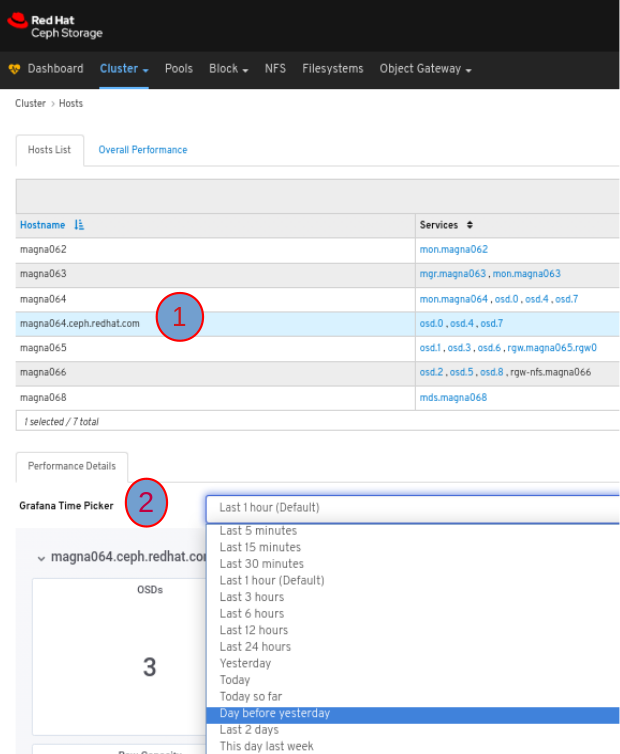
To view the Performance Details of a host, in the Host tab, click its row and select the time range from the Grafana Time Picker drop-down menu:
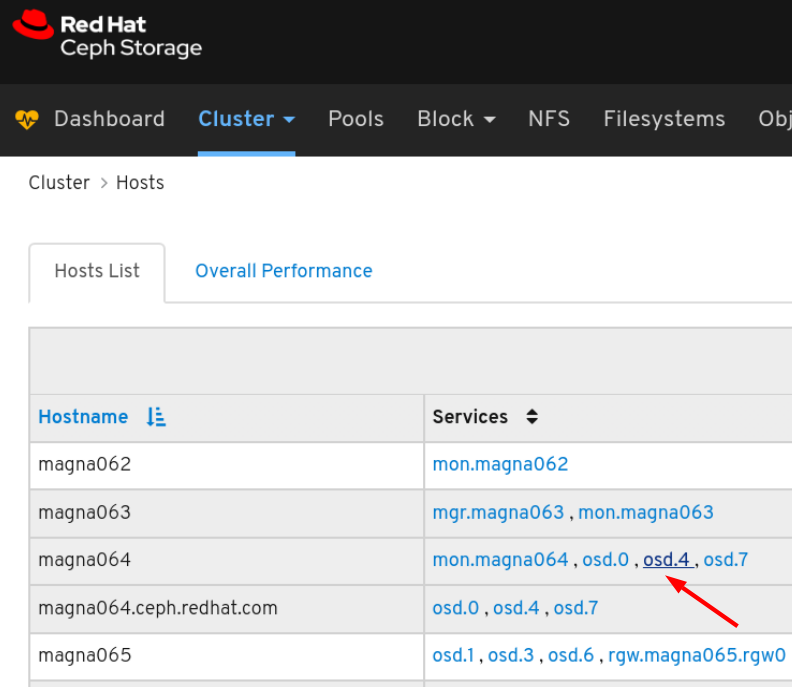
To view the performance counters for a specific service on a host, click the service:
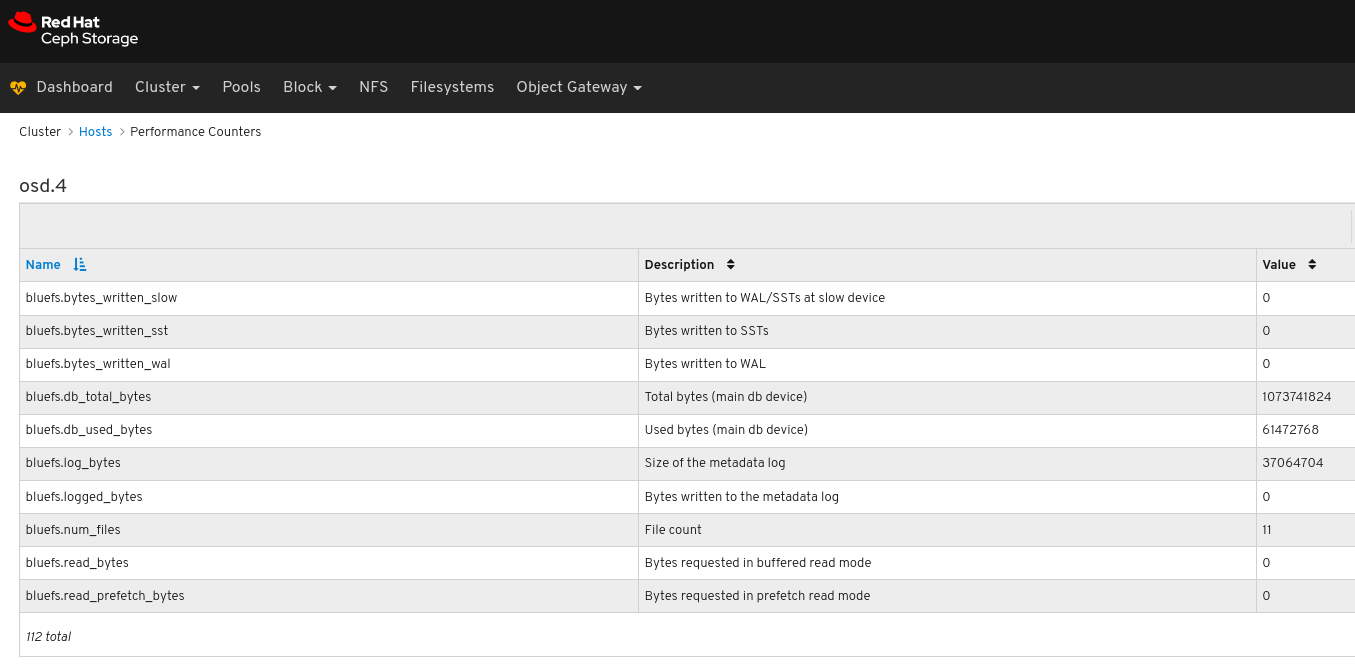
View the performance counters:
To view performance data for all the hosts:
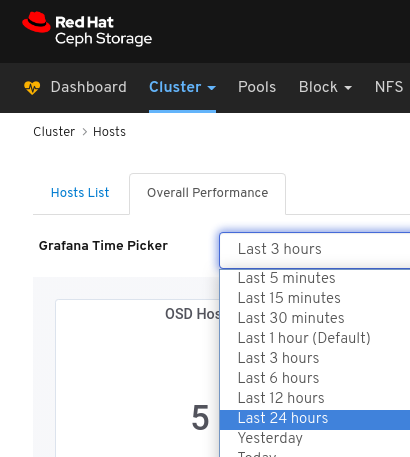
Click the Overall Performance tab towards the top left of the page:
Select the time range from the Grafana Time Picker drop-down:
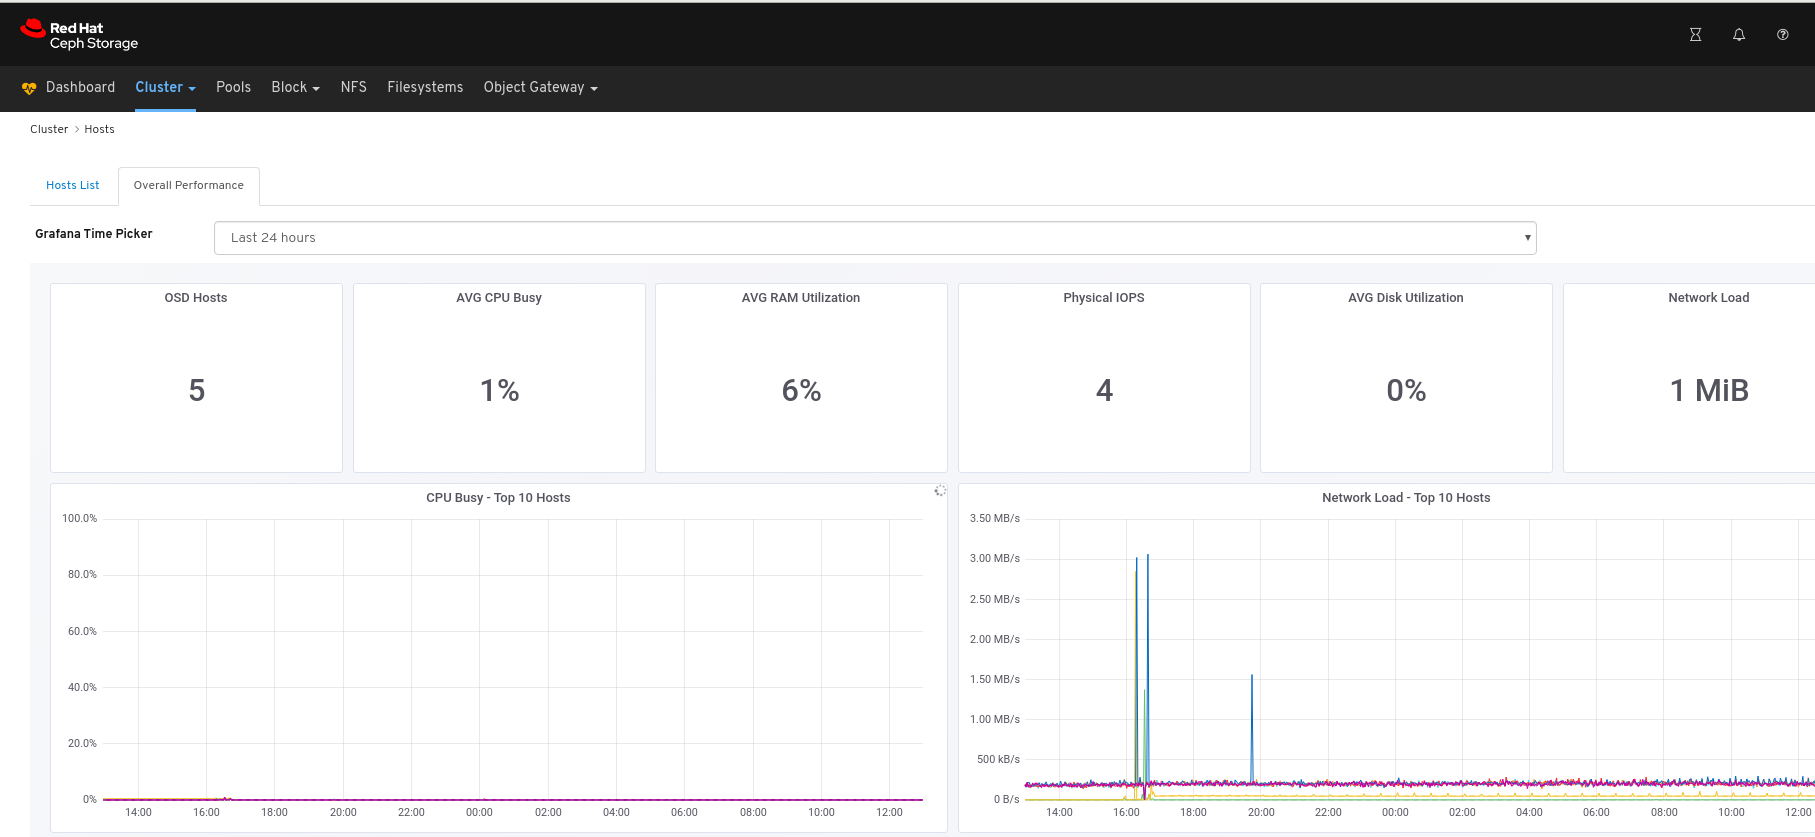
View the Overall Performance page:
Additional Resources
- See the Performance counters in the Red Hat Ceph Storage Administration Guide for more details.
6.3. Monitoring OSDs
The Red Hat Ceph Storage Dashboard allows you to view various details about OSDs.
Prerequisites
- A running Red Hat Ceph Storage cluster.
- Dashboard is installed.
Procedure
- Log in to the Dashboard.
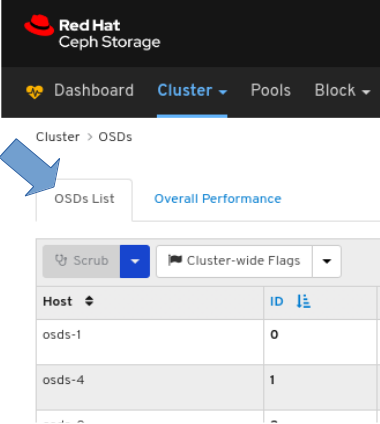
- On the navigation bar, click Cluster and then click OSDs.
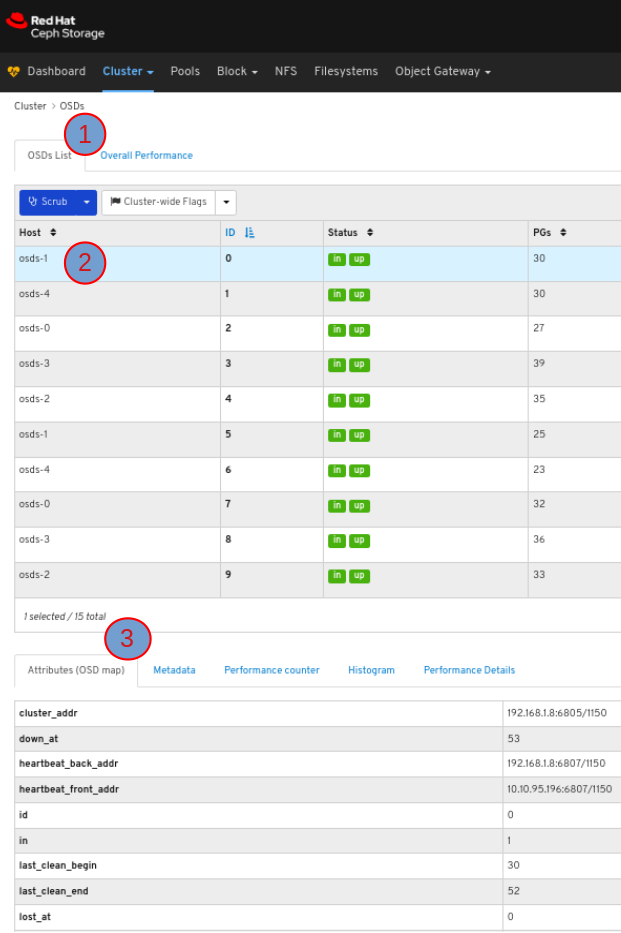
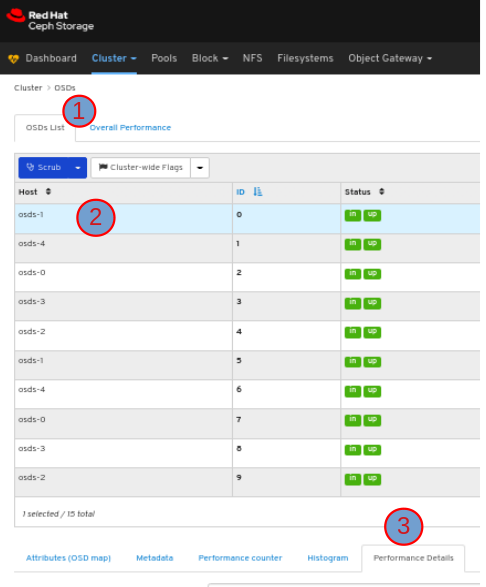
To view the list of OSDs, click the OSDs List tab:
To view the attributes of an OSD, on the OSDS List tab, click its row:
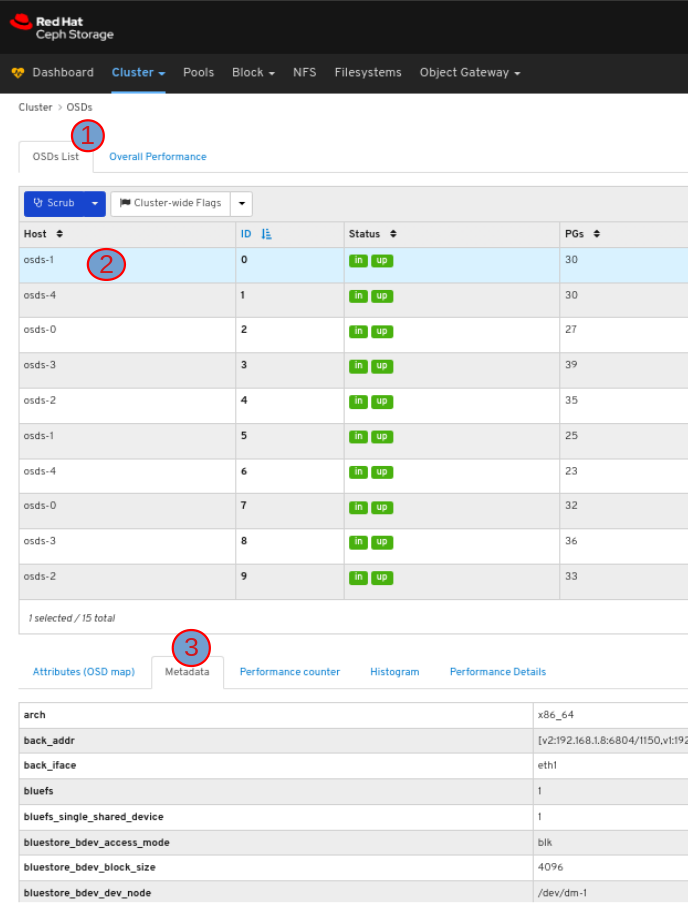
To view the metadata of the OSD, in the OSDs tab, click its row and click the Metadata tab:
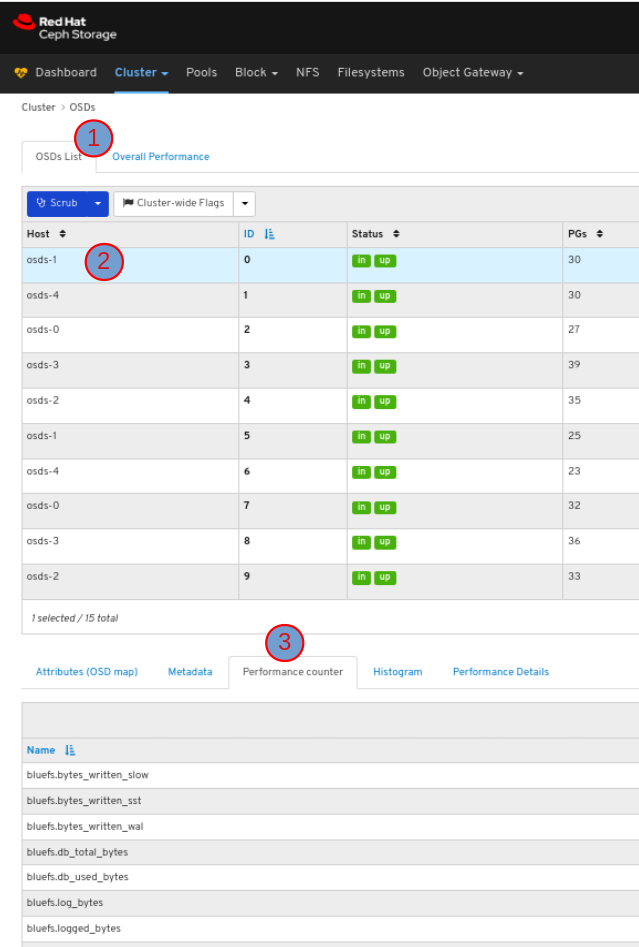
To view the performance counter of the OSD, in the OSDs tab, click its row and click the Performance counter tab:
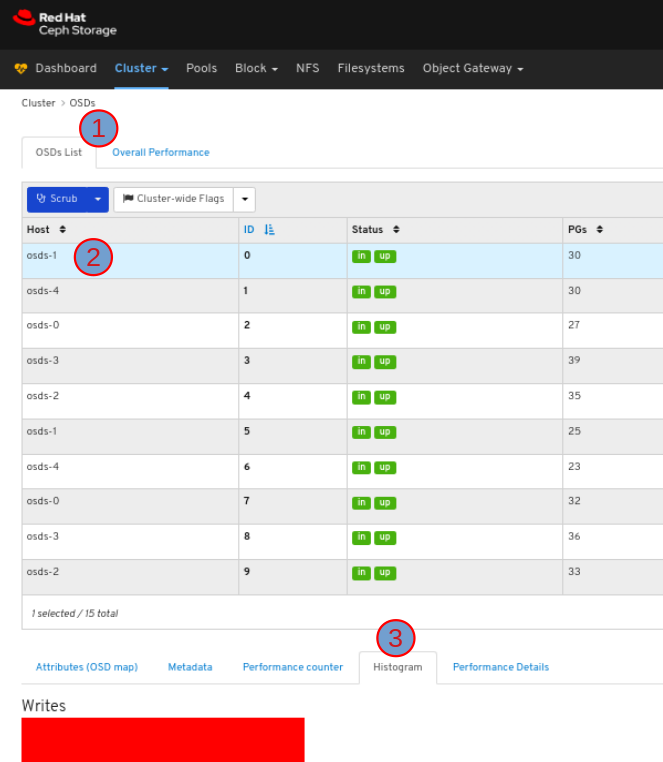
To view the histogram of the OSD, in the OSDs tab, click its row and click the Histogram tab:
To view the performance details of the OSD:
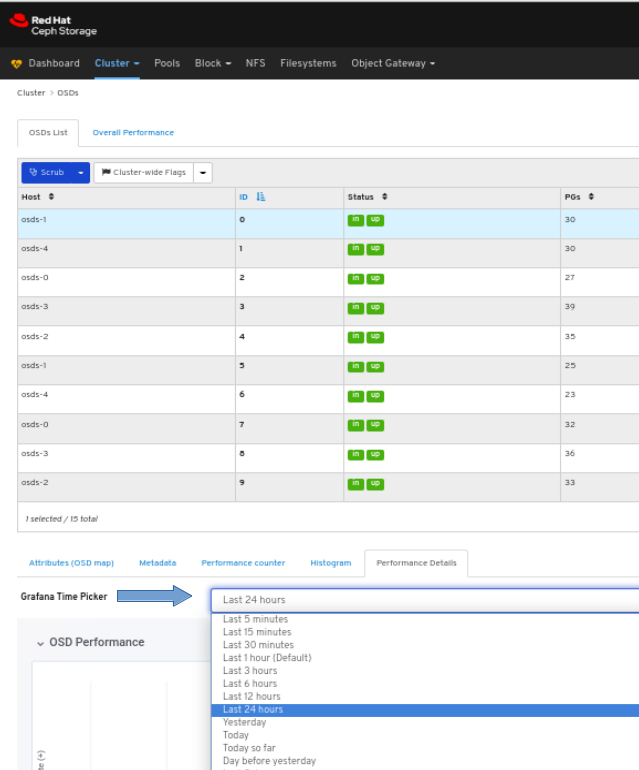
In the OSDs tab, click its row, click the Performance Details tab:
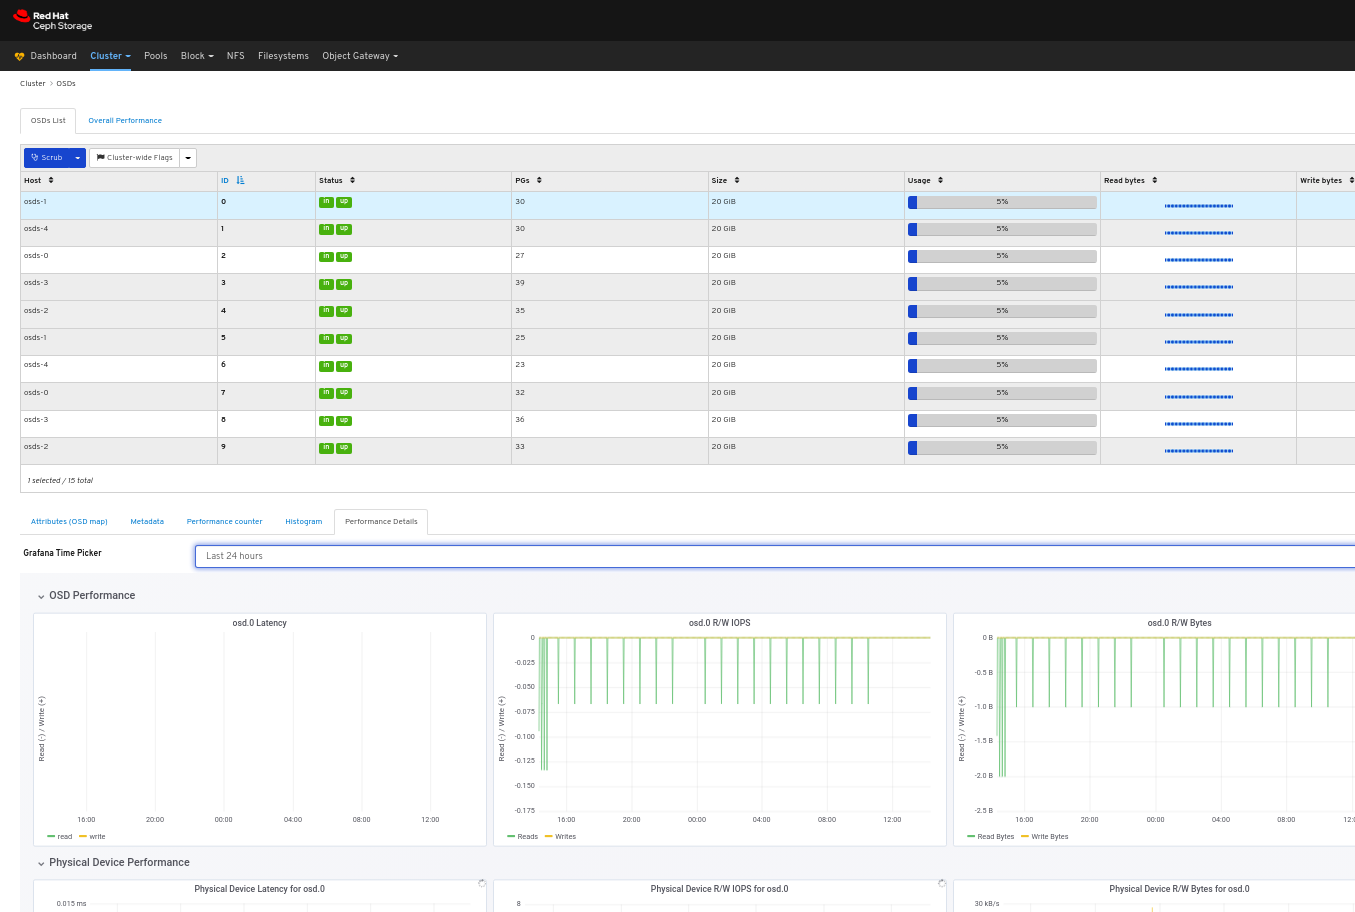
Select the time range from the Grafana Time Picker drop-down menu:
View the performance details of the OSD:
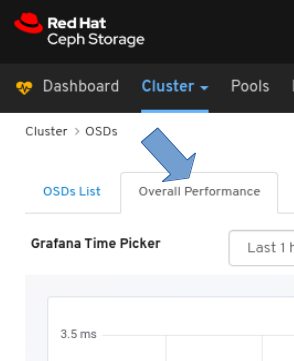
To view the overall performance of all the OSDs:
Click the Overall Performance tab towards the top left of the page:
Select the time range from the Grafana Time Picker drop-down:
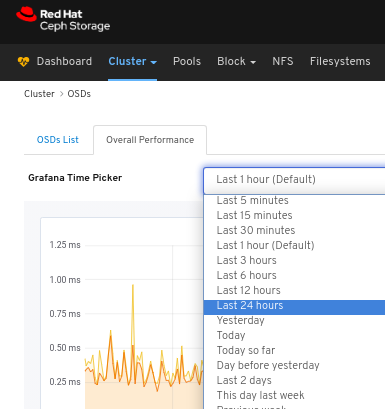
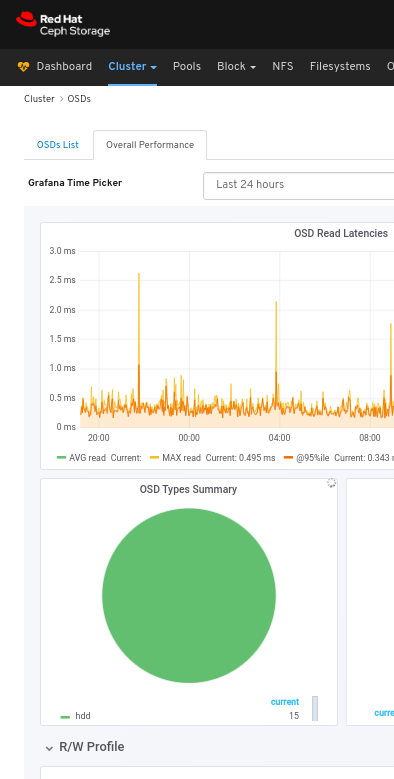
View the Overall Performance page:
Additional Resources
- See the Performance counters in the Red Hat Ceph Storage Administration Guide for more details.
6.4. Monitoring pools
The Red Hat Ceph Storage Dashboard allows you to view various details about pools in the cluster.
Prerequisites
- A running Red Hat Ceph Storage cluster.
- Dashboard is installed.
Procedure
- Log in to the Dashboard.
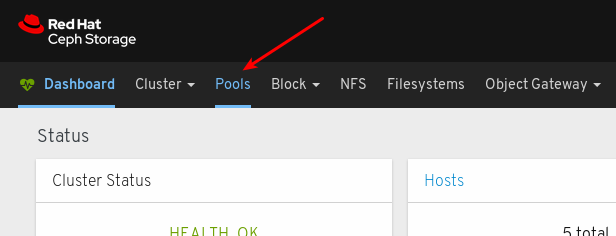
On the navigation bar, click Pools:
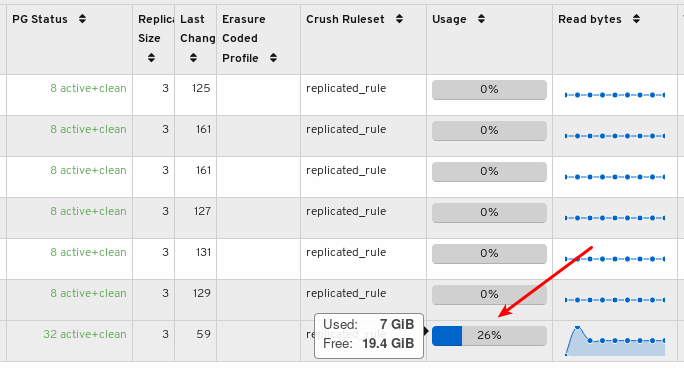
View the pools list:
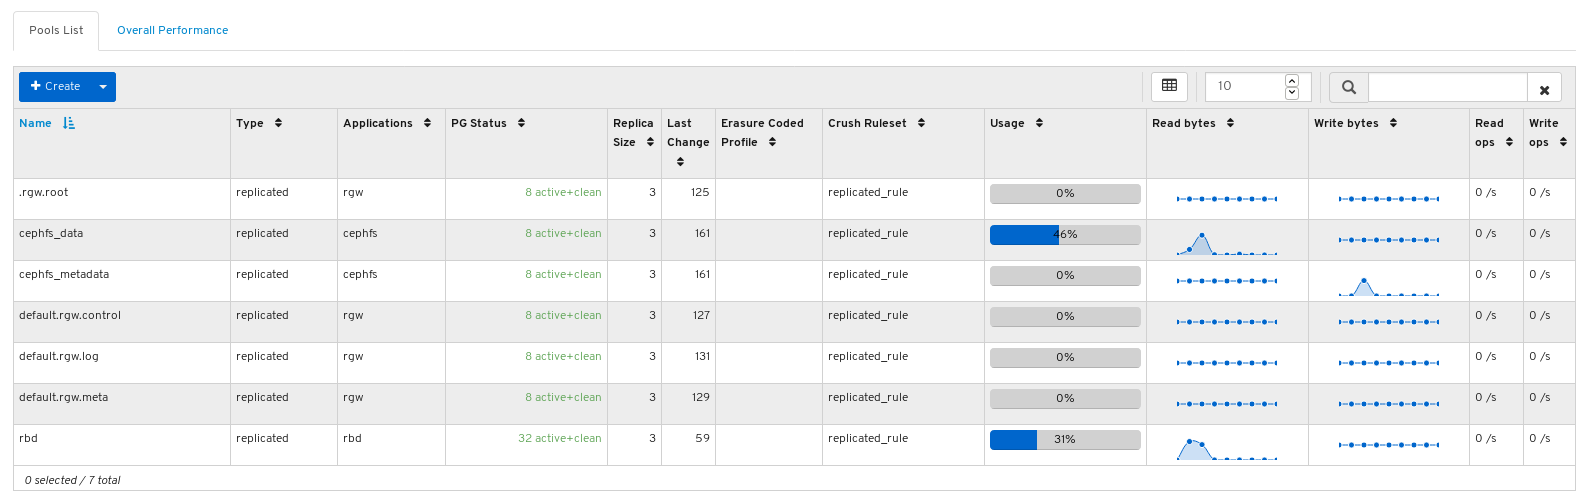
Mouse over a usage bar graph to view the actual used and free space:
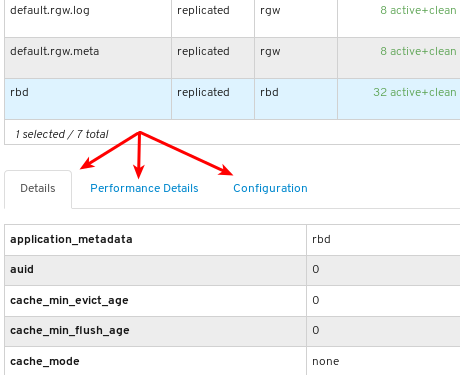
To view more information about a pool, select it by clicking on its row:

View the details of the pool. To view performance details and configuration data for the pool, click on the associated tabs.
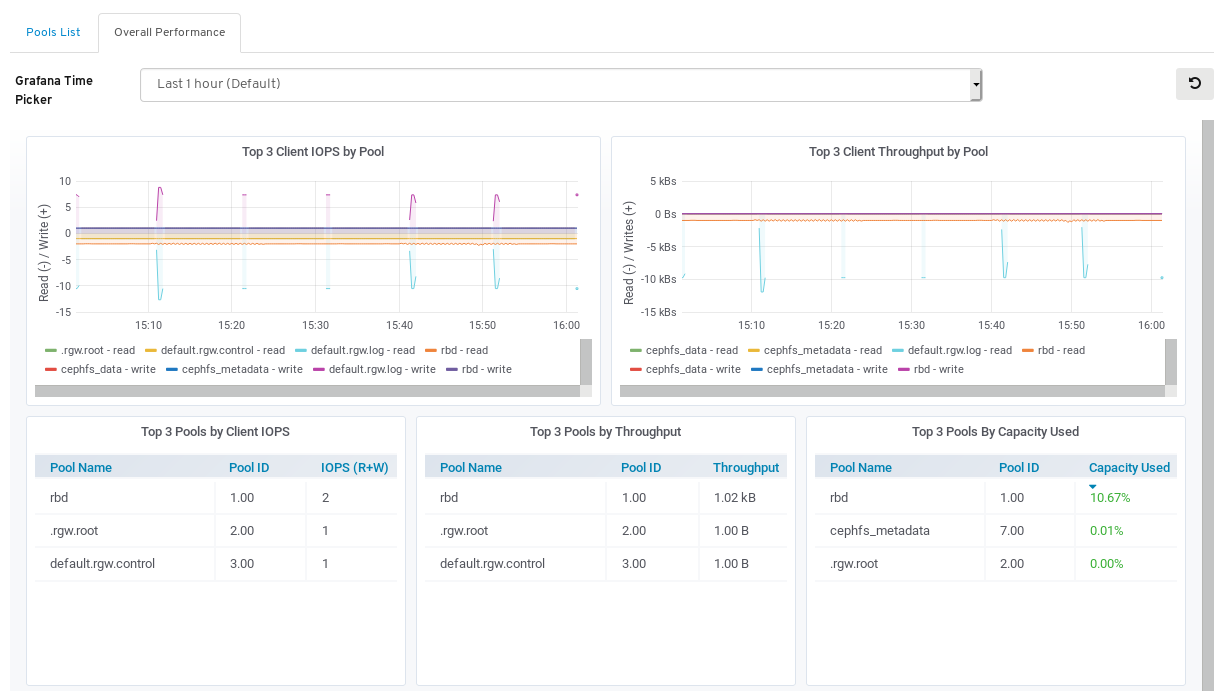
To view performance data for all the pools, click the Overall Performance tab towards the top left of the page:
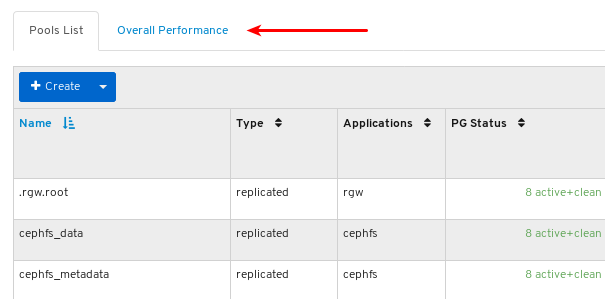
View the Overall Performance page:
Additional Resources
- For more information about pools, see Pools in the Architecture guide.
6.5. Monitoring Ceph File Systems
As a storage administrator, you can use the Red Hat Ceph Storage Dashboard to monitor Ceph File Systems (CephFS) and related components.
Prerequisites
- A running Red Hat Ceph Storage cluster.
- Dashboard is installed
- Ceph File System is installed.
Procedure
- Log in to the dashboard.
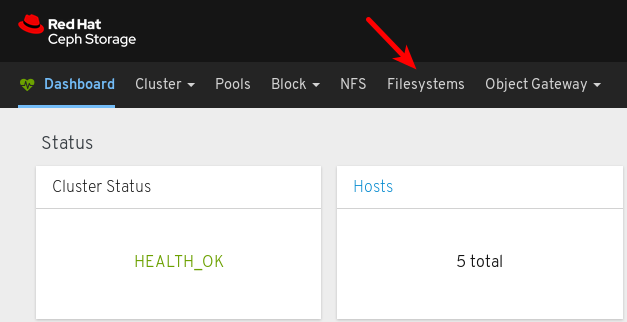
On the navigation bar, click Filesystems.
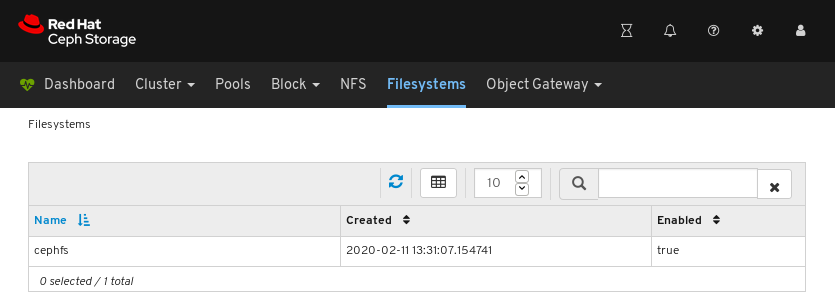
In the example below, you can see the cephfs file system.
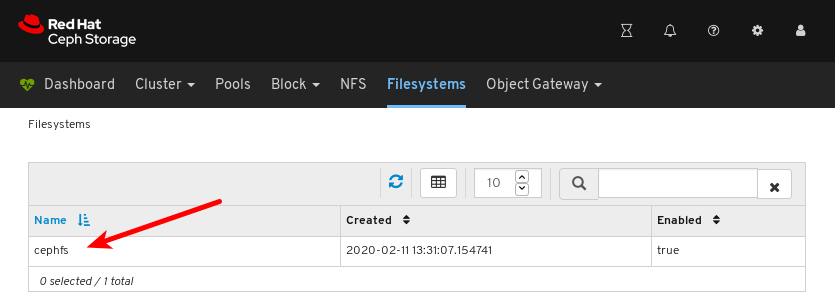
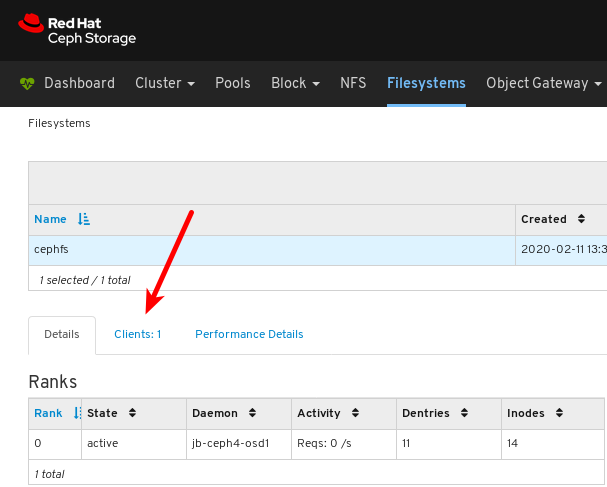
To view details for the file system, click the row for cephfs.
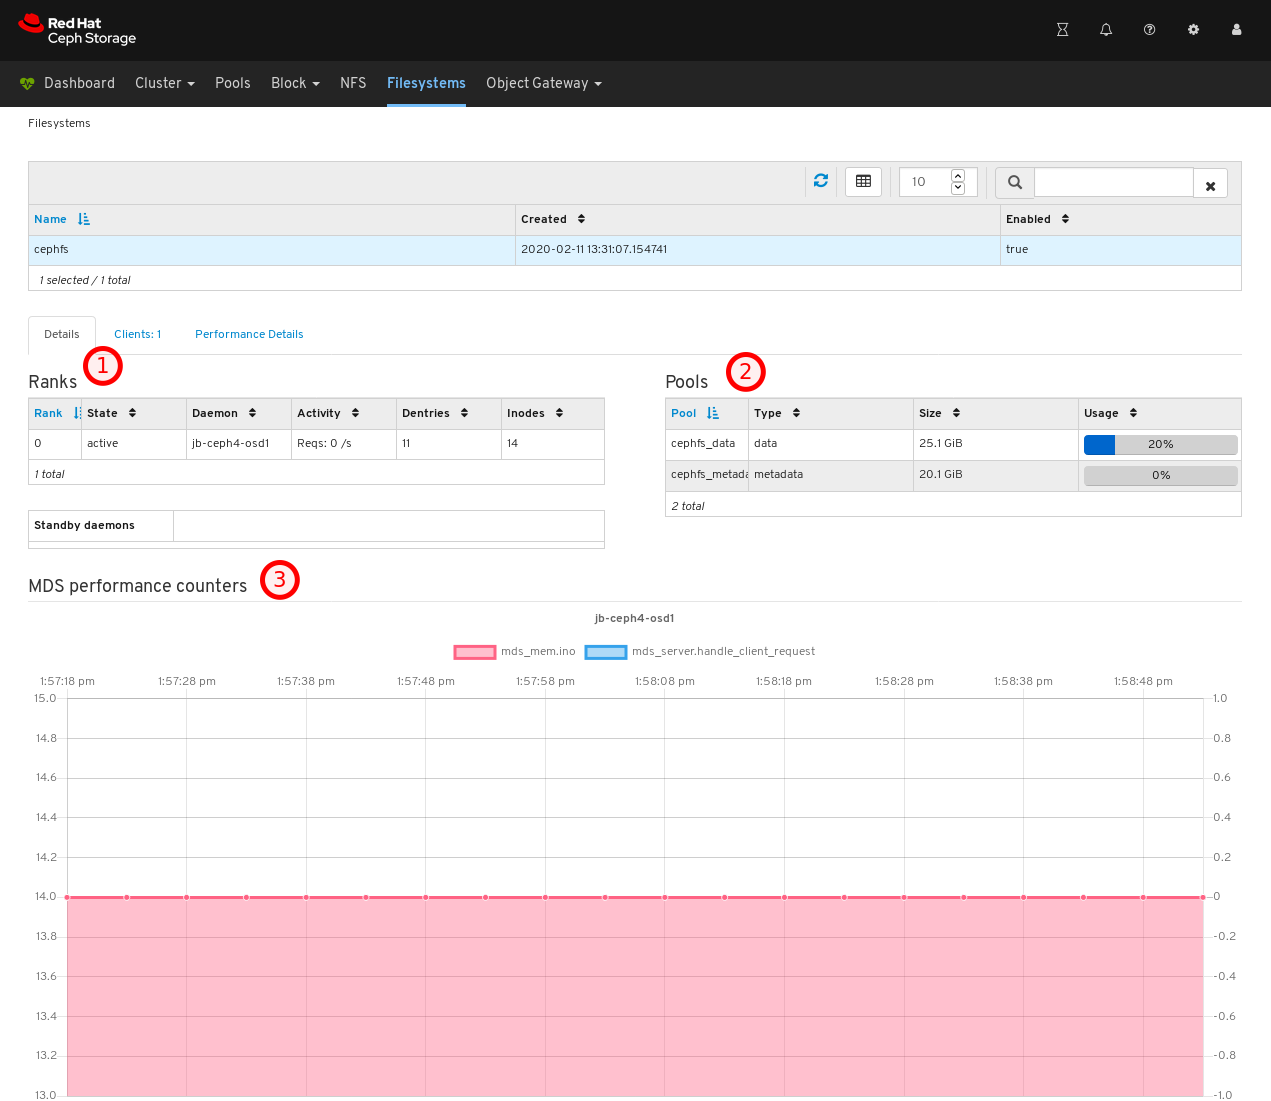
On the Details tab, you can see metadata servers and their rank plus any standby daemons, at 1, pools and their usage, at 2, and performance counters at 3.
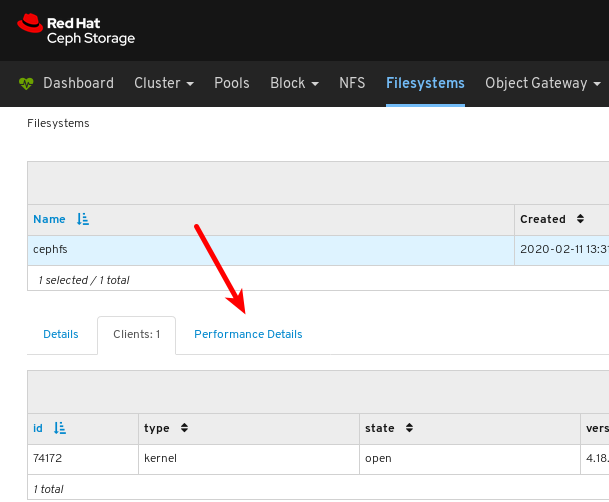
To view the list of clients which have mounted the file system, click the Clients tab.
In the example below, you can see the
jb-ceph4-clienthost has the cephfs file system opened.
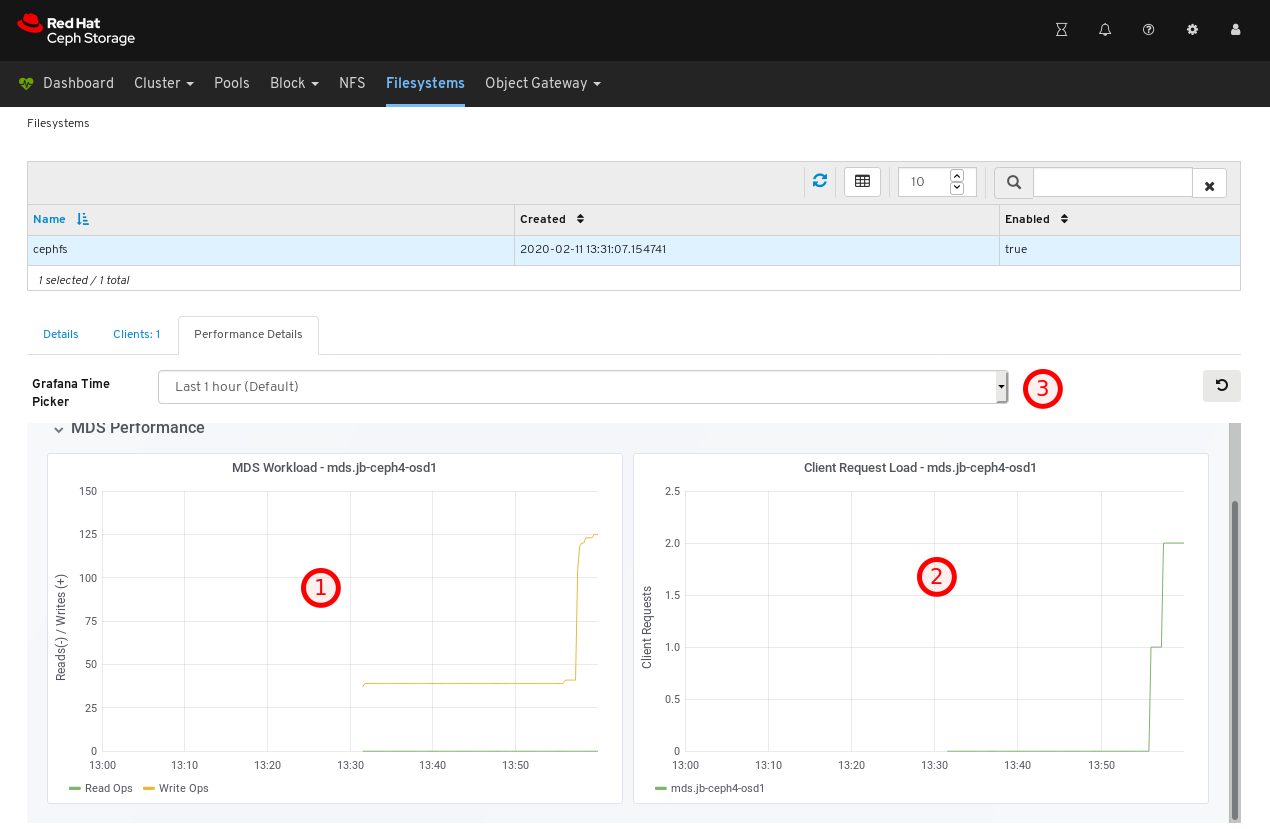
To view the performance of the file system, click the Performance Details tab.
In the example below, you can see the read and write operations, at 1, client requests, at 2, and you can change the time range at 3.
Additional Resources
- For more information, see Installing Metadata servers in the Installation Guide.
- For more information, see the File System Guide.
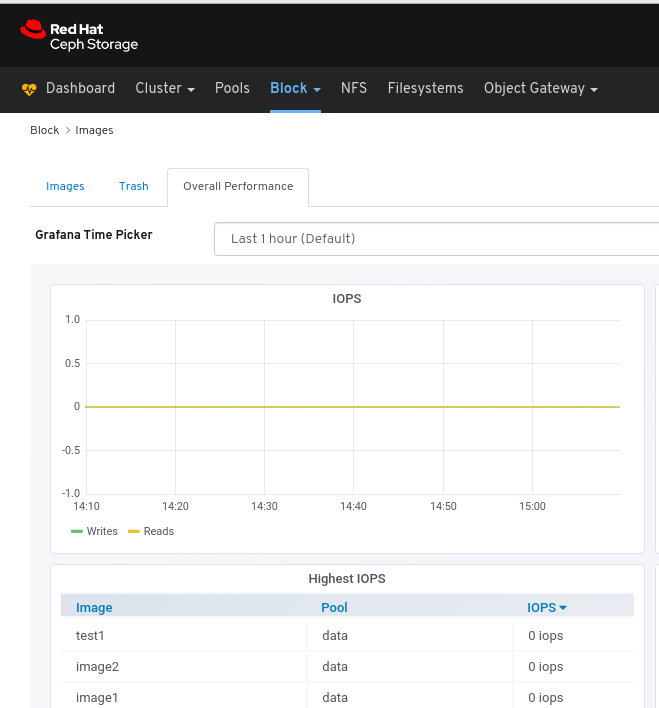
6.6. Monitoring overall performance of images
The Red Hat Ceph Storage Dashboard allows you to monitor the overall performance of the images in Blocks.
Prerequisites
- A running Red Hat Ceph Storage cluster.
- Dashboard is installed.
- Rados Block Device (RBD) pool is created.
- Image is created.
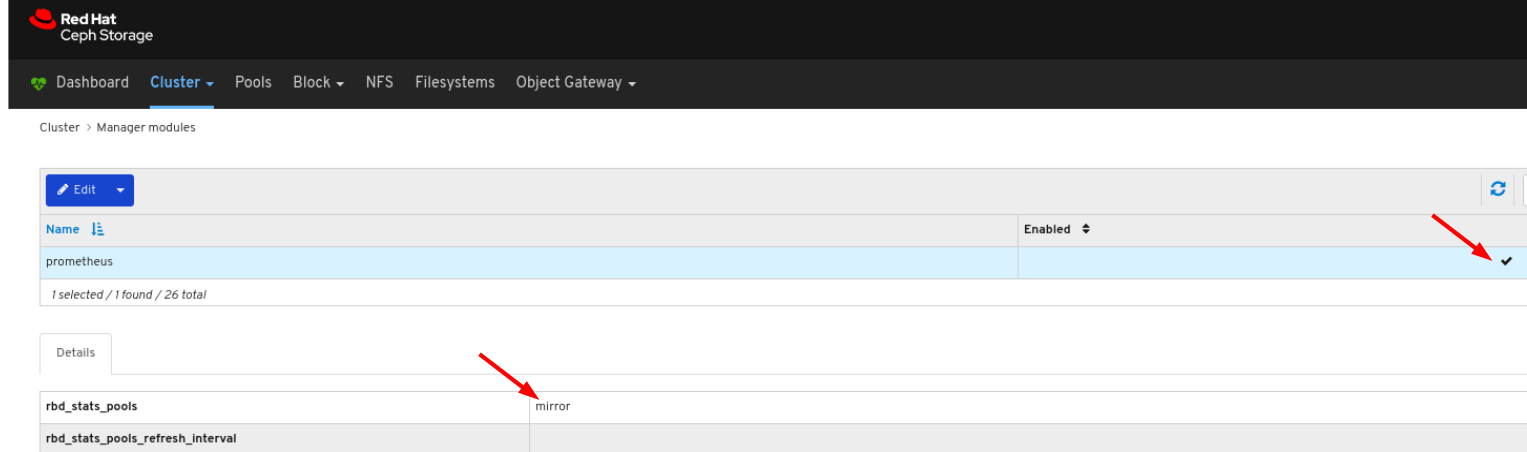
Manager module Prometheus exporter is enabled for the pool.
Figure 6.1. Example
Procedure
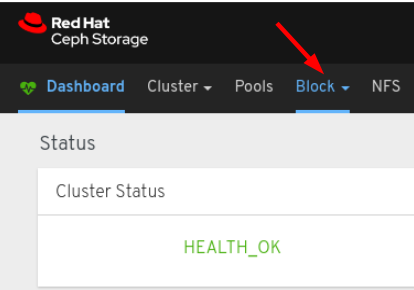
- Log in to the Dashboard.
On the navigation bar, click Block:
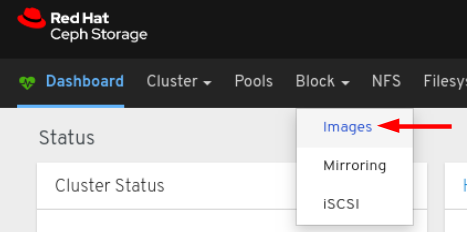
Select Images from the drop-down:
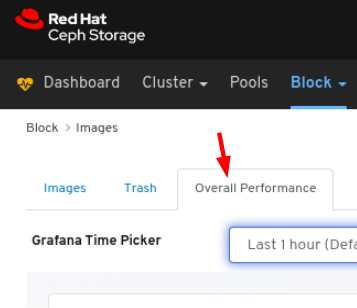
Select the Overall Performance tab:
Select the time range from the Grafana Time Picker drop-down:
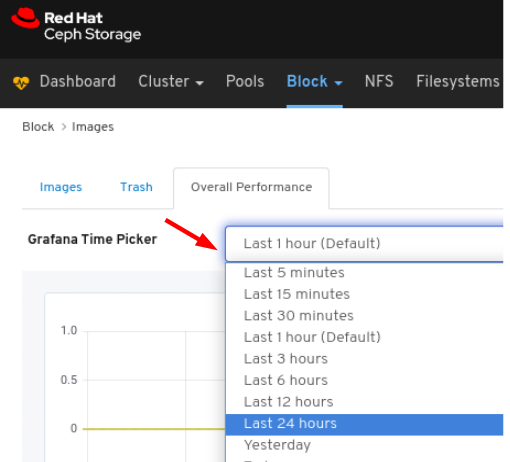
View the Overall Performance page: