このコンテンツは選択した言語では利用できません。
18.2. Viewing a Resource's Availability Charts
- Click the Inventory tab in the top menu.
- Select the resource category, such as servers or services, in the Resources menu table on the left. Then browse or search for the resource.
- Click the name of the resource in the list.
- Open the resource's Monitoring tab.
- Click the Availability subtab.

The Availability chart for a resource shows when, and for how long, a resource changes states. This includes timestamps of whenever the availability changes and total counts of how much time the resource spends in the up and down states.
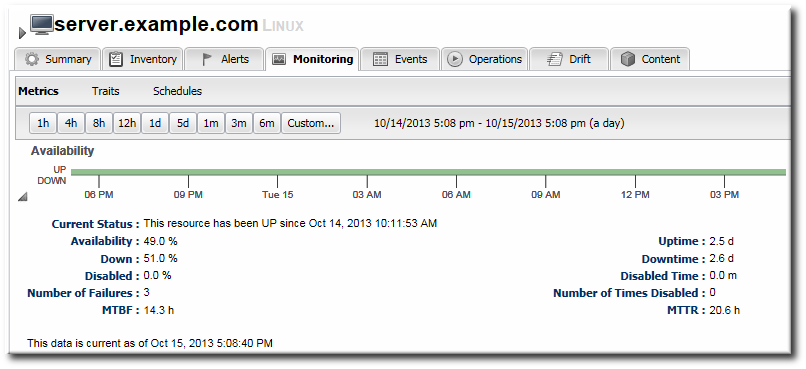
Figure 18.3. Availability Charts