サポート
Red Hat OpenShift Service on AWS のサポート。
概要
第1章 サポートの概要
Red Hat は、クラスターのデータを収集し、モニタリングとトラブルシューティングを行うためのツールをクラスター管理者に提供します。
1.1. サポートの利用
サポートの利用: Red Hat カスタマーポータルにアクセスして、ナレッジベースの記事の確認、サポートケースの作成、追加の製品ドキュメントおよびリソースの確認を行ってください。
1.2. リモートヘルスモニタリングの問題
リモートヘルスモニタリングの問題: Red Hat OpenShift Service on AWS はクラスターの Telemetry および設定データを収集し、Telemeter Client および Insights Operator を使用してこのデータを Red Hat に報告します。Red Hat はこのデータを使用して、接続クラスター の問題を理解し、解決します。Red Hat OpenShift Service on AWS は、以下を使用してデータを収集し、正常性を監視します。
Telemetry: Telemetry クライアントは、Red Hat に対して、4 分 30 秒ごとにメトリクス値を収集して、アップロードします。Red Hat はこのデータを使用して以下を行います。
- クラスターの監視。
- Red Hat OpenShift Service on AWS のアップグレードのロールアウト。
- アップグレードエクスペリエンスの向上。
Insights Operator: デフォルトでは、Red Hat OpenShift Service on AWS は、設定とコンポーネントの障害ステータスが 2 時間ごとに報告する Insights Operator をインストールして有効にします。Insights Operator は次のことに役立ちます。
- 発生する可能性のあるクラスターの問題を事前に特定する。
- Red Hat OpenShift Cluster Manager でソリューションと予防措置を提供する。
Telemetry 情報を確認 できます。
1.3. クラスターに関するデータの収集
クラスターに関するデータの収集: Red Hat は、サポートケースの作成時にデバッグ情報を収集することを推奨します。デバッグ情報があると、Red Hat サポートが根本原因を分析するのに役立ちます。クラスター管理者は、以下を使用してクラスターに関するデータを収集できます。
-
must-gather ツール:
must-gatherツールを使用して、クラスターに関する情報を収集し、問題をデバッグします。 -
sosreport:
sosreportツールを使用して、デバッグ目的で設定の詳細、システム情報、および診断データを収集します。 - クラスター ID: Red Hat サポートに情報を提供するときに、クラスターの一意の識別子を取得します。
-
クラスターノードのジャーナルログ: ノード関連の問題をトラブルシューティングするために、個々のクラスターノード上の
journaldユニットログと/var/log内のログを収集します。 - ネットワークトレース: ネットワーク関連の問題のトラブルシューティングに役立つように、特定の Red Hat OpenShift Service on AWS クラスターノードまたはコンテナーからのネットワークパケットトレースを Red Hat サポートに提供します。
1.4. 問題のトラブルシューティング
クラスター管理者は、次の Red Hat OpenShift Service on AWS コンポーネントの問題を監視し、トラブルシューティングできます。
ノードの問題: クラスター管理者は、ノードのステータス、リソースの使用状況、および設定を確認して、ノード関連の問題を検証およびトラブルシューティングできます。以下に対してクエリーを実行できます。
- ノード上の kubelet のステータス。
- クラスターノードジャーナルログ。
Operator の問題: クラスター管理者は以下を実行して、Operator の問題を解決できます。
- Operator サブスクリプションのステータスを確認する。
- Operator Pod の正常性を確認する。
- Operator ログを収集する。
Pod の問題: クラスター管理者は、Pod のステータスを確認して以下を実行し、Pod 関連の問題のトラブルシューティングを行うことができます。
- Pod およびコンテナーのログを確認する。
- root アクセスでデバッグ Pod を起動する。
Source-to-Image の問題: クラスター管理者は S2I ステージを確認し、S2I プロセスのどこで障害が発生したかを判断できます。Source-to-Image(S2I) の問題を解決するには、以下を収集します。
- Source-to-Image 診断データ。
- アプリケーションの障害を調査するためのアプリケーション診断データ。
ストレージの問題: 障害のあるノードがアタッチしたボリュームをアンマウントできないことが原因で、新しいノードにボリュームをマウントできない場合、マルチアタッチストレージエラーが発生します。クラスター管理者は、以下を実行して、複数アタッチされているストレージの問題を解決できます。
- RWX ボリュームを使用して、複数割り当てを有効にします。
- RWO ボリュームの使用時に障害が発生したノードを回復するか、削除します。
モニタリングの問題: クラスター管理者は、モニタリングに関するトラブルシューティングページの手順を実行してください。ユーザー定義プロジェクトのメトリクスが利用できない場合や、Prometheus が大量のディスク領域を消費している場合は、以下を確認します。
- ユーザー定義のメトリクスが利用できない理由を調べる。
- Prometheus が大量のディスク領域を消費している理由を特定する。
-
OpenShift CLI (
oc) の問題: ログレベルを増やすことで OpenShift CLI (oc) の問題を調査します。
第2章 クラスターリソースの管理
Red Hat OpenShift Service on AWS でグローバル設定オプションを適用できます。Operator はこれらの設定をクラスター全体に適用します。
2.1. クラスターリソースの操作
Red Hat OpenShift Service on AWS の OpenShift CLI (oc) ツールを使用して、クラスターリソースを操作できます。oc api-resources コマンドの実行後に表示されるクラスターリソースを編集できます。
前提条件
-
dedicated-adminロールを持つユーザーとしてクラスターにアクセスできる。 -
Web コンソールにアクセスできるか、
ocCLI ツールがインストールされている。
手順
適用された設定 Operator を確認するには、以下のコマンドを実行します。
$ oc api-resources -o name | grep config.openshift.io設定可能なクラスターリソースを表示するには、以下のコマンドを実行します。
$ oc explain <resource_name>.config.openshift.ioクラスターのカスタムリソース定義 (CRD) オブジェクトの設定を表示するには、以下のコマンドを実行します。
$ oc get <resource_name>.config -o yamlクラスターリソース設定を編集するには、以下のコマンドを実行します。
$ oc edit <resource_name>.config -o yaml
第3章 Approved Access
Red Hat Site Reliability Engineering (SRE) は通常、Red Hat OpenShift Service on AWS クラスターの管理およびサポートにおける通常の操作の一環として、システムへの昇格権限を必要としません。昇格されたアクセスにより、SRE に cluster-admin ロールのアクセスレベルが付与されます。詳細は、クラスターのロール を参照してください。
万が一、SRE がシステムへのアクセス権の昇格を必要とする場合、お客様は Approved Access インターフェイスを使用して、対象システムへのアクセス権を確認し、承認 または 拒否 できます。
標準のインシデント対応プロセスの一環として、お客様が開始したサポートチケットへの回答時、または Red Hat SRE が受信したアラートへの対応時に、Red Hat OpenShift Service on AWS クラスターおよび対応するクラウドアカウントに対するアクセス権の昇格依頼が、Red Hat SRE によって作成される場合があります。
Approved Access が有効になっていて、SRE がアクセス権の依頼を作成すると、クラスター所有者 に、新規アクセス依頼を通知するメールが送信されます。メール通知には、リンクが含まれており、クラスターの所有者はすぐにアクセス依頼を承認または拒否できます。すぐに対応してください。対応されない場合は、Red Hat OpenShift Service on AWS の SLA 違反のリスクが生じます。
- クラスター所有者以外の別のユーザーがメールを受信する必要がある場合は、クラスター担当者の連絡先を追加 できます。
- 保留中のアクセス依頼は、Hybrid Cloud Console のクラスターリスト、または特定のクラスターのクラスター概要の Access Requests タブで確認できます。
アクセスリクエストを拒否するには、Justification フィールドに入力する必要があります。この場合、SRE はインシデントに関連するリソースに対して直接対応できません。お客様は引き続き カスタマーサポート を利用して、問題の調査と解決を行うことができます。
3.1. サポートケースを送信して ROSA クラスターの Approved Access を有効にする
Red Hat OpenShift Service on AWS の Approved Access は、デフォルトでは有効になっていません。Red Hat OpenShift Service on AWS クラスターの Approved Access を有効にするには、サポートチケットを作成する必要があります。
手順
- Red Hat カスタマーポータルの Customer Support ページにログインします。
- Get support をクリックします。
Customer Support ページの Cases タブで、以下を行います。
- オプション: 必要に応じて、事前に入力されたアカウントと所有者の詳細を変更します。
- Configuration カテゴリーを選択し、Continue をクリックします。
以下の情報を入力します。
- Product フィールドで、Red Hat OpenShift Service on AWS Hosted control planes を選択します。
- Problem statement フィールドに Enable ROSA Access Protection を入力します。
- See more options をクリックします。
- ドロップダウンリストから OpenShift Cluster ID を選択します。
フォームの残りの必須フィールドに入力します。
What are you experiencing? What are you expecting to happen?
- Approved Access に入力します。
Define the value or impact to you or the business.
- Approved Access に入力します。
- Continue をクリックします。
- Severity を 4(Low) に選択し、Continue をクリックします。
- ケースの詳細をプレビューし、Submit をクリックします。
3.2. メール通知からのアクセス依頼の確認
Red Hat Site Reliability Engineering (SRE) がクラスターへのアクセスを依頼すると、クラスター所有者に、Hybrid Cloud Console でその依頼を確認するためのリンクを含むメール通知が送信されます。
手順
- メール内のリンクをクリックして、Hybrid Cloud Console に追加します。
Access Request Details ダイアログで、Decision の下にある Approve または Deny をクリックします。
注記アクセスリクエストを拒否するには、Justification フィールドに入力する必要があります。この場合、SRE はインシデントに関連するリソースに対して直接対応できません。お客様は引き続き カスタマーサポート を利用して、問題の調査と解決を行うことができます。
- Save をクリックします。
3.3. Hybrid Cloud Console からのアクセス依頼の確認
Hybrid Cloud Console から Red Hat OpenShift Service on AWS クラスターのアクセス依頼を確認します。
手順
- OpenShift Cluster Manager に移動し、Cluster List を選択します。
- クラスター名をクリックして、Access Request を確認します。
- Access Requests タブを選択して、すべての states を一覧表示します。
- Pending 状態の Actions で Open を選択します。
Access Request Details ダイアログで、Decision の下にある Approve または Deny をクリックします。
注記アクセスリクエストを拒否するには、Justification フィールドに入力する必要があります。この場合、SRE はインシデントに関連するリソースに対して直接対応できません。お客様は引き続き カスタマーサポート を利用して、問題の調査と解決を行うことができます。
- Save をクリックします。
第4章 サポート
4.1. サポート
このドキュメントで説明されている手順、または Red Hat OpenShift Service on AWS 全般で問題が発生した場合は、Red Hat カスタマーポータル にアクセスしてください。
カスタマーポータルでは、以下を行うことができます。
- Red Hat 製品に関するアーティクルおよびソリューションを対象とした Red Hat ナレッジベースの検索またはブラウズ。
- Red Hat サポートに対するサポートケースの送信。
- その他の製品ドキュメントへのアクセス。
クラスターの問題を特定するには、OpenShift Cluster Manager の Red Hat Lightspeed を使用できます。Red Hat Lightspeed は、問題に関する詳細情報を提供し、可能な場合は問題の解決方法に関する情報も提供します。
このドキュメントを改善するための提案がある場合、またはエラーを見つけた場合は、最も関連性の高いドキュメントコンポーネントについて Jira 課題 を送信してください。セクション名や Red Hat OpenShift Service on AWS のバージョンなど、具体的な情報を指定してください。
4.2. Red Hat ナレッジベースについて
Red Hat ナレッジベース は、お客様が Red Hat の製品やテクノロジーを最大限に活用できるようにするための豊富なコンテンツを提供します。Red Hat ナレッジベースは、Red Hat 製品のインストール、設定、および使用に関する記事、製品ドキュメント、および動画で構成されています。さらに、既知の問題に対する解決策を検索でき、それぞれに根本原因の簡潔な説明と修復手順が記載されています。
4.3. Red Hat ナレッジベースの検索
Red Hat OpenShift Service on AWS の問題が発生した場合には、初期検索を実行して、Red Hat ナレッジベースにソリューションがすでに存在しているかどうかを確認できます。
前提条件
- Red Hat カスタマーポータルのアカウントがある。
手順
- Red Hat カスタマーポータル にログインします。
- Search をクリックします。
検索フィールドに、問題に関連する次のようなキーワードと文字列を入力します。
- Red Hat OpenShift Service on AWS コンポーネント (etcd など)
- 関連する手順 (installation など)
- 明示的な失敗に関連する警告、エラーメッセージ、およびその他の出力
- Enter キーをクリックします。
- オプション: Red Hat OpenShift Service on AWS 製品フィルターを選択します。
- オプション: Documentation コンテンツタイプフィルターを選択します。
4.4. サポートケースの作成
前提条件
-
dedicated-adminロールを持つユーザーとしてクラスターにアクセスできる。 -
OpenShift CLI (
oc) がインストールされている。 - Red Hat OpenShift Cluster Manager にアクセスできる。
手順
- Red Hat カスタマーポータルの Customer Support ページ にログインします。
- Get support をクリックします。
Customer Support ページの Cases タブで、以下を行います。
- オプション: 必要に応じて、事前に入力されたアカウントと所有者の詳細を変更します。
- 問題に該当するカテゴリー (Bug、Defect など) を選択し、Continue をクリックします。
以下の情報を入力します。
- Summary フィールドには、問題の簡潔で説明的な概要と、確認されている現象および予想される動作の詳細情報を入力します。
- Product ドロップダウンメニューから Red Hat OpenShift Service on AWS を選択します。
- Red Hat ナレッジベースで推奨されるソリューション一覧を確認してください。この一覧に上げられているソリューションは、報告しようとしている問題に適用される可能性があります。提案されている記事が問題に対応していない場合は、Continue をクリックします。
- 報告している問題に対する一致に基づいて推奨される Red Hat ナレッジベースソリューションの一覧が更新されることを確認してください。ケース作成プロセスでより多くの情報を提供すると、このリストの絞り込みが行われます。提案されている記事が問題に対応していない場合は、Continue をクリックします。
- アカウント情報が予想通りに表示されていることを確認し、そうでない場合は適宜修正します。
自動入力された Red Hat OpenShift Service on AWS クラスター ID が正しいことを確認します。正しくない場合は、クラスター ID を手動で取得します。
Red Hat OpenShift Service on AWS Web コンソールを使用して手動でクラスター ID を取得するには以下を実行します。
- Home → Overview に移動します。
- Details セクションの Cluster ID フィールドで値を見つけます。
または、Red Hat OpenShift Service on AWS Web コンソールから新しいサポートケースを開き、クラスター ID を自動入力することもできます。
- ツールバーから、(?)Help → Open Support Case に移動します。
- Cluster ID 値が自動的に入力されます。
OpenShift CLI (
oc) を使用してクラスター ID を取得するには、以下のコマンドを実行します。$ oc get clusterversion -o jsonpath='{.items[].spec.clusterID}{"\n"}'
プロンプトが表示されたら、以下の質問に回答し、Continue をクリックします。
- What are you experiencing? What are you expecting to happen?
- Define the value or impact to you or the business.
- Where are you experiencing this behavior? What environment?
- When does this behavior occur? Frequency? Repeatedly? At certain times?
- 関連する診断データファイルをアップロードし、Continue をクリックします。
- 関連するケース管理の詳細情報を入力し、Continue をクリックします。
- ケースの詳細をプレビューし、Submit をクリックします。
第5章 接続クラスターを使用したリモートヘルスモニタリング
5.1. リモートヘルスモニタリングについて
Red Hat OpenShift Service on AWS は、クラスターに関する Telemetry および設定データを収集し、Telemeter Client および Insights Operator を使用してこれを Red Hat に報告します。Red Hat に提供されるデータは、このドキュメントで説明されている利点を提供します。
Telemetry および Insights Operator 経由でデータを Red Hat にレポートするクラスターは 接続クラスター (connected cluster) と見なされます。
Telemetry は、Red Hat が使用する用語で、Red Hat OpenShift Service on AWS Telemeter Client が Red Hat に送信する情報を表します。サブスクリプション管理の自動化、クラスターの健全性の監視、サポートの支援、カスタマークスペリエンスの向上を可能にするために、軽量の属性データが接続クラスターから Red Hat に送信されます。
Insights Operator は Red Hat OpenShift Service on AWS 設定データを収集して Red Hat に送信します。このデータは、クラスターが直面する可能性のある問題に関する情報を得るために使用されます。これらの洞察は、OpenShift Cluster Manager でクラスター管理者に伝達されます。
これらの 2 つのプロセスの詳細は、このドキュメントを参照してください。
Telemetry および Insights Operator の利点
ユーザーにとって、Telemetry および Insights Operator には次のような利点があります。
- 問題の特定および解決の強化。エンドユーザーには正常と思われるイベントも、Red Hat は多くのお客様を含む全体的な視点で観察できます。この視点により、一部の問題はより迅速に特定され、エンドユーザーがサポートケースを作成したり、Jira 問題 を作成しなくても解決することが可能です。
-
高度なリリース管理。Red Hat OpenShift Service on AWS は、
candidate、fast、およびstableリリースチャネルを提供しており、更新ストラテジーを選択できます。リリースのfastからstableに移行できるかどうかは、更新の成功率やアップグレード時に確認されるイベントに依存します。接続クラスターから提供される情報により、Red Hat はstableチャネルのリリースの品質を高め、fastチャネルで見つかった問題に対してより迅速に対応することができます。 - 新機能の明確な優先順位付け。収集されたデータでは、Red Hat OpenShift Service on AWS のどの領域が最も使用されているかを把握できます。この情報により、Red Hat はお客様に最も大きな影響を与える新機能の開発に重点的に取り組むことができます。
- 効率的なサポートエクスペリエンス。Red Hat カスタマーポータル でサポートチケットを作成する際に、接続クラスターのクラスター ID を指定できます。これにより、Red Hat は接続された情報を使用してクラスター固有の効率化されたサポートエクスペリエンスを提供できます。このドキュメントは、強化されたサポートエクスペリエンスの詳細情報を提供しています。
- 予測分析。OpenShift Cluster Manager でクラスターに表示される洞察は、接続されたクラスターから収集される情報によって有効化されます。Red Hat は、Red Hat OpenShift Service on AWS クラスターがさらされる問題を特定するのに役立つディープラーニング (深層学習)、機械学習、および人工知能の自動化の適用に取り組んでいます。
Red Hat OpenShift Service on AWS では、リモートヘルスレポートが常に有効になっています。オプトアウトすることはできません。
5.1.1. Telemetry について
Telemetry は厳選されたクラスターモニタリングメトリクスのサブセットを Red Hat に送信します。Telemeter Client はメトリクスの値を 4 分 30 秒ごとに取得し、データを Red Hat にアップロードします。これらのメトリクスは、このドキュメントで説明しています。
このデータストリームは、Red Hat がリアルタイムでクラスターをモニターし、お客様に影響を与える問題に随時対応するために使用されます。Red Hat はこれを使用することで、Red Hat OpenShift Service on AWS アップグレードをお客様にロールアウトして、サービスへの影響を最小限に抑え、アップグレードエクスペリエンスを継続的に改善することもできます。
Red Hat サポートおよびエンジニアリングチームは、サポートケースでレポートされるデータにアクセスする場合と同じ制限が適用された状態で、このデバッグ情報を使用できます。接続クラスターに関するすべての情報は、Red Hat OpenShift Service on AWS をより使いやすく、直感的に使用できるように、Red Hat が使用します。
5.1.1.1. Telemetry で収集される情報
以下の情報は、Telemetry によって収集されます。
5.1.1.1.1. システム情報
- Red Hat OpenShift Service on AWS クラスターのバージョン情報、および更新バージョンの可用性を特定するために使用されるインストールの更新の詳細を含むバージョン情報
- クラスターごとに利用可能な更新の数、更新に使用されるチャネルおよびイメージリポジトリー、更新の進捗情報、および更新で発生するエラーの数などの更新情報
- インストール時に生成される一意でランダムな識別子
- クラウドインフラストラクチャーレベルのノード設定、ホスト名、IP アドレス、Kubernetes Pod 名、namespace、およびサービスなど、Red Hat サポートがお客様にとって有用なサポートを提供するのに役立つ設定の詳細
- クラスターにインストールされている Red Hat OpenShift Service on AWS フレームワークコンポーネントおよびそれらの状態とステータス
- 動作が低下した Operator の "関連オブジェクト" として一覧表示されるすべての namespace のイベント
- 動作が低下したソフトウェアに関する情報
- 証明書の有効性に関する情報
- Red Hat OpenShift Service on AWS がデプロイされているプロバイダープラットフォームの名前とデータセンターの場所
5.1.1.1.2. サイジング情報
- CPU コアの数およびそれぞれに使用される RAM の容量を含む、クラスター、マシンタイプ、およびマシンに関するサイジング情報
- etcd メンバーの数および etcd クラスターに保存されるオブジェクトの数
- ビルドストラテジータイプ別のアプリケーションビルドの数
5.1.1.1.3. 使用情報
- コンポーネント、機能および拡張機能に関する使用率の情報
- テクノロジープレビューおよびサポート対象外の設定に関する使用率の詳細
Telemetry は、ユーザー名やパスワードなどの識別情報を収集しません。Red Hat は、意図的な個人情報の収集は行いません。誤って個人情報を受信したことが明らかになった場合、Red Hat はその情報を削除します。Telemetry データが個人データに該当する場合は、Red Hat プライバシーステートメント を参照し、Red Hat のプライバシー方針を確認してください。
5.1.1.2. ユーザーテレメトリー
Red Hat は、ブラウザーから匿名化されたユーザーデータを収集します。この匿名化されたデータには、Telemetry が有効になっているすべてのクラスターのユーザーが使用するページ、機能、リソースタイプが含まれます。
他の考慮事項
- ユーザーイベントは SHA-1 ハッシュとしてグループ化されます。
-
ユーザーの IP アドレスは
0.0.0.0として保存されます。 - ユーザー名と IP アドレスは別々の値として保存されることはありません。
5.1.2. Insights Operator について
Insights Operator は設定およびコンポーネントの障害ステータスを定期的に収集し、デフォルトで 2 時間ごとにそのデータを Red Hat に報告します。この情報により、Red Hat は設定や Telemetry で報告されるデータよりも詳細な障害データを評価できます。
Red Hat OpenShift Service on AWS のユーザーは、Red Hat Hybrid Cloud Console の Advisor サービスで各クラスターのレポートを表示できます。問題が特定された場合、Red Hat Lightspeed はさらに詳しい情報を提供し、可能な場合は問題を解決する手順も提供します。
Insights Operator は、ユーザー名、パスワード、または証明書などの識別情報を収集しません。Red Hat Lightspeed のデータ収集と制御の詳細は Red Hat Lightspeed Data & Application Security を参照してください。
Red Hat は、すべての接続クラスター情報を次の目的で使用します。
- Red Hat Hybrid Cloud Console の Advisor サービスで、潜在的なクラスターの問題を特定し、解決策と予防措置を提供します。
- 集約された重要な情報を製品チームとサポートチームに提供することで、Red Hat OpenShift Service on AWS を改善します。
- Red Hat OpenShift Service on AWS の直感的に使用できるようにします。
5.1.2.1. Insights Operator によって収集される情報
Insights Operator によって収集される情報は次のとおりです。
- Red Hat OpenShift Service on AWS のバージョンおよび環境に固有の問題を特定するためのクラスターおよびそのコンポーネントに関する一般的な情報
- 誤った設定や設定するパラメーターに固有の問題の判別に使用するクラスターのイメージレジストリー設定などの設定ファイル。
- クラスターコンポーネントで発生するエラー。
- 実行中の更新の進捗情報、およびコンポーネントのアップグレードのステータス。
- Red Hat OpenShift Service on AWS がデプロイされているプラットフォームとクラスターが配置されているリージョンの詳細
- 個別の Secure Hash Algorithm (SHA) 値に変換されたクラスターのワークロード情報。これにより、Red Hat は機密情報を開示することなく、ワークロードのセキュリティーとバージョンの脆弱性を評価できます。
- ランタイムの種類、名前、バージョンなど、オペレーティングシステムとランタイム環境に関するワークロード情報。このデータにより、Red Hat OpenShift Service on AWS コンテナーの使用方法をより的確に把握し、最適な使用率を実現するための投資判断を積極的に支援できるようになります。
-
Operator が問題を報告すると、
openshift-*およびkube-*プロジェクトのコア Red Hat OpenShift Service on AWS Pod に関する情報が収集されます。これには、状態、リソース、セキュリティーコンテキスト、ボリューム情報などが含まれます。
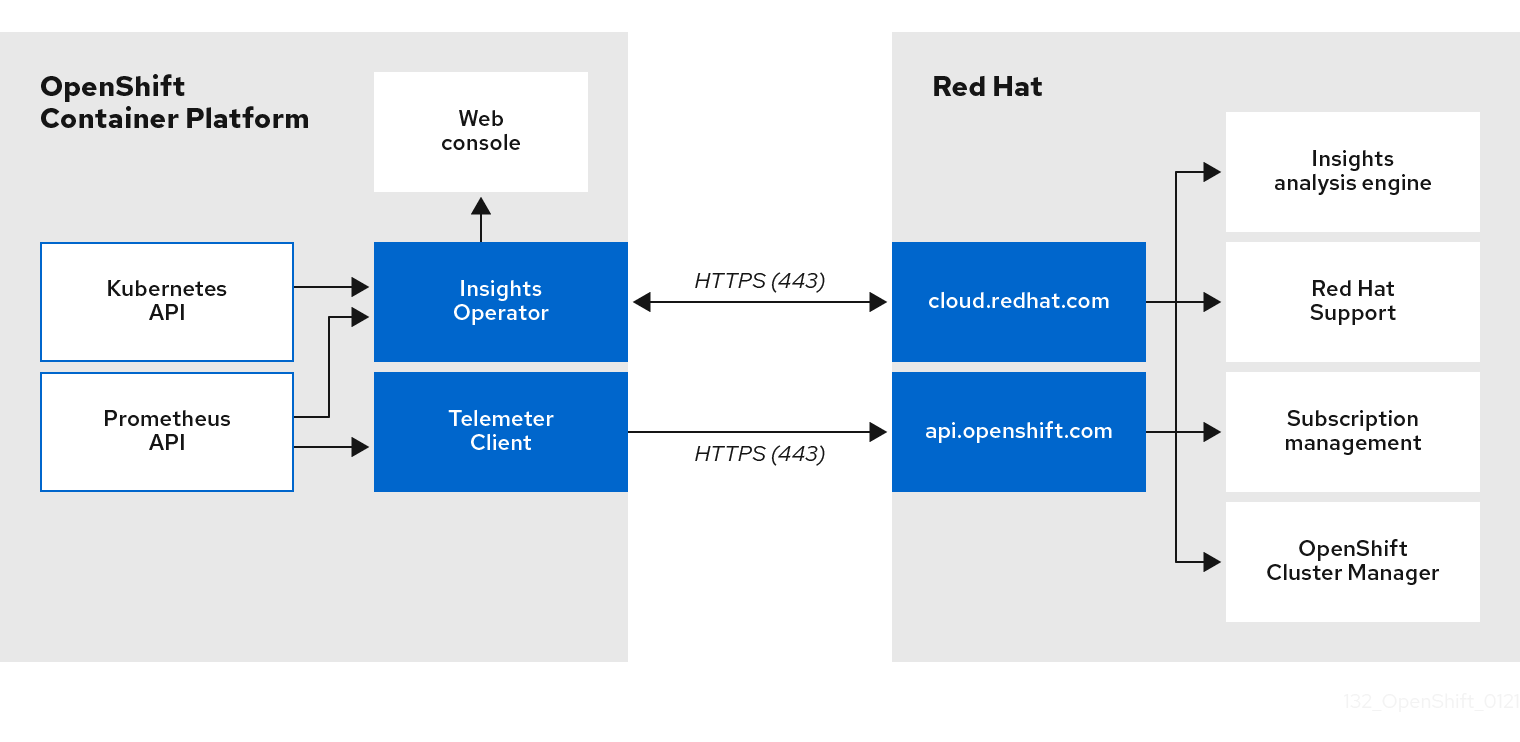
5.1.3. Telemetry および Insights Operator データフローについて
Telemeter Client は、Prometheus API から選択した時系列データを収集します。時系列データは、処理するために 4 分 30 秒ごとに api.openshift.com にアップロードされます。
Insights Operator は、選択したデータを Kubernetes API および Prometheus API からアーカイブに収集します。アーカイブは、処理のために 2 時間ごとに OpenShift Cluster Manager にアップロードされます。Insights Operator は、OpenShift Cluster Manager から最新の Red Hat Lightspeed 分析もダウンロードします。これは、Red Hat OpenShift Service on AWS Web コンソールの Overview ページに含まれる Red Hat Lightspeed status ポップアップを入力するために使用されます。
Red Hat との通信はすべて、Transport Layer Security (TLS) および相互証明書認証を使用して、暗号化されたチャネル上で行われます。すべてのデータは移動中および停止中に暗号化されます。
顧客データを処理するシステムへのアクセスは、マルチファクター認証と厳格な認証制御によって制御されます。アクセスは、知る必要がある場合に限って付与され、必要な操作に制限されます。
Telemetry および Insights Operator データフロー
5.1.4. リモートヘルスモニタリングデータの使用方法に関する追加情報
リモートヘルスモニタリングを有効にするために収集される情報の詳細は、Information collected by Telemetry および Information collected by the Insights Operator を参照してください。
このドキュメントで前述したとおり、Red Hat は、サポートおよびアップグレードの提供、パフォーマンス/設定の最適化、サービスへの影響の最小化、脅威の特定および修復、トラブルシューティング、オファリングおよびユーザーエクスペリエンスの強化、問題への対応および請求を目的として (該当する場合)、お客様の Red Hat 製品使用データを収集します。
収集における対策
Red Hat は、Telemetry および設定データを保護するために設計された技術的および組織的な対策を採用しています。
共有
Red Hat は、ユーザーエクスペリエンスの向上に向けて、Telemetry および Insights Operator で収集されるデータを内部で共有する場合があります。Red Hat は、以下の目的で Red Hat のビジネスパートナーと、お客様を特定しない集約された形式で Telemetry および設定データを共有する場合があります。つまり、パートナーが市場およびお客様の Red Hat のオファリングの使用をより良く理解できるように支援することを目的とするか、それらのパートナーと共同でサポートしている製品の統合を効果的に行うことを目的としています。
サードパーティー
Red Hat は、Telemetry および設定データの収集、分析、および保管を支援するために、特定のサードパーティーと連携する場合があります。
5.2. リモートヘルスモニタリングによって収集されるデータの表示
ユーザーコントロール/Telemetry および設定データ収集の有効化および無効化
管理者は、Telemetry および Insights Operator によって収集されるメトリクスを確認できます。
5.2.1. Telemetry によって収集されるデータの表示
Telemetry でキャプチャーされるクラスターとコンポーネントの時系列データを表示することができます。
前提条件
-
OpenShift Container Platform CLI (
oc) がインストールされている。 -
dedicated-adminロールを持つユーザーとしてクラスターにアクセスできる。
手順
- クラスターにログインします。
- 次のコマンドを実行すると、クラスターの Prometheus サービスにクエリーが実行され、Telemetry によってキャプチャーされた時系列データの完全なセットが返されます。
以下の例には、Red Hat OpenShift Service on AWS に固有の値がいくつか含まれています。
$ curl -G -k -H "Authorization: Bearer $(oc whoami -t)" \
https://$(oc get route prometheus-k8s-federate -n \
openshift-monitoring -o jsonpath="{.spec.host}")/federate \
--data-urlencode 'match[]={__name__=~"cluster:usage:.*"}' \
--data-urlencode 'match[]={__name__="count:up0"}' \
--data-urlencode 'match[]={__name__="count:up1"}' \
--data-urlencode 'match[]={__name__="cluster_version"}' \
--data-urlencode 'match[]={__name__="cluster_version_available_updates"}' \
--data-urlencode 'match[]={__name__="cluster_version_capability"}' \
--data-urlencode 'match[]={__name__="cluster_operator_up"}' \
--data-urlencode 'match[]={__name__="cluster_operator_conditions"}' \
--data-urlencode 'match[]={__name__="cluster_version_payload"}' \
--data-urlencode 'match[]={__name__="cluster_installer"}' \
--data-urlencode 'match[]={__name__="cluster_infrastructure_provider"}' \
--data-urlencode 'match[]={__name__="cluster_feature_set"}' \
--data-urlencode 'match[]={__name__="instance:etcd_object_counts:sum"}' \
--data-urlencode 'match[]={__name__="ALERTS",alertstate="firing"}' \
--data-urlencode 'match[]={__name__="code:apiserver_request_total:rate:sum"}' \
--data-urlencode 'match[]={__name__="cluster:capacity_cpu_cores:sum"}' \
--data-urlencode 'match[]={__name__="cluster:capacity_memory_bytes:sum"}' \
--data-urlencode 'match[]={__name__="cluster:cpu_usage_cores:sum"}' \
--data-urlencode 'match[]={__name__="cluster:memory_usage_bytes:sum"}' \
--data-urlencode 'match[]={__name__="openshift:cpu_usage_cores:sum"}' \
--data-urlencode 'match[]={__name__="openshift:memory_usage_bytes:sum"}' \
--data-urlencode 'match[]={__name__="workload:cpu_usage_cores:sum"}' \
--data-urlencode 'match[]={__name__="workload:memory_usage_bytes:sum"}' \
--data-urlencode 'match[]={__name__="cluster:virt_platform_nodes:sum"}' \
--data-urlencode 'match[]={__name__="cluster:node_instance_type_count:sum"}' \
--data-urlencode 'match[]={__name__="cnv:vmi_status_running:count"}' \
--data-urlencode 'match[]={__name__="cluster:vmi_request_cpu_cores:sum"}' \
--data-urlencode 'match[]={__name__="node_role_os_version_machine:cpu_capacity_cores:sum"}' \
--data-urlencode 'match[]={__name__="node_role_os_version_machine:cpu_capacity_sockets:sum"}' \
--data-urlencode 'match[]={__name__="subscription_sync_total"}' \
--data-urlencode 'match[]={__name__="olm_resolution_duration_seconds"}' \
--data-urlencode 'match[]={__name__="csv_succeeded"}' \
--data-urlencode 'match[]={__name__="csv_abnormal"}' \
--data-urlencode 'match[]={__name__="cluster:kube_persistentvolumeclaim_resource_requests_storage_bytes:provisioner:sum"}' \
--data-urlencode 'match[]={__name__="cluster:kubelet_volume_stats_used_bytes:provisioner:sum"}' \
--data-urlencode 'match[]={__name__="ceph_cluster_total_bytes"}' \
--data-urlencode 'match[]={__name__="ceph_cluster_total_used_raw_bytes"}' \
--data-urlencode 'match[]={__name__="ceph_health_status"}' \
--data-urlencode 'match[]={__name__="odf_system_raw_capacity_total_bytes"}' \
--data-urlencode 'match[]={__name__="odf_system_raw_capacity_used_bytes"}' \
--data-urlencode 'match[]={__name__="odf_system_health_status"}' \
--data-urlencode 'match[]={__name__="job:ceph_osd_metadata:count"}' \
--data-urlencode 'match[]={__name__="job:kube_pv:count"}' \
--data-urlencode 'match[]={__name__="job:odf_system_pvs:count"}' \
--data-urlencode 'match[]={__name__="job:ceph_pools_iops:total"}' \
--data-urlencode 'match[]={__name__="job:ceph_pools_iops_bytes:total"}' \
--data-urlencode 'match[]={__name__="job:ceph_versions_running:count"}' \
--data-urlencode 'match[]={__name__="job:noobaa_total_unhealthy_buckets:sum"}' \
--data-urlencode 'match[]={__name__="job:noobaa_bucket_count:sum"}' \
--data-urlencode 'match[]={__name__="job:noobaa_total_object_count:sum"}' \
--data-urlencode 'match[]={__name__="odf_system_bucket_count", system_type="OCS", system_vendor="Red Hat"}' \
--data-urlencode 'match[]={__name__="odf_system_objects_total", system_type="OCS", system_vendor="Red Hat"}' \
--data-urlencode 'match[]={__name__="noobaa_accounts_num"}' \
--data-urlencode 'match[]={__name__="noobaa_total_usage"}' \
--data-urlencode 'match[]={__name__="console_url"}' \
--data-urlencode 'match[]={__name__="cluster:ovnkube_master_egress_routing_via_host:max"}' \
--data-urlencode 'match[]={__name__="cluster:network_attachment_definition_instances:max"}' \
--data-urlencode 'match[]={__name__="cluster:network_attachment_definition_enabled_instance_up:max"}' \
--data-urlencode 'match[]={__name__="cluster:ingress_controller_aws_nlb_active:sum"}' \
--data-urlencode 'match[]={__name__="cluster:route_metrics_controller_routes_per_shard:min"}' \
--data-urlencode 'match[]={__name__="cluster:route_metrics_controller_routes_per_shard:max"}' \
--data-urlencode 'match[]={__name__="cluster:route_metrics_controller_routes_per_shard:avg"}' \
--data-urlencode 'match[]={__name__="cluster:route_metrics_controller_routes_per_shard:median"}' \
--data-urlencode 'match[]={__name__="cluster:openshift_route_info:tls_termination:sum"}' \
--data-urlencode 'match[]={__name__="insightsclient_request_send_total"}' \
--data-urlencode 'match[]={__name__="cam_app_workload_migrations"}' \
--data-urlencode 'match[]={__name__="cluster:apiserver_current_inflight_requests:sum:max_over_time:2m"}' \
--data-urlencode 'match[]={__name__="cluster:alertmanager_integrations:max"}' \
--data-urlencode 'match[]={__name__="cluster:telemetry_selected_series:count"}' \
--data-urlencode 'match[]={__name__="openshift:prometheus_tsdb_head_series:sum"}' \
--data-urlencode 'match[]={__name__="openshift:prometheus_tsdb_head_samples_appended_total:sum"}' \
--data-urlencode 'match[]={__name__="monitoring:container_memory_working_set_bytes:sum"}' \
--data-urlencode 'match[]={__name__="namespace_job:scrape_series_added:topk3_sum1h"}' \
--data-urlencode 'match[]={__name__="namespace_job:scrape_samples_post_metric_relabeling:topk3"}' \
--data-urlencode 'match[]={__name__="monitoring:haproxy_server_http_responses_total:sum"}' \
--data-urlencode 'match[]={__name__="rhmi_status"}' \
--data-urlencode 'match[]={__name__="status:upgrading:version:rhoam_state:max"}' \
--data-urlencode 'match[]={__name__="state:rhoam_critical_alerts:max"}' \
--data-urlencode 'match[]={__name__="state:rhoam_warning_alerts:max"}' \
--data-urlencode 'match[]={__name__="rhoam_7d_slo_percentile:max"}' \
--data-urlencode 'match[]={__name__="rhoam_7d_slo_remaining_error_budget:max"}' \
--data-urlencode 'match[]={__name__="cluster_legacy_scheduler_policy"}' \
--data-urlencode 'match[]={__name__="cluster_master_schedulable"}' \
--data-urlencode 'match[]={__name__="che_workspace_status"}' \
--data-urlencode 'match[]={__name__="che_workspace_started_total"}' \
--data-urlencode 'match[]={__name__="che_workspace_failure_total"}' \
--data-urlencode 'match[]={__name__="che_workspace_start_time_seconds_sum"}' \
--data-urlencode 'match[]={__name__="che_workspace_start_time_seconds_count"}' \
--data-urlencode 'match[]={__name__="cco_credentials_mode"}' \
--data-urlencode 'match[]={__name__="cluster:kube_persistentvolume_plugin_type_counts:sum"}' \
--data-urlencode 'match[]={__name__="visual_web_terminal_sessions_total"}' \
--data-urlencode 'match[]={__name__="acm_managed_cluster_info"}' \
--data-urlencode 'match[]={__name__="cluster:vsphere_vcenter_info:sum"}' \
--data-urlencode 'match[]={__name__="cluster:vsphere_esxi_version_total:sum"}' \
--data-urlencode 'match[]={__name__="cluster:vsphere_node_hw_version_total:sum"}' \
--data-urlencode 'match[]={__name__="openshift:build_by_strategy:sum"}' \
--data-urlencode 'match[]={__name__="rhods_aggregate_availability"}' \
--data-urlencode 'match[]={__name__="rhods_total_users"}' \
--data-urlencode 'match[]={__name__="instance:etcd_disk_wal_fsync_duration_seconds:histogram_quantile",quantile="0.99"}' \
--data-urlencode 'match[]={__name__="instance:etcd_mvcc_db_total_size_in_bytes:sum"}' \
--data-urlencode 'match[]={__name__="instance:etcd_network_peer_round_trip_time_seconds:histogram_quantile",quantile="0.99"}' \
--data-urlencode 'match[]={__name__="instance:etcd_mvcc_db_total_size_in_use_in_bytes:sum"}' \
--data-urlencode 'match[]={__name__="instance:etcd_disk_backend_commit_duration_seconds:histogram_quantile",quantile="0.99"}' \
--data-urlencode 'match[]={__name__="appsvcs:cores_by_product:sum"}' \
--data-urlencode 'match[]={__name__="nto_custom_profiles:count"}' \
--data-urlencode 'match[]={__name__="openshift_csi_share_configmap"}' \
--data-urlencode 'match[]={__name__="openshift_csi_share_secret"}' \
--data-urlencode 'match[]={__name__="openshift_csi_share_mount_failures_total"}' \
--data-urlencode 'match[]={__name__="openshift_csi_share_mount_requests_total"}' \
--data-urlencode 'match[]={__name__="cluster:velero_backup_total:max"}' \
--data-urlencode 'match[]={__name__="cluster:velero_restore_total:max"}' \
--data-urlencode 'match[]={__name__="eo_es_storage_info"}' \
--data-urlencode 'match[]={__name__="eo_es_redundancy_policy_info"}' \
--data-urlencode 'match[]={__name__="eo_es_defined_delete_namespaces_total"}' \
--data-urlencode 'match[]={__name__="eo_es_misconfigured_memory_resources_info"}' \
--data-urlencode 'match[]={__name__="cluster:eo_es_data_nodes_total:max"}' \
--data-urlencode 'match[]={__name__="cluster:eo_es_documents_created_total:sum"}' \
--data-urlencode 'match[]={__name__="cluster:eo_es_documents_deleted_total:sum"}' \
--data-urlencode 'match[]={__name__="pod:eo_es_shards_total:max"}' \
--data-urlencode 'match[]={__name__="eo_es_cluster_management_state_info"}' \
--data-urlencode 'match[]={__name__="imageregistry:imagestreamtags_count:sum"}' \
--data-urlencode 'match[]={__name__="imageregistry:operations_count:sum"}' \
--data-urlencode 'match[]={__name__="log_logging_info"}' \
--data-urlencode 'match[]={__name__="log_collector_error_count_total"}' \
--data-urlencode 'match[]={__name__="log_forwarder_pipeline_info"}' \
--data-urlencode 'match[]={__name__="log_forwarder_input_info"}' \
--data-urlencode 'match[]={__name__="log_forwarder_output_info"}' \
--data-urlencode 'match[]={__name__="cluster:log_collected_bytes_total:sum"}' \
--data-urlencode 'match[]={__name__="cluster:log_logged_bytes_total:sum"}' \
--data-urlencode 'match[]={__name__="cluster:kata_monitor_running_shim_count:sum"}' \
--data-urlencode 'match[]={__name__="platform:hypershift_hostedclusters:max"}' \
--data-urlencode 'match[]={__name__="platform:hypershift_nodepools:max"}' \
--data-urlencode 'match[]={__name__="namespace:noobaa_unhealthy_bucket_claims:max"}' \
--data-urlencode 'match[]={__name__="namespace:noobaa_buckets_claims:max"}' \
--data-urlencode 'match[]={__name__="namespace:noobaa_unhealthy_namespace_resources:max"}' \
--data-urlencode 'match[]={__name__="namespace:noobaa_namespace_resources:max"}' \
--data-urlencode 'match[]={__name__="namespace:noobaa_unhealthy_namespace_buckets:max"}' \
--data-urlencode 'match[]={__name__="namespace:noobaa_namespace_buckets:max"}' \
--data-urlencode 'match[]={__name__="namespace:noobaa_accounts:max"}' \
--data-urlencode 'match[]={__name__="namespace:noobaa_usage:max"}' \
--data-urlencode 'match[]={__name__="namespace:noobaa_system_health_status:max"}' \
--data-urlencode 'match[]={__name__="ocs_advanced_feature_usage"}' \
--data-urlencode 'match[]={__name__="os_image_url_override:sum"}' \
--data-urlencode 'match[]={__name__="openshift:openshift_network_operator_ipsec_state:info"}'
5.3. Red Hat Lightspeed を使用してクラスターの問題を特定する
Red Hat Lightspeed は、Insights Operator から送信されるデータを繰り返し分析します。このデータには、Deployment Validation Operator (DVO) からのワークロード推奨事項も含まれます。Red Hat OpenShift Service on AWS のユーザーは、Red Hat Hybrid Cloud Console の Advisor サービスで結果を表示できます。
5.3.1. Red Hat OpenShift Service on AWS 向け Red Hat Lightspeed Advisor について
Red Hat Lightspeed アドバイザーサービスを使用して、Red Hat OpenShift Service on AWS クラスターの健全性を評価および監視できます。個々のクラスターとインフラストラクチャー全体のどちらに懸念があるかにかかわらず、サービスの可用性、フォールトトレランス、パフォーマンス、またはセキュリティーに影響を及ぼす可能性のある問題にさらされていることを認識することが重要です。
クラスターに Deployment Validation Operator (DVO) がインストールされている場合は、クラスターの健全性の問題につながる可能性がある設定を持つワークロードも推奨事項で示されます。
Red Hat Lightspeed 分析の結果は、Red Hat Hybrid Cloud Console の Red Hat Lightspeed advisor サービスで確認できます。Red Hat Hybrid Cloud Console では、次のアクションを実行できます。
- 特定の推奨事項の影響を受けるクラスターとワークロードを表示する。
- 強力なフィルタリング機能を使用して、結果をその推奨事項だけに絞り込む。
- 個々の推奨事項とそれが示すリスクの詳細を確認し、個々のクラスターに合わせた解決策を確認する。
- 結果を他の関係者と共有する。
5.3.2. Red Hat Lightspeed advisor サービスの推奨事項を理解する
Red Hat Lightspeed advisor サービスは、クラスターとワークロードのサービス可用性、フォールトトレランス、パフォーマンス、またはセキュリティーに悪影響を与える可能性のあるさまざまなクラスターの状態とコンポーネント設定に関する情報をバンドルします。この情報セットは、Red Hat Lightspeed advisor サービスでは推奨事項と呼ばれます。クラスターの推奨事項には次の情報が含まれます。
- Name: 推奨事項の簡単な説明
- Added: 推奨事項が Red Hat Lightspeed advisor サービスアーカイブに公開された場合
- Category: 問題がサービスの可用性、フォールトトレランス、パフォーマンス、またはセキュリティーに悪影響を及ぼす可能性があるかどうか
- Total risk: 状態がクラスターまたはワークロードに悪影響を与える 可能性 と、悪影響が発生した場合のシステム運用への 影響度 から算出された値
- Clusters: 推奨事項が検出されたクラスターのリスト
- Description: クラスターへの影響を含む、問題の簡単な概要
5.3.3. クラスターの潜在的な問題の表示
このセクションでは、OpenShift Cluster Manager 上の Red Hat Lightspeed Advisor で Red Hat Lightspeed レポートを表示する方法について説明します。
Red Hat Lightspeed はクラスターを繰り返し分析し、最新の結果を表示する点に注意してください。問題を修正した場合や新しい問題が検出された場合などは、これらの結果が変化する可能性があります。
前提条件
- クラスターが OpenShift Cluster Manager に登録されている。
- リモートヘルスレポートが有効になっている (デフォルト)。
- OpenShift Cluster Manager にログインしている。
手順
OpenShift Cluster Manager で、Advisor → Recommendations に移動します。
結果に応じて、Red Hat Lightspeed advisor サービスは次のいずれかを表示します。
- Red Hat Lightspeed が問題を特定しなかった場合: No matching recommendations found。
- Red Hat Lightspeed が検出した問題のリストで、リスク (低、中、重要、および重大) ごとにグループ化されています。
- Red Hat Lightspeed がまだクラスターを分析していない場合: No clusters yet。分析は、クラスターがインストールされて登録され、インターネットに接続された直後に開始します。
問題が表示された場合は、エントリーの前にある > アイコンをクリックして詳細を確認してください。
問題によっては、Red Hat が提供する関連情報へのリンクがあります。
5.3.4. Red Hat Lightspeed advisor サービスの推奨事項をすべて表示
Recommendations ビューはデフォルトで、クラスターで検出された推奨事項のみを表示します。ただし、Advisor サービスのアーカイブにあるすべての推奨事項を表示することもできます。
前提条件
- リモートヘルスレポートが有効になっている (デフォルト)。
- クラスターが Red Hat Hybrid Cloud Console に 登録 されている。
- OpenShift Cluster Manager にログインしている。
手順
- OpenShift Cluster Manager で、Advisor → Recommendations に移動します。
Clusters Impacted フィルターおよび Status フィルターの横にある X アイコンをクリックします。
これで、クラスターの潜在的な推奨事項をすべて参照できます。
5.3.5. Advisor の推奨事項のフィルター
Red Hat Lightspeed advisor サービスは、多数の推奨事項を返すことができます。最も重要な推奨事項に焦点を当てるために、Advisor の推奨事項 リストにフィルターを適用して、優先度の低い推奨事項を除外できます。
デフォルトでは、フィルターは 1 つ以上のクラスターに影響を与える有効な推奨事項のみを表示するように設定されています。Red Hat Lightspeed ライブラリー内のすべての推奨事項または無効な推奨事項を表示するには、フィルターをカスタマイズできます。
フィルターを適用するには、フィルタータイプを選択し、ドロップダウンリストで使用できるオプションに基づき値を設定します。推奨事項のリストには、複数のフィルターを適用できます。
次のフィルタータイプを設定できます。
- Name: 名前で推奨事項を検索します。
- Total risk: クラスターに対する悪影響の可能性と重大度を示す値として、Critical、Important、Moderate、Low から 1 つ以上選択します。
- Impact: クラスター操作の継続性に対する潜在的な影響を示す値を、Critical、High、Medium、Low から 1 つ以上選択します。
- Likelihood: 推奨事項が実行された場合にクラスターに悪影響を及ぼす可能性を示す値を、Critical、High、Medium、Low から 1 つ以上選択します。
- Category: 注目するカテゴリーを、Service Availability、Performance、Fault Tolerance、Security、Best Practice から 1 つ以上選択します。
- Status: ラジオボタンをクリックして、有効な推奨事項 (デフォルト)、無効な推奨事項、またはすべての推奨事項を表示します。
- Clusters impacted: 現在 1 つ以上のクラスターに影響を与えている推奨事項、影響を与えていない推奨事項、またはすべての推奨事項を表示するようにフィルターを設定します。
- Risk of change: 解決策の実装がクラスター操作に及ぼす可能性のあるリスクを示す値を、High、Moderate、Low、Very low から 1 つ以上選択します。
5.3.5.1. Red Hat Lightspeed advisor サービスの推奨事項のフィルタリング
Red Hat OpenShift Service on AWS クラスターマネージャーは、推奨事項リストに表示される推奨事項をフィルターできます。フィルターを適用すると、報告される推奨事項の数を減らし、最も優先度の高い推奨事項に集中できます。
次の手順は、Category フィルターの設定方法および削除方法を示していますが、この手順は任意のフィルタータイプおよびそれぞれの値にも適用できます。
前提条件
Hybrid Cloud Console の OpenShift Cluster Manager にログインしている。
手順
- OpenShift > Advisor > Recommendations に移動します。
- メインのフィルタータイプドロップダウンリストで、Category フィルタータイプを選択します。
- フィルター値のドロップダウンリストを展開し、表示する推奨事項の各カテゴリー横にあるチェックボックスを選択します。不要なカテゴリーのチェックボックスはオフのままにします。
- オプション: フィルターを追加して、リストをさらに絞り込みます。
選択したカテゴリーの推奨事項のみがリストに表示されます。
検証
- フィルターを適用した後、更新された推奨事項リストを表示できます。適用されたフィルターは、デフォルトのフィルターの隣に追加されます。
5.3.5.2. Red Hat Lightspeed advisor サービスの推奨事項からフィルターを削除する
推奨事項のリストには、複数のフィルターを適用できます。準備が完了したフィルターは、個別に削除することも、完全にリセットすることもできます。
フィルターを個別に削除する
- デフォルトのフィルターを含め、各フィルターの横にある X アイコンをクリックすると、フィルターを個別に削除できます。
デフォルト以外のフィルターをすべて削除する
- Reset filters をクリックすると、適用したフィルターのみが削除され、デフォルトのフィルターはそのまま残ります。
5.3.6. Red Hat Lightspeed advisor サービスの推奨事項を無効にする
クラスターに影響を与える特定の推奨事項を無効にして、それらがレポートに表示されないようにできます。単一のクラスターまたはすべてのクラスターの推奨を無効にできます。
すべてのクラスターの推奨を無効にすると、今後のクラスターにも適用されます。
前提条件
- リモートヘルスレポートが有効になっている (デフォルト)。
- クラスターが OpenShift Cluster Manager に登録されている。
- OpenShift Cluster Manager にログインしている。
手順
- OpenShift Cluster Manager で、Advisor → Recommendations に移動します。
- オプション: 必要に応じて、Clusters Impacted および Status フィルターを使用します。
次のいずれかの方法でアラートを無効にします。
アラートを無効にするには、以下を実行します。
-
アラートの Options メニュー
 をクリックし、Disable recommendation をクリックします。
- 理由を入力し、Save をクリックします。
-
アラートの Options メニュー
アラートを無効にする前に、そのアラートの影響を受けるクラスターを表示するには、以下を実行します。
- 無効にする推奨事項の名前をクリックします。その推奨事項のページに移動します。
- Affected clusters セクションで、クラスターのリストを確認します。
- Actions → Disable recommendation をクリックして、すべてのクラスターのアラートを無効にします。
- 理由を入力し、Save をクリックします。
5.3.7. 以前に無効にされた Red Hat Lightspeed advisor サービスの推奨事項を有効にする
すべてのクラスターに対して推奨事項が無効になっている場合、Red Hat Lightspeed advisor サービスに推奨事項が表示されなくなります。この動作は変更できます。
前提条件
- リモートヘルスレポートが有効になっている (デフォルト)。
- クラスターが OpenShift Cluster Manager に登録されている。
- OpenShift Cluster Manager にログインしている。
手順
- OpenShift Cluster Manager で、Advisor → Recommendations に移動します。
無効になっている推奨事項から、表示する推奨事項をフィルタリングします。
- Status ドロップダウンメニューから Status を選択します。
- Filter by status ドロップダウンメニューから、Disabled を選択します。
- オプション: Clusters impacted フィルターをクリアします。
- 有効にする推奨事項を特定します。
-
Options メニュー
をクリックし、Enable recommendation をクリックします。
5.3.8. ワークロードに対する Red Hat Lightspeed advisor サービスの推奨事項について
Red Hat Lightspeed advisor サービスを使用すると、クラスターだけでなくワークロードにも影響する推奨事項に関する情報を表示および管理できます。Advisor サービスは、デプロイメント検証を活用し、OpenShift クラスターの管理者がデプロイメントポリシーに対する実行時の違反をすべて把握できるように支援します。ワークロードの推奨事項は、Red Hat Hybrid Cloud Console の OpenShift > Advisor > Workloads で確認できます。詳細は、次の関連情報を参照してください。
5.3.9. Web コンソールで Red Hat Lightspeed のステータスを表示する
Red Hat Lightspeed はクラスターを繰り返し分析し、クラスターので発生する可能性があると特定された問題のステータスを、Red Hat OpenShift Service on AWS Web コンソールに表示できます。このステータスは、さまざまなカテゴリーの問題の数を示し、詳細は、OpenShift Cluster Manager レポートへのリンクを示します。
前提条件
- クラスターが OpenShift Cluster Manager に 登録されている。
- リモートヘルスレポートが有効になっている (デフォルト)。
- Red Hat OpenShift Service on AWS Web コンソールにログインしている。
手順
- Red Hat OpenShift Service on AWS Web コンソールで Home → Overview に移動します。
Status カードで Red Hat Lightspeed をクリックします。
ポップアップウィンドウには、リスクごとにグループ化された潜在的な問題がリスト表示されます。個々のカテゴリーか、View all recommendations in Red Hat Lightspeed ADVISOR をクリックして、詳細を表示します。
5.4. Insights Operator の使用
Insights Operator は設定およびコンポーネントの障害ステータスを定期的に収集し、デフォルトで 2 時間ごとにそのデータを Red Hat に報告します。この情報により、Red Hat は設定や Telemetry で報告されるデータよりも詳細な障害データを評価できます。Red Hat OpenShift Service on AWS のユーザーは、Red Hat Hybrid Cloud Console の Advisor サービスでレポートを表示できます。
5.4.1. Insights Operator アラートについて
Insights Operator は、Prometheus モニタリングシステムを介して Alertmanager にアラートを宣言します。これらのアラートは、以下のいずれかの方法を使用して、Red Hat OpenShift Service on AWS Web コンソールのアラート UI で表示できます。
- Administrator パースペクティブで、Observe → Alerting をクリックします。
- Developer パースペクティブで、Observe → <project_name> → Alerts タブをクリックします。
現在、Insights Operator は、条件が満たされたときに次のアラートを送信します。
| アラート | 説明 |
|---|---|
|
| Insights Operator が無効になっています。 |
|
| Red Hat Subscription Management で、Simple Content Access が有効になっていません。 |
|
| Red Hat Lightspeed には、クラスターに関するアクティブな推奨事項があります。 |
5.4.2. Deployment Validation Operator のデータの難読化
デフォルトでは、Deployment Validation Operator (DVO) をインストールすると、Red Hat OpenShift Service on AWS の Insights Operator によって収集および処理されるデータに、リソースの名前と一意の識別子 (UID) が追加されます。クラスター管理者の場合は、Insights Operator を設定して、Deployment Validation Operator (DVO) からのデータを難読化することができます。たとえば、アーカイブファイル内のワークロード名を難読化して、Red Hat に送信することができます。
リソースの名前を難読化するには、次の手順で説明するように、insights-config ConfigMap オブジェクトの obfuscation 属性を手動で設定し、workload_names 値を含める必要があります。
前提条件
- リモートヘルスレポートが有効になっている (デフォルト)。
- "cluster-admin" ロールで Red Hat OpenShift Service on AWS Web コンソールにログインしている。
-
insights-config
ConfigMapオブジェクトが、openshift-insightsnamespace に存在する。 - クラスターがセルフマネージドであり、Deployment Validation Operator がインストールされている。
手順
- Workloads → ConfigMaps に移動し、Project: openshift-insights を選択します。
-
insights-configConfigMapオブジェクトをクリックして開きます。 - Actions をクリックし、Edit ConfigMap を選択します。
- YAML view のラジオボタンをクリックします。
ファイル内で、
workload_names値を使用してobfuscation属性を設定します。apiVersion: v1 kind: ConfigMap # ... data: config.yaml: | dataReporting: obfuscation: - workload_names # ...- Save をクリックします。insights-config config-map の詳細ページが開きます。
-
config.yamlのobfuscation属性の値が- workload_namesに設定されていることを確認します。
第6章 クラスターに関するデータの収集
サポートケースを作成する際、ご使用のクラスターに関するデバッグ情報を Red Hat サポートに提供していただくと Red Hat のサポートに役立ちます。
以下を提供することが推奨されます。
6.1. must-gather ツールについて
oc adm must-gather CLI コマンドは、以下のような問題のデバッグに必要となる可能性のあるクラスターからの情報を収集します。
- リソース定義
- サービスログ
デフォルトで、oc adm must-gather コマンドはデフォルトのプラグインイメージを使用し、./must-gather.local に書き込みを行います。
または、以下のセクションで説明されているように、適切な引数を指定してコマンドを実行すると、特定の情報を収集できます。
1 つ以上の特定の機能に関連するデータを収集するには、以下のセクションに示すように、イメージと共に
--image引数を使用します。以下に例を示します。
$ oc adm must-gather \
  --image=registry.redhat.io/container-native-virtualization/cnv-must-gather-rhel9:v4.20.1
監査ログを収集するには、以下のセクションで説明されているように
-- /usr/bin/gather_audit_logs引数を使用します。以下に例を示します。
$ oc adm must-gather -- /usr/bin/gather_audit_logs注記- ファイルのサイズを小さくするために、監査ログはデフォルトの情報セットの一部として収集されません。
-
Windows オペレーティングシステムでは、
oc rsyncコマンドで使用するためにcwRsyncクライアントをインストールし、PATH変数に追加します。
oc adm must-gather を実行すると、ランダムな名前を持つ新規 Pod がクラスターの新規プロジェクトに作成されます。データはその Pod 上で収集され、現在の作業ディレクトリー内の must-gather.local で始まる新しいディレクトリーに保存されます。
以下に例を示します。
NAMESPACE                      NAME                 READY   STATUS      RESTARTS      AGE
...
openshift-must-gather-5drcj    must-gather-bklx4    2/2     Running     0             72s
openshift-must-gather-5drcj    must-gather-s8sdh    2/2     Running     0             72s
...
任意で、--run-namespace オプションを使用して、特定の namespace で oc adm must-gather コマンドを実行できます。
以下に例を示します。
$ oc adm must-gather --run-namespace <namespace> \
  --image=registry.redhat.io/container-native-virtualization/cnv-must-gather-rhel9:v4.20.1
6.1.1. Red Hat サポート用のクラスターに関するデータの収集
oc adm must-gather CLI コマンドを使用して、クラスターに関するデバッグ情報を収集できます。
前提条件
-
cluster-adminロールを持つユーザーとしてクラスターにアクセスできる。 -
Red Hat OpenShift Service on AWS CLI (
oc) がインストールされている。
手順
must-gatherデータを保存するディレクトリーに移動します。注記クラスターが非接続環境にある場合は、追加の手順を実行する必要があります。ミラーレジストリーに信頼される CA がある場合、まず信頼される CA をクラスターに追加する必要があります。非接続環境のすべてのクラスターに対して、デフォルトの
must-gatherイメージをイメージストリームとしてインポートする必要があります。$ oc import-image is/must-gather -n openshiftoc adm must-gatherコマンドを実行します。$ oc adm must-gather重要非接続環境を使用している場合には、must-gather の一部として
--imageフラグを使用し、ペイロードイメージを参照します。注記このコマンドは、デフォルトでランダムなコントロールプレーンノードを選択するため、Pod は
NotReadyおよびSchedulingDisabled状態のコントロールプレーンノードにスケジュールされる場合があります。このコマンドが失敗する場合 (クラスターで Pod をスケジュールできない場合など)、
oc adm inspectコマンドを使用して、特定リソースに関する情報を収集します。注記収集する推奨リソースは、Red Hat サポートにお問い合わせください。
作業ディレクトリーに作成された
must-gatherディレクトリーから圧縮ファイルを作成します。固有の must-gather データの日付とクラスター ID を必ず提供してください。クラスター ID を確認する方法の詳細は、How to find the cluster-id or name on OpenShift cluster を参照してください。たとえば、Linux オペレーティングシステムを使用するコンピューターで以下のコマンドを実行します。$ tar cvaf must-gather-`date +"%m-%d-%Y-%H-%M-%S"`-<cluster_id>.tar.gz <must_gather_local_dir>1 - 1
<must_gather_local_dir>は、実際のディレクトリー名に置き換えます。
- Red Hat カスタマーポータルの カスタマーサポート ページ で、圧縮ファイルをサポートケースに添付します。
6.1.2. must-gather フラグ
次の表にリストされているフラグは、oc adm must-gather コマンドで使用できます。
| フラグ | コマンドの例 | 説明 |
|---|---|---|
|
|
|
クラスター上の、 |
|
|
| 収集されたデータが書き込まれるローカルマシン上の特定のディレクトリーを設定します。 |
|
|
|
|
|
|
|
実行する |
|
|
|
実行する |
|
|
| 使用する特定のノードを設定します。指定しない場合は、デフォルトでランダムマスターが使用されます。 |
|
|
| 使用する特定のノードセレクターを設定します。クラスターノードのセットで同時にデータをキャプチャーする必要があるコマンドとイメージを指定する場合にのみ関連します。 |
|
|
|
|
|
|
|
指定された期間よりも新しいログのみを返します。デフォルトはすべてのログです。プラグインが推奨されますが、このサポートには必要はありません。 |
|
|
|
(RFC3339) 形式で表現された特定の日時以降のログのみを返します。デフォルトはすべてのログです。プラグインが推奨されますが、このサポートには必要はありません。 |
|
|
| 収集したデータをコピーする Pod 上の特定のディレクトリーを設定します。 |
|
|
| タイムアウトする前にデータを収集する時間の長さ。秒、分、時間で表されます (例: 3s、5m、2h)。指定する時間は 0 より大きい必要があります。指定されていない場合はデフォルトで 10 分になります。 |
|
|
|
|
6.1.3. 特定の機能に関するデータ収集
oc adm must-gather CLI コマンドを --image または --image-stream 引数と共に使用して、特定に機能に関するデバッグ情報を収集できます。must-gather ツールは複数のイメージをサポートするため、単一のコマンドを実行して複数の機能に関するデータを収集できます。
| イメージ | 目的 |
|---|---|
|
| OpenShift Virtualization のデータ収集。 |
|
| OpenShift Serverless のデータ収集。 |
|
| Red Hat OpenShift Service Mesh のデータ収集。 |
|
| Hosted Control Plane のデータ収集。 |
|
| Migration Toolkit for Containers のデータ収集。 |
|
| Red Hat OpenShift Data Foundation のデータ収集。 |
|
| ロギング用のデータ収集。 |
|
| Network Observability Operator のデータ収集。 |
|
| ローカルストレージ Operator のデータ収集。 |
|
| OpenShift サンドボックスコンテナーのデータ収集。 |
|
| Red Hat Workload Availability Operator のデータ収集。これには、Self Node Remediation (SNR) Operator、Fence Agents Remediation (FAR) Operator、Machine Deletion Remediation (MDR) Operator、Node Health Check (NHC) Operator、および Node Maintenance Operator (NMO) が含まれます。 NHC Operator バージョンが 0.9.0 より前 の場合は、このイメージを使用します。 詳細は、修復、フェンシング、およびメンテナンス (Workload Availability for Red Hat OpenShift ドキュメント) の各 Operator の「データの収集」セクションを参照してください。 |
|
| Red Hat Workload Availability Operator のデータ収集。これには、Self Node Remediation (SNR) Operator、Fence Agents Remediation (FAR) Operator、Machine Deletion Remediation (MDR) Operator、Node Health Check (NHC) Operator、および Node Maintenance Operator (NMO) が含まれます。 NHC Operator バージョンが 0.9.0 以降 の場合は、このイメージを使用します。 詳細は、修復、フェンシング、およびメンテナンス (Workload Availability for Red Hat OpenShift ドキュメント) の各 Operator の「データの収集」セクションを参照してください。 |
|
| NUMA Resources Operator (NRO) のデータ収集。 |
|
| PTP Operator のデータ収集。 |
|
| Red Hat OpenShift GitOps のデータ収集。 |
|
| Secrets Store CSI Driver Operator のデータ収集。 |
|
| LVM Operator のデータ収集。 |
|
| Compliance Operator のデータ収集。 |
Red Hat OpenShift Service on AWS コンポーネントのイメージの最新バージョンを確認するには、Red Hat カスタマーポータルの OpenShift Operator ライフサイクル Web ページを参照してください。
前提条件
-
cluster-adminロールを持つユーザーとしてクラスターにアクセスできる。 -
Red Hat OpenShift Service on AWS CLI (
oc) がインストールされている。
手順
-
must-gatherデータを保存するディレクトリーに移動します。 oc adm must-gatherコマンドを 1 つまたは複数の--imageまたは--image-stream引数と共に実行します。注記-
特定の機能データに加えてデフォルトの
must-gatherデータを収集するには、--image-stream=openshift/must-gather引数を追加します。 - Custom Metrics Autoscaler に関するデータの収集は、以下の関連情報セクションを参照してください。
たとえば、以下のコマンドは、デフォルトのクラスターデータと OpenShift Virtualization に固有の情報の両方を収集します。
$ oc adm must-gather \
  --image-stream=openshift/must-gather \
1 --image=registry.redhat.io/container-native-virtualization/cnv-must-gather-rhel9:v4.20.12 must-gatherツールを追加の引数と共に使用し、OpenShift Logging およびクラスター内の Red Hat OpenShift Logging Operator に関連するデータを収集できます。OpenShift Logging の場合、以下のコマンドを実行します。$ oc adm must-gather --image=$(oc -n openshift-logging get deployment.apps/cluster-logging-operator \ -o jsonpath='{.spec.template.spec.containers[?(@.name == "cluster-logging-operator")].image}')例6.1 OpenShift Logging の
must-gatherの出力例├── cluster-logging │ ├── clo │ │ ├── cluster-logging-operator-74dd5994f-6ttgt │ │ ├── clusterlogforwarder_cr │ │ ├── cr │ │ ├── csv │ │ ├── deployment │ │ └── logforwarding_cr │ ├── collector │ │ ├── fluentd-2tr64 │ ├── eo │ │ ├── csv │ │ ├── deployment │ │ └── elasticsearch-operator-7dc7d97b9d-jb4r4 │ ├── es │ │ ├── cluster-elasticsearch │ │ │ ├── aliases │ │ │ ├── health │ │ │ ├── indices │ │ │ ├── latest_documents.json │ │ │ ├── nodes │ │ │ ├── nodes_stats.json │ │ │ └── thread_pool │ │ ├── cr │ │ ├── elasticsearch-cdm-lp8l38m0-1-794d6dd989-4jxms │ │ └── logs │ │ ├── elasticsearch-cdm-lp8l38m0-1-794d6dd989-4jxms │ ├── install │ │ ├── co_logs │ │ ├── install_plan │ │ ├── olmo_logs │ │ └── subscription │ └── kibana │ ├── cr │ ├── kibana-9d69668d4-2rkvz ├── cluster-scoped-resources │ └── core │ ├── nodes │ │ ├── ip-10-0-146-180.eu-west-1.compute.internal.yaml │ └── persistentvolumes │ ├── pvc-0a8d65d9-54aa-4c44-9ecc-33d9381e41c1.yaml ├── event-filter.html ├── gather-debug.log └── namespaces ├── openshift-logging │ ├── apps │ │ ├── daemonsets.yaml │ │ ├── deployments.yaml │ │ ├── replicasets.yaml │ │ └── statefulsets.yaml │ ├── batch │ │ ├── cronjobs.yaml │ │ └── jobs.yaml │ ├── core │ │ ├── configmaps.yaml │ │ ├── endpoints.yaml │ │ ├── events │ │ │ ├── elasticsearch-im-app-1596020400-gm6nl.1626341a296c16a1.yaml │ │ │ ├── elasticsearch-im-audit-1596020400-9l9n4.1626341a2af81bbd.yaml │ │ │ ├── elasticsearch-im-infra-1596020400-v98tk.1626341a2d821069.yaml │ │ │ ├── elasticsearch-im-app-1596020400-cc5vc.1626341a3019b238.yaml │ │ │ ├── elasticsearch-im-audit-1596020400-s8d5s.1626341a31f7b315.yaml │ │ │ ├── elasticsearch-im-infra-1596020400-7mgv8.1626341a35ea59ed.yaml │ │ ├── events.yaml │ │ ├── persistentvolumeclaims.yaml │ │ ├── pods.yaml │ │ ├── replicationcontrollers.yaml │ │ ├── secrets.yaml │ │ └── services.yaml │ ├── openshift-logging.yaml │ ├── pods │ │ ├── cluster-logging-operator-74dd5994f-6ttgt │ │ │ ├── cluster-logging-operator │ │ │ │ └── cluster-logging-operator │ │ │ │ └── logs │ │ │ │ ├── current.log │ │ │ │ ├── previous.insecure.log │ │ │ │ └── previous.log │ │ │ └── cluster-logging-operator-74dd5994f-6ttgt.yaml │ │ ├── cluster-logging-operator-registry-6df49d7d4-mxxff │ │ │ ├── cluster-logging-operator-registry │ │ │ │ └── cluster-logging-operator-registry │ │ │ │ └── logs │ │ │ │ ├── current.log │ │ │ │ ├── previous.insecure.log │ │ │ │ └── previous.log │ │ │ ├── cluster-logging-operator-registry-6df49d7d4-mxxff.yaml │ │ │ └── mutate-csv-and-generate-sqlite-db │ │ │ └── mutate-csv-and-generate-sqlite-db │ │ │ └── logs │ │ │ ├── current.log │ │ │ ├── previous.insecure.log │ │ │ └── previous.log │ │ ├── elasticsearch-cdm-lp8l38m0-1-794d6dd989-4jxms │ │ ├── elasticsearch-im-app-1596030300-bpgcx │ │ │ ├── elasticsearch-im-app-1596030300-bpgcx.yaml │ │ │ └── indexmanagement │ │ │ └── indexmanagement │ │ │ └── logs │ │ │ ├── current.log │ │ │ ├── previous.insecure.log │ │ │ └── previous.log │ │ ├── fluentd-2tr64 │ │ │ ├── fluentd │ │ │ │ └── fluentd │ │ │ │ └── logs │ │ │ │ ├── current.log │ │ │ │ ├── previous.insecure.log │ │ │ │ └── previous.log │ │ │ ├── fluentd-2tr64.yaml │ │ │ └── fluentd-init │ │ │ └── fluentd-init │ │ │ └── logs │ │ │ ├── current.log │ │ │ ├── previous.insecure.log │ │ │ └── previous.log │ │ ├── kibana-9d69668d4-2rkvz │ │ │ ├── kibana │ │ │ │ └── kibana │ │ │ │ └── logs │ │ │ │ ├── current.log │ │ │ │ ├── previous.insecure.log │ │ │ │ └── previous.log │ │ │ ├── kibana-9d69668d4-2rkvz.yaml │ │ │ └── kibana-proxy │ │ │ └── kibana-proxy │ │ │ └── logs │ │ │ ├── current.log │ │ │ ├── previous.insecure.log │ │ │ └── previous.log │ └── route.openshift.io │ └── routes.yaml └── openshift-operators-redhat ├── ...-
特定の機能データに加えてデフォルトの
oc adm must-gatherコマンドを 1 つまたは複数の--imageまたは--image-stream引数と共に実行します。たとえば、以下のコマンドは、デフォルトのクラスターデータと KubeVirt に固有の情報の両方を収集します。$ oc adm must-gather \ --image-stream=openshift/must-gather \1 --image=quay.io/kubevirt/must-gather2 作業ディレクトリーに作成された
must-gatherディレクトリーから圧縮ファイルを作成します。固有の must-gather データの日付とクラスター ID を必ず提供してください。クラスター ID を確認する方法の詳細は、How to find the cluster-id or name on OpenShift cluster を参照してください。たとえば、Linux オペレーティングシステムを使用するコンピューターで以下のコマンドを実行します。$ tar cvaf must-gather-`date +"%m-%d-%Y-%H-%M-%S"`-<cluster_id>.tar.gz <must_gather_local_dir>1 - 1
<must_gather_local_dir>は、実際のディレクトリー名に置き換えます。
- Red Hat カスタマーポータルの カスタマーサポート ページ で、圧縮ファイルをサポートケースに添付します。
6.1.4. ネットワークログの収集
クラスター内のすべてのノードでネットワークログを収集できます。
手順
-- gather_network_logsを指定してoc adm must-gatherコマンドを実行します。$ oc adm must-gather -- gather_network_logs注記デフォルトでは、
must-gatherツールはクラスター内のすべてのノードから OVNnbdbおよびsbdbデータベースを収集します。OVNnbdbデータベースの OVN-Kubernetes トランザクションを含む追加のログを含めるには、-- gather_network_logsオプションを追加します。作業ディレクトリーに作成された
must-gatherディレクトリーから圧縮ファイルを作成します。固有の must-gather データの日付とクラスター ID を必ず提供してください。クラスター ID を確認する方法の詳細は、How to find the cluster-id or name on OpenShift cluster を参照してください。たとえば、Linux オペレーティングシステムを使用するコンピューターで以下のコマンドを実行します。$ tar cvaf must-gather-`date +"%m-%d-%Y-%H-%M-%S"`-<cluster_id>.tar.gz <must_gather_local_dir>1 - 1
<must_gather_local_dir>は、実際のディレクトリー名に置き換えます。
- Red Hat カスタマーポータルの カスタマーサポート ページ で、圧縮ファイルをサポートケースに添付します。
6.1.5. must-gather ストレージ制限の変更
oc adm must-gather コマンドを使用してデータを収集する場合、情報のデフォルトの最大ストレージは、コンテナーのストレージ容量の 30% です。30% の制限に達すると、コンテナーが強制終了し、収集プロセスが停止します。すでに収集された情報は、ローカルストレージにダウンロードされます。must-gather コマンドを再度実行するには、ストレージ容量がより大きなコンテナーを使用するか、最大ボリュームの割合を調整する必要があります。
コンテナーがストレージ制限に達すると、次の例のようなエラーメッセージが生成されます。
出力例
Disk usage exceeds the volume percentage of 30% for mounted directory. Exiting...前提条件
-
cluster-adminロールを持つユーザーとしてクラスターにアクセスできる。 -
OpenShift CLI (
oc) がインストールされている。
手順
volume-percentageフラグを指定してoc adm must-gatherコマンドを実行します。新しい値として 100 を超える値を指定することはできません。$ oc adm must-gather --volume-percentage <storage_percentage>
6.2. Support Log Gather について
Support Log Gather Operator は、従来の must-gather ツールの機能に基づいて構築され、デバッグデータの収集を自動化します。収集された情報を単一の .tar ファイルにパッケージ化し、指定された Red Hat サポートケースに自動的にアップロードすることで、トラブルシューティングを効率化します。
サポート対象かどうかサポートログ収集は、テクノロジープレビュー機能です。テクノロジープレビュー機能は、Red Hat 製品のサービスレベルアグリーメント (SLA) の対象外であり、機能的に完全ではないことがあります。Red Hat は、実稼働環境でこれらを使用することを推奨していません。テクノロジープレビュー機能は、最新の製品機能をいち早く提供して、開発段階で機能のテストを行い、フィードバックを提供していただくことを目的としています。
Red Hat のテクノロジープレビュー機能のサポート範囲に関する詳細は、テクノロジープレビュー機能のサポート範囲 を参照してください。
Support Log Gather の主な機能は次のとおりです。
- 管理者特権は不要: 昇格権限を必要とせずにログを収集およびアップロードできるため、管理者以外のユーザーがセキュアにより簡単にデータを収集できます。
- 簡素化されたログ収集: リソース定義やサービスログなどのデバッグデータをクラスターから収集します。
-
設定可能なデータアップロード:
.tarファイルをサポートケースに自動的にアップロードするか、ローカルに保存して手動でアップロードするかを設定するオプションを提供します。
6.2.1. Web コンソールを使用して Support Log Gather をインストールする
Web コンソールを使用して Support Log Gather をインストールできます。
サポート対象かどうかサポートログ収集は、テクノロジープレビュー機能です。テクノロジープレビュー機能は、Red Hat 製品のサービスレベルアグリーメント (SLA) の対象外であり、機能的に完全ではないことがあります。Red Hat は、実稼働環境でこれらを使用することを推奨していません。テクノロジープレビュー機能は、最新の製品機能をいち早く提供して、開発段階で機能のテストを行い、フィードバックを提供していただくことを目的としています。
Red Hat のテクノロジープレビュー機能のサポート範囲に関する詳細は、テクノロジープレビュー機能のサポート範囲 を参照してください。
前提条件
-
cluster-admin権限でクラスターにアクセスできる。 - Red Hat OpenShift Service on AWS Web コンソールにアクセスできる。
手順
- Red Hat OpenShift Service on AWS Web コンソールにログインします。
- Ecosystem → Software Catalog に移動します。
- フィルターボックスに Support Log Gather と入力します。
- Support Log Gather を選択します。
- Version リストから Support Log Gather バージョンを選択し、Install をクリックします。
Install Operator ページで、インストール設定を設定します。
Operator の Installed Namespace を選択します。
デフォルトの Operator namespace は
must-gather-operatorです。must-gather-operatornamespace が存在しない場合は自動的に作成されます。Update approval ストラテジーを選択します。
- 新しいバージョンが利用可能になったときに Operator Lifecycle Manager (OLM) が Operator を自動的に更新するようにするには、Automatic を選択します。
- 適切な認証情報を持つユーザーによって Operator の更新が承認される必要がある場合は、Manual を選択します。
- Install をクリックします。
検証
Operator が正常にインストールされていることを確認します。
- Ecosystem → Software Catalog に移動します。
-
Support Log Gather が
must-gather-operatornamespace に Succeeded の Status でリストされていることを確認します。
Support Log Gather Pod が実行されていることを確認します。
- Workloads → Pods に移動します。
Support Log Gather Pod のステータスが Running であることを確認します。
Support Log Gather は、Pod を起動して実行した後にのみ使用できます。
6.2.2. CLI を使用して Support Log Gather をインストールする
コマンドラインインターフェイス (CLI) から Support Log Gather をインストールして、サポートケースの自動ログ収集を有効にできます。
サポート対象かどうかサポートログ収集は、テクノロジープレビュー機能です。テクノロジープレビュー機能は、Red Hat 製品のサービスレベルアグリーメント (SLA) の対象外であり、機能的に完全ではないことがあります。Red Hat は、実稼働環境でこれらを使用することを推奨していません。テクノロジープレビュー機能は、最新の製品機能をいち早く提供して、開発段階で機能のテストを行い、フィードバックを提供していただくことを目的としています。
Red Hat のテクノロジープレビュー機能のサポート範囲に関する詳細は、テクノロジープレビュー機能のサポート範囲 を参照してください。
前提条件
-
cluster-admin権限でクラスターにアクセスできる。
手順
次のコマンドを実行して、
must-gather-operatorという名前の新しいプロジェクトを作成します。$ oc new-project must-gather-operatorOperatorGroupオブジェクトを作成します。OperatorGroupオブジェクトを定義する YAML ファイル (例:operatorGroup.yaml) を作成します。apiVersion: operators.coreos.com/v1 kind: OperatorGroup metadata: name: must-gather-operator namespace: must-gather-operator spec: {}以下のコマンドを実行して
OperatorGroupオブジェクトを作成します。$ oc create -f operatorGroup.yaml
Subscriptionオブジェクトを作成します。Subscriptionオブジェクトを定義する YAML ファイル (例:subscription.yaml) を作成します。apiVersion: operators.coreos.com/v1alpha1 kind: Subscription metadata: name: support-log-gather-operator namespace: must-gather-operator spec: channel: tech-preview name: support-log-gather-operator source: redhat-operators sourceNamespace: openshift-marketplace installPlanApproval: Automatic以下のコマンドを実行して
Subscriptionオブジェクトを作成します。$ oc create -f subscription.yaml
検証
次のコマンドを実行して、Operator namespace 内の Pod のステータスを確認します。
$ oc get pods出力例
NAME                                                              READY   STATUS      RESTARTS   AGE
must-gather-operator-657fc74d64-2gg2w                             1/1     Running     0          13m
すべての Pod のステータスは
Runningである必要があります。次のコマンドを実行して、サブスクリプションが作成されたことを確認します。
$ oc get subscription -n must-gather-operator出力例
NAME                          PACKAGE                       SOURCE            CHANNEL
support-log-gather-operator   support-log-gather-operator   redhat-operators  tech-preview
次のコマンドを実行して、Operator がインストールされていることを確認します。
$ oc get csv -n must-gather-operator出力例
NAME                                  DISPLAY                VERSION   REPLACES   PHASE
support-log-gather-operator.v4.20.0   support log gather     4.20.0               Succeeded
6.2.3. Support Log Gather インスタンスの設定
クラスターからの診断データの収集を自動化するには、コマンドラインインターフェイス (CLI) から MustGather カスタムリソース (CR) を作成する必要があります。このプロセスでは、データが Red Hat サポートケースにも自動的にアップロードされます。
サポート対象かどうかサポートログ収集は、テクノロジープレビュー機能です。テクノロジープレビュー機能は、Red Hat 製品のサービスレベルアグリーメント (SLA) の対象外であり、機能的に完全ではないことがあります。Red Hat は、実稼働環境でこれらを使用することを推奨していません。テクノロジープレビュー機能は、最新の製品機能をいち早く提供して、開発段階で機能のテストを行い、フィードバックを提供していただくことを目的としています。
Red Hat のテクノロジープレビュー機能のサポート範囲に関する詳細は、テクノロジープレビュー機能のサポート範囲 を参照してください。
前提条件
-
OpenShift CLI (
oc) ツールがインストールされている。 - クラスターに Support Log Gather がインストールされている。
- Red Hat サポートケース ID がある。
- Red Hat お客様ポータルの認証情報を含む Kubernetes シークレットを作成した。シークレットには、ユーザー名フィールドとパスワードフィールドが含まれている必要があります。
- サービスアカウントを作成している。
手順
次の基本設定を含む、
MustGatherCR の YAML ファイル (support-log-gather.yamlなど) を作成します。support-log-gather.yamlの例apiVersion: operator.openshift.io/v1alpha1 kind: MustGather metadata: name: example-mg namespace: must-gather-operator spec: serviceAccountName: must-gather-operator audit: true proxyConfig: httpProxy: "http://proxy.example.com:8080" httpsProxy: "https://proxy.example.com:8443" noProxy: ".example.com,localhost" mustGatherTimeout: "1h30m9s" uploadTarget: type: SFTP sftp: caseID: "04230315" caseManagementAccountSecretRef: name: mustgather-creds host: "sftp.access.redhat.com" retainResourcesOnCompletion: true storage: type: PersistentVolume persistentVolume: claim: name: mustgather-pvc subPath: must-gather-bundles/case-04230315設定パラメーターの詳細は、「MustGather カスタムリソースの設定パラメーター」を参照してください。
次のコマンドを実行して
MustGatherオブジェクトを作成します。$ oc create -f support-log-gather.yaml
検証
次のコマンドを実行して、
MustGatherCR が作成されたことを確認します。$ oc get mustgather出力例
NAME          AGE
example-mg    7s
次のコマンドを実行して、Operator namespace 内の Pod のステータスを確認します。
$ oc get pods出力例
NAME READY STATUS RESTARTS AGE must-gather-operator-657fc74d64-2gg2w 1/1 Running 0 13m example-mg-gk8m8 2/2 Running 0 13sMustGatherCR に基づいた名前を指定した Pod を新規作成する必要があります。すべての Pod のステータスはRunningである必要があります。ファイルのアップロードの進行状況を監視するには、次のコマンドを実行して、ジョブ Pod 内のアップロードコンテナーのログを表示します。
oc logs -f pod/example-mg-gk8m8 -c upload成功した場合、プロセスはアーカイブを作成し、指定されたケースの Red Hat Secure File Transfer Protocol (SFTP) サーバーにアップロードする必要があります。
6.2.4. MustGather カスタムリソースの設定パラメーター
データ収集とアップロードプロセスのパラメーターを指定する YAML ファイルを作成することで、MustGather カスタムリソース (CR) を管理できます。次の表は、MustGather CR で設定できるパラメーターの概要を示しています。
| パラメーター名 | 説明 | 種類 |
|---|---|---|
|
|
オプション: 監査ログを収集するかどうかを指定します。有効な値は |
|
|
|
オプション: |
値は時間単位を持つ浮動小数点数である必要があります。有効な単位は |
|
| オプション: 使用するプロキシー設定を定義します。デフォルト値は、クラスターレベルのプロキシー設定に設定されています。 |
|
|
| HTTP リクエストのプロキシーの URL を指定します。 | URL |
|
| HTTPS リクエストのプロキシーの URL を指定します。 | |
|
| プロキシーを使用してはならないドメインのコンマ区切りリストを指定します。 | URL のリスト |
|
|
オプション: データ収集の完了後に、 |
|
|
|
オプション: サービスアカウントの名前を指定します。デフォルト値は |
|
|
|
オプション: |
|
|
| 永続ボリュームの詳細を定義します。 |
|
|
| 永続ボリューム要求 (PVC) の詳細を定義します。 |
|
|
| ストレージに使用する PVC の名前を指定します。 |
|
|
| オプション: バンドルを保存するための PVC 内のパスを指定します。 |
|
|
|
ストレージのタイプを定義します。サポートされている値は |
|
|
|
オプション: |
|
|
|
オプション: バンドルのアップロード先のサーバーを指定します。デフォルトでは、バンドルは |
デフォルトでは、バンドルは |
|
| 診断データが収集される Red Hat サポートケース ID を指定します。 |
|
|
|
Red Hat カスタマーポータルサポートケースへのファイルの認証とアップロードに必要な認証情報を定義します。値には |
|
|
| 認証情報を含む Kubernetes シークレットの名前を指定します。 |
|
|
|
オプション: |
|
|
|
|
|
spec.uploadTarget または spec.storage を指定しない場合、Pod はデータを一時ボリュームに保存し、Pod が終了するとデータは完全に削除されます。
6.2.5. Support Log Gather のアンインストール
Web コンソールを使用して Support Log Gather をアンインストールできます。
前提条件
-
cluster-admin権限でクラスターにアクセスできる。 - Red Hat OpenShift Service on AWS Web コンソールにアクセスできる。
- Support Log Gather がインストールされている。
手順
- Red Hat OpenShift Service on AWS Web コンソールにログインします。
Support Log Gather Operator をアンインストールします。
- Ecosystem → Installed Operators に移動します。
-
Support Log Gather エントリーの横にある Options メニュー
をクリックして Uninstall Operator をクリックします。
- 確認ダイアログで、Uninstall をクリックします。
6.2.6. Support Log Gather リソースの削除
Support Log Gather をアンインストールしたら、クラスターから関連リソースを削除できます。
前提条件
-
cluster-admin権限でクラスターにアクセスできる。 - Red Hat OpenShift Service on AWS Web コンソールにアクセスできる。
手順
- Red Hat OpenShift Service on AWS Web コンソールにログインします。
must-gather-operator namespace 内のコンポーネントのデプロイメントを削除します。
- Project ドロップダウンメニューをクリックして、利用可能なすべてのプロジェクトのリストを表示し、must-gather-operator プロジェクトを選択します。
- Workloads → Deployments に移動します。
- 削除するデプロイメントを選択します。
- Actions ドロップダウンメニューをクリックし、Delete Deployment を選択します。
- 確認ダイアログボックスで、Delete をクリックしてデプロイメントを削除します。
または、コマンドラインインターフェイス (CLI) を使用して、
must-gather-operatornamespace にあるコンポーネントのデプロイメントを削除します。$ oc delete deployment -n must-gather-operator -l operators.coreos.com/support-log-gather-operator.must-gather-operator
オプション: Support Log Gather によってインストールされたカスタムリソース定義 (CRD) を削除します。
- Administration → CustomResourceDefinitions に移動します。
-
CRD をフィルタリングするには、Name フィールドに
MustGatherと入力します。 次の各 CRD の横にある Options メニュー
をクリックし、Delete Custom Resource Definition を選択します。
-
MustGather
-
オプション:
must-gather-operatornamespace を削除します。- Administration → Namespaces に移動します。
-
must-gather-operator の横にある Options メニュー
をクリックし、Delete Namespace を選択します。
-
確認ダイアログボックスで
must-gather-operatorと入力し、Delete をクリックします。
6.3. クラスター ID の取得
Red Hat サポートに情報を提供する際には、クラスターに固有の識別子を提供していただくと役に立ちます。Red Hat OpenShift Service on AWS Web コンソールを使用して、クラスター ID を自動入力できます。Web コンソールまたは OpenShift CLI (oc) を使用してクラスター ID を手動で取得することもできます。
前提条件
-
cluster-adminロールを持つユーザーとしてクラスターにアクセスできる。 -
Web コンソールまたはインストールされている OpenShift CLI (
oc) にアクセスできる。
手順
Web コンソールを使用してクラスター ID を手動で取得するには、以下を実行します。
- Home → Overview に移動します。
- 値は Details セクションの Cluster ID フィールドで利用できます。
OpenShift CLI (
oc) を使用してクラスター ID を取得するには、以下のコマンドを実行します。$ oc get clusterversion -o jsonpath='{.items[].spec.clusterID}{"\n"}'
6.4. クラスターノードジャーナルログのクエリー
個別のクラスターノードの /var/log 内で journald ユニットログおよびその他のログを収集できます。
前提条件
-
cluster-adminロールを持つユーザーとしてクラスターにアクセスできる。 -
OpenShift CLI (
oc) がインストールされている。
手順
Red Hat OpenShift Service on AWS クラスターから
kubeletjournaldユニットのログを照会します。次の例では、ワーカーノードのみを照会します。$ oc adm node-logs --role=worker -u kubelet-
kubelet: 他のユニットのログを照会するには、必要に応じて置き換えます。
6.5. ネットワークトレースメソッド
パケットキャプチャーレコードの形式でネットワークトレースを収集すると、Red Hat がネットワークの問題のトラブルシューティングをサポートできます。
Red Hat OpenShift Service on AWS は、ネットワークトレースを実行する 2 つの方法をサポートしています。以下の表を確認し、ニーズに合った方法を選択します。
| メソッド | 利点および機能 |
|---|---|
| ホストのネットワークトレースの収集 | 1 つ以上のノードで同時に指定する期間で、パケットキャプチャーを実行します。パケットキャプチャーファイルは、指定した期間に達すると、ノードからクライアントマシンに転送されます。 特定のアクションが原因でネットワーク通信に問題を発生される理由をトラブルシューティングでいます。パケットキャプチャーを実行し、問題を発生させるアクションを実行してログで問題を診断します。 |
| Red Hat OpenShift Service on AWS ノードまたはコンテナーからネットワークトレースを収集する |
1 つのノードまたは 1 つのコンテナーでパケットキャプチャーを実行します。パケットキャプチャーの期間を制御できるように パケットキャプチャーを手動で開始し、ネットワーク通信の問題をトリガーしてから、パケットキャプチャーを手動で停止できます。
この方法では、 |
6.6. ホストのネットワークトレースの収集
ネットワーク関連の問題のトラブルシューティングは、ネットワーク通信を追跡して複数のノードで同時にパケットをキャプチャーすることで簡素化されます。
oc adm must-gather コマンドおよび registry.redhat.io/openshift4/network-tools-rhel8 コンテナーイメージの組み合わせを使用して、ノードからパケットキャプチャーを収集できます。パケットキャプチャーの分析は、ネットワーク通信の問題のトラブルシューティングに役立ちます。
oc adm must-gather コマンドは、特定のノードの Pod で tcpdump コマンドの実行に使用されます。tcpdump コマンドは、Pod でキャプチャーされたパケットを記録します。tcpdump コマンドを終了すると、oc adm must-gather コマンドは、Pod からクライアントマシンにキャプチャーされたパケットが含まれるファイルを転送します。
以下の手順で使用するコマンド例は、tcpdump コマンドを使用してパケットキャプチャーを実行する方法を示しています。ただし、--image 引数で指定したコンテナーイメージでコマンドを実行すると、複数のノードから同時にトラブルシューティング情報を収集できます。
前提条件
-
cluster-adminロールを持つユーザーとして Red Hat OpenShift Service on AWS にログインしている。 -
OpenShift CLI (
oc) がインストールされている。
手順
以下のコマンドを実行して、一部のノードでホストネットワークからパケットキャプチャーを実行します。
$ oc adm must-gather \
    --dest-dir /tmp/captures \// <.>
    --source-dir '/tmp/tcpdump/' \// <.>
    --image registry.redhat.io/openshift4/network-tools-rhel8:latest \// <.>
    --node-selector 'node-role.kubernetes.io/worker' \// <.>
    --host-network=true \// <.>
    --timeout 30s \// <.>
    -- \
    tcpdump -i any \// <.>
    -w /tmp/tcpdump/%Y-%m-%dT%H:%M:%S.pcap -W 1 -G 300
<.>
--dest-dir引数では、oc adm must-gatherの実行時に、クライアントマシンの/tmp/capturesと相対パスにあるディレクトリーに、キャプチャーしたパケットを保存することを指定します。書き込み可能な任意のディレクトリーを指定できます。<.>oc adm must-gatherが開始するデバッグ Pod でtcpdumpが実行される場合に、--source-dir引数は、パケットキャプチャーが Pod の/tmp/tcpdumpディレクトリーに一時的に保存されることを指定します。<.>--image引数は、tcpdumpコマンドを含むコンテナーイメージを指定します。<.>--node-selector引数とサンプル値は、ワーカーノードでパケットキャプチャーを実行するように指定します。別の方法としては、代わりに--node-name引数を指定して、1 つのノードでパケットキャプチャーを実行できます。--node-selectorと--node-name引数の両方を省略すると、すべてのノードでパケットキャプチャーが実行されます。<.> ノードのネットワークインターフェイスでパケットキャプチャーが実行されるように、--host-network=true引数が必要です。<.>--timeout引数と値は、デバッグ Pod を 30 秒間実行するように指定します。--timeout引数と期間を指定しない場合、デバッグ Pod は 10 分間実行されます。<.>tcpdumpコマンドの-i any引数は、すべてのネットワークインターフェイスでパケットをキャプチャーするように指定します。また、ネットワークインターフェイス名を指定することもできます。- ネットワークトレースがパケットをキャプチャーしている間に、ネットワーク通信の問題を発生させる、Web アプリケーションにアクセスするなど、特定のアクションを実行します。
oc adm must-gatherで Pod からクライアントマシンに転送したパケットキャプチャーファイルを確認します。tmp/captures ├── event-filter.html ├── ip-10-0-192-217-ec2-internal1 │ └── registry-redhat-io-openshift4-network-tools-rhel8-sha256-bca... │ └── 2022-01-13T19:31:31.pcap ├── ip-10-0-201-178-ec2-internal2 │ └── registry-redhat-io-openshift4-network-tools-rhel8-sha256-bca... │ └── 2022-01-13T19:31:30.pcap ├── ip-... └── timestamp
6.7. Red Hat OpenShift Service on AWS ノードまたはコンテナーからネットワークトレースを収集する
ネットワーク関連の Red Hat OpenShift Service on AWS の潜在的な問題を調査する際に、Red Hat サポートは特定の Red Hat OpenShift Service on AWS クラスターノードまたは特定のコンテナーからネットワークパケットトレースを要求する可能性があります。Red Hat OpenShift Service on AWS でネットワークトレースをキャプチャーする方法として、デバッグ Pod を使用できます。
前提条件
-
cluster-adminロールを持つユーザーとしてクラスターにアクセスできる。 -
OpenShift CLI (
oc) がインストールされている。 - 既存の Red Hat サポートケース ID がある。
手順
クラスターノードのリストを取得します。
$ oc get nodesターゲットノードのデバッグセッションに入ります。この手順は、
<node_name>-debugというデバッグ Pod をインスタンス化します。$ oc debug node/my-cluster-node/hostをデバッグシェル内の root ディレクトリーとして設定します。デバッグ Pod は、Pod 内の/hostにホストの root ファイルシステムをマウントします。root ディレクトリーを/hostに変更すると、ホストの実行パスに含まれるバイナリーを実行できます。# chroot /hostchroot環境コンソール内から、ノードのインターフェイス名を取得します。# ip adsosreportを実行するために必要なバイナリーおよびプラグインが含まれるtoolboxコンテナーを起動します。# toolbox注記既存の
toolboxPod がすでに実行されている場合、toolboxコマンドは以下を出力します。'toolbox-' already exists. Trying to start…。tcpdumpの問題を回避するために、podman rm toolbox-を使用して実行中のツールボックスコンテナーを削除し、新しいツールボックスコンテナーを生成してください。クラスターノードで
tcpdumpセッションを開始し、出力をキャプチャーファイルにリダイレクトします。この例では、ens5をインターフェイス名として使用します。$ tcpdump -nn -s 0 -i ens5 -w /host/var/tmp/my-cluster-node_$(date +%d_%m_%Y-%H_%M_%S-%Z).pcap1 - 1
- toolbox コンテナーはホストの root ディレクトリーを
/hostにマウントするため、tcpdumpキャプチャーファイルのパスはchroot環境外にあります。
ノード上の特定コンテナーに
tcpdumpキャプチャーが必要な場合は、以下の手順に従います。ターゲットコンテナー ID を確認します。toolbox コンテナーはホストの root ディレクトリーを
/hostにマウントするため、この手順では、chroot hostコマンドがcrictlコマンドの前に実行されます。# chroot /host crictl psコンテナーのプロセス ID を確認します。この例では、コンテナー ID は
a7fe32346b120です。# chroot /host crictl inspect --output yaml a7fe32346b120 | grep 'pid' | awk '{print $2}'コンテナーで
tcpdumpセッションを開始し、出力をキャプチャーファイルにリダイレクトします。この例では、49628をコンテナーのプロセス ID として使用し、ens5をインターフェイス名として使用します。nsenterコマンドはターゲットプロセスの namespace に入り、その namespace でコマンドを実行します。この例ではターゲットプロセスがコンテナーのプロセス ID であるため、tcpdumpコマンドはホストからコンテナーの namespace で実行されます。# nsenter -n -t 49628 -- tcpdump -nn -i ens5 -w /host/var/tmp/my-cluster-node-my-container_$(date +%d_%m_%Y-%H_%M_%S-%Z).pcap1 - 1
- toolbox コンテナーはホストの root ディレクトリーを
/hostにマウントするため、tcpdumpキャプチャーファイルのパスはchroot環境外にあります。
以下の方法のいずれかを使用して、分析用に
tcpdumpキャプチャーファイルを Red Hat サポートに提供します。既存の Red Hat サポートケースにファイルをアップロードします。
oc debug node/<node_name>コマンドを実行してsosreportアーカイブを連結し、出力をファイルにリダイレクトします。このコマンドは、直前のoc debugセッションを終了していることを前提としています。$ oc debug node/my-cluster-node -- bash -c 'cat /host/var/tmp/my-tcpdump-capture-file.pcap' > /tmp/my-tcpdump-capture-file.pcap1 - 1
- デバッグコンテナーは、ホストの root ディレクトリーを
/hostにマウントします。連結のためにターゲットファイルを指定する際に、デバッグコンテナーの root ディレクトリー (/hostを含む) から絶対パスを参照します。
- Red Hat カスタマーポータルの Customer Support ページ にある既存のサポートケースに移動します。
- Attach files を選択し、プロンプトに従ってファイルをアップロードします。
6.8. Red Hat サポートへの診断データの提供
Red Hat OpenShift Service on AWS の問題を調査する場合は、Red Hat サポートからサポートケースに診断データをアップロードするように依頼されることがあります。Red Hat カスタマーポータルから、ファイルをサポートケースにアップロードできます。
前提条件
-
cluster-adminロールを持つユーザーとしてクラスターにアクセスできる。 -
OpenShift CLI (
oc) がインストールされている。 - 既存の Red Hat サポートケース ID がある。
手順
Red Hat カスタマーポータルから既存の Red Hat サポートケースに診断データをアップロードします。
oc debug node/<node_name>コマンドを使用して、Red Hat OpenShift Service on AWS に含まれる診断ファイルを連結し、出力をファイルにリダイレクトします。以下の例では、/host/var/tmp/my-diagnostic-data.tar.gzをデバッグコンテナーから/var/tmp/my-diagnostic-data.tar.gzにコピーします。$ oc debug node/my-cluster-node -- bash -c 'cat /host/var/tmp/my-diagnostic-data.tar.gz' > /var/tmp/my-diagnostic-data.tar.gz1 - 1
- デバッグコンテナーは、ホストの root ディレクトリーを
/hostにマウントします。連結のためにターゲットファイルを指定する際に、デバッグコンテナーの root ディレクトリー (/hostを含む) から絶対パスを参照します。
- Red Hat カスタマーポータルの Customer Support ページ にある既存のサポートケースに移動します。
- Attach files を選択し、プロンプトに従ってファイルをアップロードします。
6.9. toolbox について
toolbox は、Red Hat Enterprise Linux CoreOS (RHCOS) システムでコンテナーを起動するツールです。このツールは、主に sosreport などのコマンドの実行に必要なバイナリーおよびプラグインを含むコンテナーを起動するために使用されます。
toolbox コンテナーの主な目的は、診断情報を収集し、これを Red Hat サポートに提供することにあります。ただし、追加の診断ツールが必要な場合は、RPM パッケージを追加するか、標準のサポートツールイメージの代替イメージを実行することができます。
6.9.1. toolbox コンテナーへのパッケージのインストール
デフォルトでは、toolbox コマンドを実行すると、registry.redhat.io/rhel9/support-tools:latest イメージを使用してコンテナーが起動します。このイメージには、最も頻繁に使用されるサポートツールが含まれます。イメージの一部ではないサポートツールを必要とするノード固有のデータを収集する必要がある場合は、追加のパッケージをインストールできます。
前提条件
-
oc debug node/<node_name>コマンドでノードにアクセスしている。 - root 権限を持つユーザーとしてシステムにアクセスできる。
手順
/hostをデバッグシェル内の root ディレクトリーとして設定します。デバッグ Pod は、Pod 内の/hostにホストの root ファイルシステムをマウントします。root ディレクトリーを/hostに変更すると、ホストの実行パスに含まれるバイナリーを実行できます。# chroot /hosttoolbox コンテナーを起動します。
# toolboxwgetなどの追加のパッケージをインストールします。# dnf install -y <package_name>
6.9.2. toolbox を使用した代替イメージの起動
デフォルトでは、toolbox コマンドを実行すると、registry.redhat.io/rhel9/support-tools:latest イメージを使用してコンテナーが起動します。
.toolboxrc ファイルを作成し、実行するイメージを指定して代替イメージを起動できます。ただし、registry.redhat.io/rhel8/support-tools:latest など、古いバージョンの support-tools イメージの実行は、Red Hat OpenShift Service on AWS 4 ではサポートされていません。
前提条件
-
oc debug node/<node_name>コマンドでノードにアクセスしている。 - root 権限を持つユーザーとしてシステムにアクセスできる。
手順
/hostをデバッグシェル内の root ディレクトリーとして設定します。デバッグ Pod は、Pod 内の/hostにホストの root ファイルシステムをマウントします。root ディレクトリーを/hostに変更すると、ホストの実行パスに含まれるバイナリーを実行できます。# chroot /hostオプション: デフォルトのイメージの代わりに代替イメージを使用する必要がある場合は、root ユーザー ID のホームディレクトリーに
.toolboxrcファイルを作成し、イメージのメタデータを指定します。REGISTRY=quay.io1 IMAGE=fedora/fedora:latest2 TOOLBOX_NAME=toolbox-fedora-latest3 次のコマンドを入力して toolbox コンテナーを起動します。
# toolbox注記既存の
toolboxPod がすでに実行されている場合、toolboxコマンドは以下を出力します。'toolbox-' already exists. Trying to start…。sosreportプラグインの問題を回避するには、podman rm toolbox-を使用して実行中の toolbox コンテナーを削除し、新しい toolbox コンテナーを生成してください。
第7章 クラスター仕様の要約
7.1. クラスターバージョンオブジェクトを使用してクラスター仕様を要約する
clusterversion リソースをクエリーし、Red Hat OpenShift Service on AWS クラスター仕様の要約を取得できます。
前提条件
-
dedicated-adminロールを持つユーザーとしてクラスターにアクセスできる。 -
OpenShift CLI (
oc) がインストールされている。
手順
クラスターバージョン、可用性、アップタイム、および一般的なステータスのクエリーを実行します。
$ oc get clusterversion出力例
NAME      VERSION   AVAILABLE   PROGRESSING   SINCE   STATUS
version   4.13.8    True        False         8h      Cluster version is 4.13.8
クラスター仕様の詳細な要約、更新の可用性、および更新履歴を取得します。
$ oc describe clusterversion出力例
Name:         version
Namespace:
Labels:       <none>
Annotations:  <none>
API Version:  config.openshift.io/v1
Kind:         ClusterVersion
# ...
    Image:    quay.io/openshift-release-dev/ocp-release@sha256:a956488d295fe5a59c8663a4d9992b9b5d0950f510a7387dbbfb8d20fc5970ce
    URL:      https://access.redhat.com/errata/RHSA-2023:4456
    Version:  4.13.8
  History:
    Completion Time:    2023-08-17T13:20:21Z
    Image:              quay.io/openshift-release-dev/ocp-release@sha256:a956488d295fe5a59c8663a4d9992b9b5d0950f510a7387dbbfb8d20fc5970ce
    Started Time:       2023-08-17T12:59:45Z
    State:              Completed
    Verified:           false
    Version:            4.13.8
# ...
第8章 トラブルシューティング
8.1. クラスター通知の確認
クラスターの問題の解決を試みる際に、クラスター通知は有益な情報源となります。
クラスター通知は、クラスターのステータス、健全性、またはパフォーマンスに関するメッセージです。これは、Red Hat Site Reliability Engineering (SRE) がクラスターの健全性やクラスターの問題解決についてユーザーに連絡する主な手段でもあります。
8.1.1. Red Hat Hybrid Cloud Console を使用したクラスター通知の表示
クラスター通知は、クラスターの健全性に関する重要な情報を提供します。クラスターに送信された通知は、Red Hat Hybrid Cloud Console の Cluster history タブで表示できます。
前提条件
- Hybrid Cloud Console にログインしている。
手順
- Hybrid Cloud Console の Clusters ページに移動します。
- クラスターの名前をクリックし、クラスターの詳細ページに移動します。
Cluster history タブをクリックします。
クラスター通知が Cluster history の見出しの下に表示されます。
オプション: 関連するクラスター通知をフィルタリングします。
専門分野や重要な問題の解決に集中できるように、フィルターコントロールを使用して、自分に関係のないクラスター通知を非表示にします。通知の説明のテキスト、重大度レベル、通知タイプ、通知の受信日時、通知をトリガーしたシステムまたはユーザーに基づいて通知をフィルタリングできます。
8.2. Red Hat OpenShift Service on AWS クラスターのインストールのトラブルシューティング
Red Hat OpenShift Service on AWS クラスターのインストールに関するヘルプは、次のセクションを参照してください。
8.2.1. インストールのトラブルシューティング
8.2.1.1. インストールまたはアンインストールログの検査
インストールログを表示するには、以下を実行します。
以下のコマンドを実行し、
<cluster_name>をクラスターの名前に置き換えます。$ rosa logs install --cluster=<cluster_name>ログを確認するには、
--watchフラグを追加します。$ rosa logs install --cluster=<cluster_name> --watch
アンインストールログを表示するには、以下を実行します。
以下のコマンドを実行し、
<cluster_name>をクラスターの名前に置き換えます。$ rosa logs uninstall --cluster=<cluster_name>ログを確認するには、
--watchフラグを追加します。$ rosa logs uninstall --cluster=<cluster_name> --watch
8.2.1.2. AWS アカウントおよびクォータの確認
以下のコマンドを実行して、AWS アカウントに利用可能なクォータがあることを確認します。
$ rosa verify quotaAWS クォータはリージョンに基づいて変更されます。適切な AWS リージョンのクォータを確認してください。クォータを増やす必要がある場合は、AWS コンソール に移動し、失敗したサービスのクォータを増加することを要求します。
8.2.1.3. AWS 通知メール
クラスターの作成時に、Red Hat OpenShift Service on AWS サービスはサポートされるすべてのリージョンに小規模なインスタンスを作成します。このチェックにより、使用中の AWS アカウントがサポート対象の各リージョンにデプロイできることを確認します。
AWS アカウントがサポートされているリージョンを 1 つも使用していない場合は、AWS が "Your Request For Accessing AWS Resources Has Been Validated" という確認メールを 1 件以上送信する場合があります。通常、このメールの送信者は aws-verification@amazon.com です。
これは、Red Hat OpenShift Service on AWS サービスが AWS アカウント設定を検証する際の想定される動作です。
8.2.2. Red Hat OpenShift Service on AWS クラスターのインストールの検証
ROSA with HCP クラスターが 30 分以上インストール状態のままで準備が完了していない場合は、AWS アカウント環境が必要なクラスター設定に対応していることを確認してください。AWS アカウント環境が必要なクラスター設定に対応するように正しく準備されている場合は、クラスターを削除して再作成してみてください。問題が解決しない場合は、サポートにお問い合わせください。
8.2.3. Red Hat OpenShift Service on AWS のインストールエラーコードのトラブルシューティング
次の表に、Red Hat OpenShift Service on AWS のインストールエラーコードと、インストールエラーのトラブルシューティング方法を示します。
| エラーコード | 説明 | 解決方法 |
|---|---|---|
| OCM3999 | 不明なエラーです。 | 詳細はクラスターのインストールログを確認するか、このクラスターを削除してクラスターのインストールを再試行してください。この問題が解決しない場合は、カスタマーサポート ページ にログインしてサポートにお問い合わせください。 |
| OCM5001 | Red Hat OpenShift Service on AWS クラスタープロビジョニングが失敗しました。 | 詳細はクラスターのインストールログを確認するか、このクラスターを削除してクラスターのインストールを再試行してください。この問題が解決しない場合は、カスタマーサポート ページ にログインしてサポートにお問い合わせください。 |
| OCM5002 | リソースタグの最大サイズである 25 を超えました。 | クラスター情報を確認し、指定した不要なタグを削除できるかどうかを確認して、クラスターのインストールを再試行します。 |
| OCM5003 | クラスターをプロビジョニングするための AWS クライアントを確立できません。 | Red Hat OpenShift Service on AWS クラスターを作成して管理するには、AWS アカウントにいくつかのロールリソースを作成する必要があります。指定した AWS 認証情報が正しいことを確認し、クラスターのインストールを再試行します。 Red Hat OpenShift Service on AWS の IAM ロールリソースの詳細は、関連情報 セクションの ROSA IAM ロールのリソース を参照してください。 |
| OCM5004 | クラスターをプロビジョニングするためのクロスアカウント AWS クライアントを確立できません。 | Red Hat OpenShift Service on AWS クラスターを作成して管理するには、AWS アカウントにいくつかのロールリソースを作成する必要があります。指定した AWS 認証情報が正しいことを確認し、クラスターのインストールを再試行します。 Red Hat OpenShift Service on AWS の IAM ロールリソースの詳細は、関連情報 セクションの ROSA IAM ロールのリソース を参照してください。 |
| OCM5005 | クラスターに定義された AWS サブネットを取得できませんでした。 | 指定したサブネット ID を確認し、クラスターのインストールを再試行します。 |
| OCM5006 | クラスターに少なくとも 1 つのプライベート AWS サブネットを設定する必要があります。 | 指定したサブネット ID を確認し、クラスターのインストールを再試行します。 |
| OCM5007 | クラスターの AWS STS 前提条件を作成できません。 | アカウントと Operator のロールが作成されており、正しいことを確認します。詳細は、関連情報 セクションの AWS STS と ROSA with HCP の説明 を参照してください。 |
| OCM5008 | 指定されたクラスターフレーバーが正しくありません。 | フレーバーパラメーターを使用するときに、指定した名前または ID が正しいことを確認し、クラスターの作成を再試行します。 |
| OCM5009 | クラスターのバージョンが見つかりませんでした。 | 設定されているバージョン ID が有効な Red Hat OpenShift Service on AWS バージョンと一致していることを確認します。 |
| OCM5010 | クラスターのサブネットにタグを付けることができませんでした。 | AWS の権限とサブネット設定が正しいことを確認します。少なくとも 1 つのプライベートサブネットと、該当する場合は 1 つのパブリックサブネットにタグを付ける必要があります。 |
| OCM5011 | 選択したリージョンの容量が利用できないため、クラスターのインストールに失敗しました。 | 別のリージョンでクラスターのインストールを試すか、クラスターのインストールを再試行します。 |
8.2.4. Red Hat Hybrid Cloud Console へのアクセスのトラブルシューティング
Red Hat OpenShift Service on AWS クラスターでは、Red Hat OpenShift Service on AWS OAuth サーバーは、Red Hat サービスの AWS アカウントでホストされます。一方、Web コンソールサービスは、クラスターが属する AWS アカウント内のクラスターのデフォルト Ingress コントローラーを使用して公開されます。OpenShift CLI (oc) を使用してクラスターにログインできるが、Red Hat OpenShift Service on AWS Web コンソールにアクセスできない場合は、次の条件が満たされていることを確認してください。
- コンソールのワークロードが実行中である。
- デフォルトの Ingress コントローラーのロードバランサーがアクティブである。
- クラスターの VPC ネットワークにネットワーク接続されているマシンからコンソールにアクセスしている。
8.2.5. 準備完了状態の Red Hat OpenShift Service on AWS クラスターで Red Hat OpenShift Service on AWS Web コンソールへのアクセスを検証する
Red Hat OpenShift Service on AWS クラスターは、Red Hat OpenShift Service on AWS のサービスアカウントでホストされているコントロールプレーンが準備完了状態になると、ready ステータスを返します。クラスターコンソールのワークロードは、クラスターのワーカーノードにデプロイされます。ワーカーノードがクラスターに参加し、コンソールワークロードが実行されるまで、Red Hat OpenShift Service on AWS Web コンソールは使用できず、アクセスできません。
Red Hat OpenShift Service on AWS クラスターが準備完了状態であっても、クラスターの Red Hat OpenShift Service on AWS Web コンソールにアクセスできない場合は、ワーカーノードがクラスターに参加するまで待機してから、コンソールへのアクセスを再試行してください。
Red Hat OpenShift Service on AWS クラスターにログインするか、rosa CLI の rosa describe machinepool コマンドを使用してノードを監視できます。
8.2.6. Red Hat OpenShift Service on AWS プライベートクラスターで Red Hat Hybrid Cloud Console へのアクセスを検証する
プライベートクラスターのコンソールは、デフォルトではプライベートです。クラスターのインストール中に、OpenShift の Ingress Operator によって管理されるデフォルトの Ingress Controller は、内部 AWS Network Load Balancer (NLB) を使用して設定されます。
Red Hat OpenShift Service on AWS プライベートクラスターが ready ステータスを示しているにもかかわらず、クラスターの Red Hat OpenShift Service on AWS Web コンソールにアクセスできない場合は、クラスターの VPC 内から、またはその VPC に接続されているネットワークからクラスターコンソールにアクセスすることをお試しください。
8.3. ネットワークのトラブルシューティング
ここでは、ネットワークエラーのトラブルシューティング方法を説明します。
8.3.1. プライベート Network Load Balancer を使用するクラスターでの接続の問題
バージョン 4 で作成された Red Hat OpenShift Service on AWS クラスターは、default の Ingress コントローラーに対してデフォルトで AWS Network Load Balancers (NLB) をデプロイします。プライベート NLB の場合、NLB のクライアント IP アドレスの保存が原因で、送信元と宛先が同じホストである場合に接続が切断される可能性があります。Network Load Balancer のトラブルシューティング 方法は、AWS のドキュメントを参照してください。この IP アドレスの保存により、ルーター Pod と同じノード上に共存するお客様のワークロードが、Ingress コントローラールーターの前にあるプライベート NLB にトラフィックを送信できない可能性があります。
この影響を軽減するには、ルーター Pod がスケジュールされているノードとは別のノードにワークロードを再スケジュールする必要があります。また、同じクラスター内の同じ場所にある他のワークロードにアクセスするには、内部 Pod とサービスネットワークを利用する必要があります。
8.4. ノードの健全性の確認
8.4.1. ノードのステータス、リソースの使用状況および設定の確認
クラスターノードの健全性ステータス、リソース消費統計、およびノードログを確認します。さらに、個別ノードの kubelet ステータスのクエリーを実行します。
前提条件
-
dedicated-adminロールを持つユーザーとしてクラスターにアクセスできる。 -
OpenShift CLI (
oc) がインストールされている。
手順
クラスターのすべてのノードの名前、ステータスおよびロールをリスト表示します。
$ oc get nodesクラスター内の各ノードの CPU およびメモリーの使用状況を要約します。
$ oc adm top nodes特定のノードの CPU およびメモリーの使用状況を要約します。
$ oc adm top node my-node
8.5. Operator 関連の問題のトラブルシューティング
Operator は、Red Hat OpenShift Service on AWS アプリケーションのパッケージ化、デプロイメント、および管理を行う方法です。Operator はソフトウェアベンダーのエンジニアリングチームの拡張機能のように動作し、Red Hat OpenShift Service on AWS 環境を監視し、その最新状態に基づいてリアルタイムの意思決定を行います。Operator はアップグレードをシームレスに実行し、障害に自動的に対応するように設計されており、時間の節約のためにソフトウェアのバックアッププロセスを省略するなどのショートカットを実行することはありません。
Red Hat OpenShift Service on AWS 4 には、クラスターが適切に機能するために必要なデフォルトの Operator セットが含まれています。これらのデフォルト Operator は Cluster Version Operator (CVO) によって管理されます。
クラスター管理者は、Red Hat OpenShift Service on AWS Web コンソールまたは CLI を使用して、ソフトウェアカタログからアプリケーション Operator をインストールできます。その後、Operator を 1 つまたは複数の namespace にサブスクライブし、クラスター上で開発者が使用できるようにできます。アプリケーション Operator は Operator Lifecycle Manager (OLM) によって管理されます。
Operator に問題が発生した場合には、Operator Subscription のステータスを確認します。クラスター全体で Operator Pod の正常性を確認し、診断用に Operator ログを収集します。
8.5.1. Operator サブスクリプションの状態のタイプ
サブスクリプションは状態に関する以下のタイプを報告します。
| 状態 | 説明 |
|---|---|
|
| 解決に使用される一部のまたはすべてのカタログソースは正常ではありません。 |
|
| サブスクリプションのインストール計画がありません。 |
|
| サブスクリプションのインストール計画はインストールの保留中です。 |
|
| サブスクリプションのインストール計画が失敗しました。 |
|
| サブスクリプションの依存関係の解決に失敗しました。 |
デフォルトの Red Hat OpenShift Service on AWS クラスター Operator は、Cluster Version Operator (CVO) によって管理されます。この Operator には Subscription オブジェクトがありません。アプリケーション Operators は、Operator Lifecycle Manager (OLM) によって管理されます。この Operators には Subscription オブジェクトがあります。
8.5.2. CLI を使用した Operator サブスクリプションステータスの表示
CLI を使用して Operator サブスクリプションステータスを表示できます。
前提条件
-
dedicated-adminロールを持つユーザーとしてクラスターにアクセスできる。 -
OpenShift CLI (
oc) がインストールされている。
手順
Operator サブスクリプションをリスト表示します。
$ oc get subs -n <operator_namespace>oc describeコマンドを使用して、Subscriptionリソースを検査します。$ oc describe sub <subscription_name> -n <operator_namespace>コマンド出力で、
Conditionsセクションで Operator サブスクリプションの状態タイプのステータスを確認します。以下の例では、利用可能なすべてのカタログソースが正常であるため、CatalogSourcesUnhealthy状態タイプのステータスはfalseになります。出力例
Name:         cluster-logging
Namespace:    openshift-logging
Labels:       operators.coreos.com/cluster-logging.openshift-logging=
Annotations:  <none>
API Version:  operators.coreos.com/v1alpha1
Kind:         Subscription
# ...
Conditions:
   Last Transition Time:  2019-07-29T13:42:57Z
   Message:               all available catalogsources are healthy
   Reason:                AllCatalogSourcesHealthy
   Status:                False
   Type:                  CatalogSourcesUnhealthy
# ...
デフォルトの Red Hat OpenShift Service on AWS クラスター Operator は、Cluster Version Operator (CVO) によって管理されます。この Operator には Subscription オブジェクトがありません。アプリケーション Operator は、Operator Lifecycle Manager (OLM) によって管理されます。この Operator には Subscription オブジェクトがあります。
8.5.3. CLI を使用した Operator カタログソースのステータス表示
Operator カタログソースのステータスは、CLI を使用して確認できます。
前提条件
-
dedicated-adminロールを持つユーザーとしてクラスターにアクセスできる。 -
OpenShift CLI (
oc) がインストールされている。
手順
namespace のカタログソースをリスト表示します。たとえば、クラスター全体のカタログソースに使用されている
openshift-marketplacenamespace を確認することができます。$ oc get catalogsources -n openshift-marketplace出力例
NAME                  DISPLAY               TYPE   PUBLISHER   AGE
certified-operators   Certified Operators   grpc   Red Hat     55m
community-operators   Community Operators   grpc   Red Hat     55m
example-catalog       Example Catalog       grpc   Example Org 2m25s
redhat-operators      Red Hat Operators     grpc   Red Hat     55m
カタログソースの詳細やステータスを確認するには、
oc describeコマンドを使用します。$ oc describe catalogsource example-catalog -n openshift-marketplace出力例
Name:         example-catalog
Namespace:    openshift-marketplace
Labels:       <none>
Annotations:  operatorframework.io/managed-by: marketplace-operator
              target.workload.openshift.io/management: {"effect": "PreferredDuringScheduling"}
API Version:  operators.coreos.com/v1alpha1
Kind:         CatalogSource
# ...
Status:
  Connection State:
    Address:              example-catalog.openshift-marketplace.svc:50051
    Last Connect:         2021-09-09T17:07:35Z
    Last Observed State:  TRANSIENT_FAILURE
  Registry Service:
    Created At:         2021-09-09T17:05:45Z
    Port:               50051
    Protocol:           grpc
    Service Name:       example-catalog
    Service Namespace:  openshift-marketplace
# ...
前述の出力例では、最後に観測された状態が
TRANSIENT_FAILUREとなっています。この状態は、カタログソースの接続確立に問題があることを示しています。カタログソースが作成された namespace の Pod をリストアップします。
$ oc get pods -n openshift-marketplace出力例
NAME                                    READY   STATUS             RESTARTS   AGE
certified-operators-cv9nn               1/1     Running            0          36m
community-operators-6v8lp               1/1     Running            0          36m
marketplace-operator-86bfc75f9b-jkgbc   1/1     Running            0          42m
example-catalog-bwt8z                   0/1     ImagePullBackOff   0          3m55s
redhat-operators-smxx8                  1/1     Running            0          36m
namespace にカタログソースを作成すると、その namespace にカタログソース用の Pod が作成されます。前述の出力例では、
example-catalog-bwt8zPod のステータスがImagePullBackOffになっています。このステータスは、カタログソースのインデックスイメージのプルに問題があることを示しています。oc describeコマンドを使用して、より詳細な情報を得るために Pod を検査します。$ oc describe pod example-catalog-bwt8z -n openshift-marketplace出力例
Name:         example-catalog-bwt8z
Namespace:    openshift-marketplace
Priority:     0
Node:         ci-ln-jyryyg2-f76d1-ggdbq-worker-b-vsxjd/10.0.128.2
...
Events:
  Type     Reason          Age                From               Message
  ----     ------          ----               ----               -------
  Normal   Scheduled       48s                default-scheduler  Successfully assigned openshift-marketplace/example-catalog-bwt8z to ci-ln-jyryyf2-f76d1-fgdbq-worker-b-vsxjd
  Normal   AddedInterface  47s                multus             Add eth0 [10.131.0.40/23] from openshift-sdn
  Normal   BackOff         20s (x2 over 46s)  kubelet            Back-off pulling image "quay.io/example-org/example-catalog:v1"
  Warning  Failed          20s (x2 over 46s)  kubelet            Error: ImagePullBackOff
  Normal   Pulling         8s (x3 over 47s)   kubelet            Pulling image "quay.io/example-org/example-catalog:v1"
  Warning  Failed          8s (x3 over 47s)   kubelet            Failed to pull image "quay.io/example-org/example-catalog:v1": rpc error: code = Unknown desc = reading manifest v1 in quay.io/example-org/example-catalog: unauthorized: access to the requested resource is not authorized
  Warning  Failed          8s (x3 over 47s)   kubelet            Error: ErrImagePull
前述の出力例では、エラーメッセージは、カタログソースのインデックスイメージが承認問題のために正常にプルできないことを示しています。例えば、インデックスイメージがログイン認証情報を必要とするレジストリーに保存されている場合があります。
8.5.4. Operator Pod ステータスのクエリー
クラスター内の Operator Pod およびそれらのステータスをリスト表示できます。詳細な Operator Pod の要約を収集することもできます。
前提条件
-
dedicated-adminロールを持つユーザーとしてクラスターにアクセスできる。 - API サービスが機能している。
-
OpenShift CLI (
oc) がインストールされている。
手順
クラスターで実行されている Operators をリスト表示します。出力には、Operator バージョン、可用性、およびアップタイムの情報が含まれます。
$ oc get clusteroperatorsOperator の namespace で実行されている Operator Pod をリスト表示し、Pod のステータス、再起動、および経過時間をリスト表示します。
$ oc get pod -n <operator_namespace>詳細な Operator Pod の要約を出力します。
$ oc describe pod <operator_pod_name> -n <operator_namespace>
8.6. Pod の問題の調査
Red Hat OpenShift Service on AWS は、ホスト上に共にデプロイされる 1 つ以上のコンテナーである Pod の Kubernetes の概念を活用しています。Pod は、Red Hat OpenShift Service on AWS 4 上で定義、デプロイ、管理できる最小のコンピュートユニットです。
Pod が定義されると、そのコンテナーが終了するか、Pod が削除されるまで、Pod はノードで実行されるように割り当てられます。ポリシーと終了コードに応じて、Pod は終了後に削除されるか、ログにアクセスできるように保持されます。
Pod の問題が発生した場合には、まず Pod のステータスをチェックします。Pod の明示的な障害が発生した場合には、Pod のエラー状態をチェックして、特定のイメージ、コンテナー、または Pod ネットワークの問題を特定してください。エラー状態に基づく診断データの収集を行います。Pod イベントメッセージおよび Pod およびコンテナーのログ情報を確認します。コマンドライン上で実行中の Pod にアクセスするか、問題のある Pod のデプロイメント設定に基づいて root アクセスでデバッグ Pod を起動して問題を動的に診断します。
8.6.1. Pod のエラー状態について
Pod に障害が発生すると、明示的なエラー状態が返されます。このエラー状態は、oc get pods の出力の status フィールドで確認できます。Pod のエラー状態は、イメージ、コンテナー、およびコンテナーネットワークに関連する障害に関する状態を示します。
以下の表は、Pod のエラー状態のリストをそれらの説明を記載しています。
| Pod のエラー状態 | 説明 |
|---|---|
|
| 一般的なイメージの取得エラー。 |
|
| イメージの取得に失敗し、取り消されました。 |
|
| 指定されたイメージ名は無効です。 |
|
| イメージの検査に失敗しました。 |
|
|
|
|
| レジストリーからイメージの取得を試みる際に、HTTP エラーが発生しました。 |
|
| 指定されたコンテナーが宣言された Pod 内にないか、kubelet によって管理されていません。 |
|
| コンテナーの初期化に失敗しました。 |
|
| Pod のコンテナーのいずれも正常に起動しませんでした。 |
|
| Pod のコンテナーのいずれも正常に強制終了されませんでした。 |
|
| コンテナーが終了しました。kubelet は再起動を試行しません。 |
|
| コンテナーまたはイメージが root 権限で実行を試行しました。 |
|
| Pod サンドボックスの作成が成功しませんでした。 |
|
| Pod サンドボックス設定を取得できませんでした。 |
|
| Pod サンドボックスは正常に停止しませんでした。 |
|
| ネットワークの初期化に失敗しました。 |
|
| ネットワークの終了に失敗しました。 |
8.6.2. Pod ステータスの確認
Pod のステータスおよびエラー状態をクエリーできます。Pod に関連するデプロイメント設定をクエリーし、ベースイメージの可用性を確認することもできます。
前提条件
-
dedicated-adminロールを持つユーザーとしてクラスターにアクセスできる。 -
OpenShift CLI (
oc) がインストールされている。 -
skopeoがインストールされている。
手順
プロジェクトに切り替えます。
$ oc project <project_name>namespace 内で実行されている Pod、Pod のステータス、エラーの状態、再起動、および経過時間をリスト表示します。
$ oc get podsnamespace がデプロイメント設定で管理されているかどうかを判別します。
$ oc statusnamespace がデプロイメント設定で管理される場合、出力には、デプロイメント設定名とベースイメージの参照が含まれます。
前述のコマンドの出力で参照されているベースイメージを検査します。
$ skopeo inspect docker://<image_reference>ベースイメージの参照が正しくない場合は、デプロイメント設定の参照を更新します。
$ oc edit deployment/my-deploymentデプロイメント設定が終了時に変更されると、設定が自動的に再デプロイされます。デプロイメントの進行中に Pod ステータスを確認し、問題が解決されているかどうかを判別します。
$ oc get pods -wPod の失敗に関連する診断情報は、namespace 内でイベントを確認します。
$ oc get events
8.6.3. Pod およびコンテナーログの検査
明示的な Pod の失敗に関連する警告およびエラーメッセージの有無について Pod およびコンテナーログを検査できます。ポリシーおよび終了コードによっては、Pod およびコンテナーログは Pod の終了後も利用可能のままになります。
前提条件
-
dedicated-adminロールを持つユーザーとしてクラスターにアクセスできる。 - API サービスが機能している。
-
OpenShift CLI (
oc) がインストールされている。
手順
特定 Pod のログのクエリーを実行します。
$ oc logs <pod_name>クエリーを実行して、Pod 内の特定コンテナーのログを取得します。
$ oc logs <pod_name> -c <container_name>前述の
oc logsコマンドを使用して取得されるログは、Pod またはコンテナー内の標準出力 (stdout) に送信されるメッセージで構成されます。Pod 内の
/var/log/に含まれるログを検査します。Pod 内の
/var/logに含まれるファイルおよびサブディレクトリーをリスト表示します。$ oc exec <pod_name> -- ls -alh /var/log出力例
total 124K
drwxr-xr-x. 1 root root   33 Aug 11 11:23 .
drwxr-xr-x. 1 root root   28 Sep  6  2022 ..
-rw-rw----. 1 root utmp    0 Jul 10 10:31 btmp
-rw-r--r--. 1 root root  33K Jul 17 10:07 dnf.librepo.log
-rw-r--r--. 1 root root  69K Jul 17 10:07 dnf.log
-rw-r--r--. 1 root root 8.8K Jul 17 10:07 dnf.rpm.log
-rw-r--r--. 1 root root  480 Jul 17 10:07 hawkey.log
-rw-rw-r--. 1 root utmp    0 Jul 10 10:31 lastlog
drwx------. 2 root root   23 Aug 11 11:14 openshift-apiserver
drwx------. 2 root root    6 Jul 10 10:31 private
drwxr-xr-x. 1 root root   22 Mar  9 08:05 rhsm
-rw-rw-r--. 1 root utmp    0 Jul 10 10:31 wtmp
Pod 内の
/var/logに含まれる特定のログファイルのクエリーを実行します。$ oc exec <pod_name> cat /var/log/<path_to_log>出力例
2023-07-10T10:29:38+0000 INFO --- logging initialized ---
2023-07-10T10:29:38+0000 DDEBUG timer: config: 13 ms
2023-07-10T10:29:38+0000 DEBUG Loaded plugins: builddep, changelog, config-manager, copr, debug, debuginfo-install, download, generate_completion_cache, groups-manager, needs-restarting, playground, product-id, repoclosure, repodiff, repograph, repomanage, reposync, subscription-manager, uploadprofile
2023-07-10T10:29:38+0000 INFO Updating Subscription Management repositories.
2023-07-10T10:29:38+0000 INFO Unable to read consumer identity
2023-07-10T10:29:38+0000 INFO Subscription Manager is operating in container mode.
2023-07-10T10:29:38+0000 INFO
特定のコンテナー内の
/var/logに含まれるログファイルおよびサブディレクトリーをリスト表示します。$ oc exec <pod_name> -c <container_name> ls /var/log特定のコンテナー内の
/var/logに含まれる特定のログファイルのクエリーを実行します。$ oc exec <pod_name> -c <container_name> cat /var/log/<path_to_log>
8.6.4. 実行中の Pod へのアクセス
Pod 内でシェルを開くか、ポート転送によりネットワークアクセスを取得して、実行中の Pod を動的に確認することができます。
前提条件
-
dedicated-adminロールを持つユーザーとしてクラスターにアクセスできる。 - API サービスが機能している。
-
OpenShift CLI (
oc) がインストールされている。
手順
アクセスする Pod が含まれるプロジェクトに切り替えます。これは、
oc rshコマンドが-nnamespace オプションを受け入れないために必要です。$ oc project <namespace>リモートシェルを Pod で起動します。
$ oc rsh <pod_name>1 - 1
- Pod に複数のコンテナーがある場合、
oc rshは-c <container_name>が指定されていない限り最初のコンテナーにデフォルト設定されます。
Pod 内の特定のコンテナーでリモートシェルを起動します。
$ oc rsh -c <container_name> pod/<pod_name>Pod のポートへのポート転送セッションを作成します。
$ oc port-forward <pod_name> <host_port>:<pod_port>1 - 1
- ポート転送セッションをキャンセルするには、
Ctrl+Cを入力します。
8.6.5. root アクセスでのデバッグ Pod の起動
問題のある Pod のデプロイメントまたはデプロイメント設定に基づいて、root アクセスでデバッグ Pod を起動できます。通常、Pod ユーザーは root 以外の権限で実行しますが、問題を調査するために一時的な root 権限で Pod のトラブルシューティングを実行することは役に立ちます。
前提条件
-
dedicated-adminロールを持つユーザーとしてクラスターにアクセスできる。 - API サービスが機能している。
-
OpenShift CLI (
oc) がインストールされている。
手順
デプロイメントに基づいて、root アクセスでデバッグ Pod を起動します。
プロジェクトのデプロイメント名を取得します。
$ oc get deployment -n <project_name>デプロイメントに基づいて、root 権限でデバッグ Pod を起動します。
$ oc debug deployment/my-deployment --as-root -n <project_name>
デプロイメント設定に基づいて、root アクセスでデバッグ Pod を起動します。
プロジェクトのデプロイメント設定名を取得します。
$ oc get deploymentconfigs -n <project_name>デプロイメント設定に基づいて、root 権限でデバッグ Pod を起動します。
$ oc debug deploymentconfig/my-deployment-configuration --as-root -n <project_name>
インタラクティブなシェルを実行する代わりに、-- <command> を前述の oc debug コマンドに追加し、デバッグ Pod 内で個々のコマンドを実行することができます。
8.6.6. Pod およびコンテナーへの/からのファイルのコピー
Pod に/からファイルをコピーして、設定変更をテストしたり、診断情報を収集したりできます。
前提条件
-
dedicated-adminロールを持つユーザーとしてクラスターにアクセスできる。 - API サービスが機能している。
-
OpenShift CLI (
oc) がインストールされている。
手順
8.7. Source-to-Image (S2I) プロセスのトラブルシューティング
8.7.1. Source-to-Image (S2I) のトラブルシューティングのストラテジー
Source-to-Image (S2I) を使用して、再現可能な Docker 形式のコンテナーイメージをビルドします。アプリケーションソースコードをコンテナーイメージに注入し、新規イメージをアセンブルして実行可能なイメージを作成できます。新規イメージには、ベースイメージ (ビルダー) およびビルドされたソースが組み込まれています。
手順
S2I プロセスで障害が発生する場所を特定するには、以下の各 S2I ステージに関連する Pod の状態を確認できます。
- ビルド設定の段階 で、ビルド Pod はベースイメージおよびアプリケーションのソースコードからアプリケーションコンテナーイメージを作成するために使用されます。
- デプロイメント設定の段階 で、デプロイメント Pod はビルド設定段階でビルドされたアプリケーションコンテナーイメージからアプリケーション Pod をデプロイするために使用されます。デプロイメント Pod は、サービスやルートなどの他のリソースもデプロイします。デプロイメント設定は、ビルド設定が成功すると開始されます。
-
デプロイメント Pod のアプリケーション Pod の起動後 に、アプリケーションの障害が実行中のアプリケーション Pod 内で発生する可能性があります。たとえば、アプリケーション Pod が
Running状態であっても、アプリケーションは予想通りに動作しない可能性があります。このシナリオでは、実行中のアプリケーション Pod にアクセスして、Pod 内のアプリケーションの障害を調査できます。
S2I の問題のトラブルシューティングを行う際には、以下のストラテジーに従います。
- ビルド、デプロイメント、およびアプリケーション Pod ステータスを監視します。
- 問題が発生した S2I プロセスのステージを判別します。
- 失敗したステージに対応するログを確認します。
8.7.2. Source-to-Image 診断データの収集
S2I ツールは、ビルド Pod とデプロイメント Pod を順番に実行します。デプロイメント Pod は、ビルドステージで作成されたアプリケーションコンテナーイメージに基づいてアプリケーション Pod をデプロイします。S2I プロセスで障害が発生する場所を判別するために、ビルド、デプロイメント、およびアプリケーション Pod のステータスを監視します。次に、これに応じて診断データを収集します。
前提条件
-
cluster-adminロールを持つユーザーとしてクラスターにアクセスできる。 - API サービスが機能している。
-
OpenShift CLI (
oc) がインストールされている。
手順
S2I プロセス全体での Pod のステータスを確認し、障害が発生するステージを判別します。
$ oc get pods -w1 - 1
-wを使用して、Ctrl+Cを使用してコマンドを終了するまで Pod で変更の有無を監視します。
障害のある Pod のログでエラーの有無を確認します。
ビルド Pod が失敗する場合、ビルド Pod のログを確認します。
$ oc logs -f pod/<application_name>-<build_number>-build注記または、
oc logs -f bc/<application_name>を使用して、ビルド設定のログを確認できます。ビルド設定のログには、ビルド Pod からのログが含まれます。デプロイメント Pod が失敗する場合、デプロイメント Pod のログを確認します。
$ oc logs -f pod/<application_name>-<build_number>-deploy注記または、
oc logs -f dc/<application_name>を使用して、デプロイメント設定のログを確認できます。これにより、デプロイメント Pod が正常に実行されるまで、デプロイメント Pod からログが出力されます。デプロイメント Pod の完了後に実行すると、コマンドはアプリケーション Pod からログを出力します。デプロイメント Pod の完了後も、oc logs -f pod/<application_name>-<build_number>-deployを実行してログにアクセスできます。アプリケーション Pod が失敗した場合や、アプリケーションが実行中のアプリケーション Pod 内で予想通りに動作しない場合、アプリケーション Pod のログを確認します。
$ oc logs -f pod/<application_name>-<build_number>-<random_string>
8.7.3. アプリケーションの障害を調査するためのアプリケーション診断データの収集
アプリケーションの障害は実行中のアプリケーション Pod 内で発生する可能性があります。このような状態では、以下のストラテジーを使用して診断情報を取得できます。
- アプリケーション Pod に関連するイベントを確認します。
- アプリケーション Pod からログを確認します。これには、OpenShift Logging フレームワークによって収集されないアプリケーション固有のログファイルが含まれます。
- アプリケーション機能を対話的にテストし、アプリケーションコンテナーで診断ツールを実行します。
前提条件
-
cluster-adminロールを持つユーザーとしてクラスターにアクセスできる。 -
OpenShift CLI (
oc) がインストールされている。
手順
特定のアプリケーション Pod に関連するイベントをリスト表示します。以下の例では、
my-app-1-akdlgという名前のアプリケーション Pod のイベントを取得します。$ oc describe pod/my-app-1-akdlgアプリケーション Pod からのログを確認します。
$ oc logs -f pod/my-app-1-akdlg実行中のアプリケーション Pod 内で特定のログを照会します。標準出力 (stdout) に送信されるログは OpenShift Logging フレームワークによって収集され、これは前述のコマンドの出力に含まれます。以下のクエリーは、標準出力 (stdout) に送信されないログにのみ必要です。
Pod 内で root 権限なしにアプリケーションログにアクセスできる場合は、以下のようにログファイルを表示します。
$ oc exec my-app-1-akdlg -- cat /var/log/my-application.logアプリケーションログの表示に root アクセスが必要な場合は、root 権限でデバッグコンテナーを起動し、コンテナー内でログファイルを表示できます。プロジェクトの
DeploymentConfigオブジェクトからデバッグコンテナーを起動します。通常、Pod ユーザーは root 以外の権限で実行しますが、問題を調査するために一時的な root 権限で Pod のトラブルシューティングを実行することは役に立ちます。$ oc debug dc/my-deployment-configuration --as-root -- cat /var/log/my-application.log注記oc debug dc/<deployment_configuration> --as-rootを-- <command>を追加せずに実行する場合、デバッグ Pod 内で root アクセスでインタラクティブなシェルにアクセスできます。
インタラクティブなシェルでアプリケーション機能を対話的にテストし、アプリケーションコンテナーで診断ツールを実行します。
アプリケーションコンテナーでインタラクティブなシェルを起動します。
$ oc exec -it my-app-1-akdlg /bin/bash- シェルからアプリケーションの機能を対話的にテストします。たとえば、コンテナーのエントリーポイントコマンドを実行して、結果を確認することができます。次に、ソースコードを更新し、S2I プロセスでアプリケーションコンテナーを再ビルドする前に、コマンドラインから直接に変更をテストします。
コンテナー内で利用可能な診断バイナリーを実行します。
注記一部の診断バイナリーを実行するには、root 権限が必要です。このような状況では、
oc debug dc/<deployment_configuration> --as-rootを実行して、問題のある Pod のDeploymentConfigオブジェクトに基づいて、root 権限でデバッグ Pod を起動できます。次に、デバッグ Pod 内から診断バイナリーを root として実行できます。
診断バイナリーがコンテナー内で利用できない場合は、
nsenterを使用して、コンテナーの namespace 内でホストの診断バイナリーを実行できます。以下の例では、ホストのipバイナリーを使用して、コンテナーの namespace 内でip adを実行します。ターゲットノードのデバッグセッションに入ります。この手順は、
<node_name>-debugというデバッグ Pod をインスタンス化します。$ oc debug node/my-cluster-node/hostをデバッグシェル内の root ディレクトリーとして設定します。デバッグ Pod は、Pod 内の/hostにホストの root ファイルシステムをマウントします。root ディレクトリーを/hostに変更すると、ホストの実行パスに含まれるバイナリーを実行できます。# chroot /host注記Red Hat Enterprise Linux CoreOS (RHCOS) を実行する Red Hat OpenShift Service on AWS 4 クラスターノードは、イミュータブルです。クラスターの変更を適用するには、Operator を使用します。SSH を使用したクラスターノードへのアクセスは推奨されません。ただし、Red Hat OpenShift Service on AWS API が使用できない場合、または kubelet がターゲットノード上で適切に機能していない場合は、
oc操作が影響を受けます。この場合は、代わりにssh core@<node>.<cluster_name>.<base_domain>を使用してノードにアクセスできます。ターゲットコンテナー ID を判別します。
# crictl psコンテナーのプロセス ID を確認します。この例では、ターゲットコンテナー ID は
a7fe32346b120です。# crictl inspect a7fe32346b120 --output yaml | grep 'pid:' | awk '{print $2}'ホストの
ipバイナリーを使用して、コンテナーの namespace 内でip adを実行します。この例では、31150をコンテナーのプロセス ID として使用します。nsenterコマンドは、ターゲットプロセスの namespace を入力し、その namespace でコマンドを実行します。この例のターゲットプロセスはコンテナーのプロセス ID であるため、ip adコマンドは、ホストからコンテナーの namespace で実行されます。# nsenter -n -t 31150 -- ip ad注記デバッグノードなどの特権付きコンテナーを使用している場合のみ、コンテナーの namespace 内でホストの診断バイナリーを実行できます。
8.8. ストレージの問題のトラブルシューティング
8.8.1. 複数割り当てエラーの解決
ノードが予期せずにクラッシュまたはシャットダウンすると、割り当てられた ReadWriteOnce (RWO) ボリュームがノードからアンマウントされ、その後は別のノードでスケジュールされる Pod で使用可能になることが予想されます。
ただし、障害が発生したノードは割り当てられたボリュームをアンマウントできないため、新規ノードにマウントすることはできません。
複数割り当てのエラーが報告されます。
出力例
Unable to attach or mount volumes: unmounted volumes=[sso-mysql-pvol], unattached volumes=[sso-mysql-pvol default-token-x4rzc]: timed out waiting for the condition
Multi-Attach error for volume "pvc-8837384d-69d7-40b2-b2e6-5df86943eef9" Volume is already used by pod(s) sso-mysql-1-ns6b4
手順
複数割り当ての問題を解決するには、以下のソリューションのいずれかを使用します。
RWX ボリュームを使用して、複数割り当てを有効にします。
ほとんどのストレージソリューションでは、ReadWriteMany (RWX) ボリュームを使用して、複数割り当てエラーを防ぐことができます。
RWO ボリュームの使用時に障害が発生したノードを回復するか、削除します。
VMware vSphere などの RWX をサポートしないストレージの場合、RWO ボリュームが代わりに使用される必要があります。ただし、RWO ボリュームは複数のノードにマウントできません。
複数割り当てのエラーメッセージが RWO ボリュームと共に表示される場合には、シャットダウンまたはクラッシュしたノードで Pod を強制的に削除し、動的永続ボリュームの割り当て時などの重要なワークロードでのデータ損失を回避します。
$ oc delete pod <old_pod> --force=true --grace-period=0このコマンドは、シャットダウンまたはクラッシュしたノードで停止したボリュームを 6 分後に削除します。
8.9. モニタリング関連の問題の調査
Red Hat OpenShift Service on AWS には、コアプラットフォームコンポーネントのモニタリングを提供する事前に設定され、事前にインストールされた自己更新型のモニタリングスタックが組み込まれています。Red Hat OpenShift Service on AWS 4 では、クラスター管理者はオプションでユーザー定義プロジェクトのモニタリングを有効にできます。
次の問題が発生した場合は、このセクションの手順に従ってください。
- 独自のメトリクスが利用できない。
- Prometheus が大量のディスク容量を消費している。
-
Prometheus に対して
KubePersistentVolumeFillingUpアラートが発生している。
8.9.2. Prometheus が大量のディスク領域を消費している理由の特定
開発者は、キーと値のペアの形式でメトリクスの属性を定義するためにラベルを作成できます。使用できる可能性のあるキーと値のペアの数は、属性に使用できる可能性のある値の数に対応します。数が無制限の値を持つ属性は、バインドされていない属性と呼ばれます。たとえば、customer_id 属性は、使用できる値が無限にあるため、バインドされていない属性になります。
割り当てられるキーと値のペアにはすべて、一意の時系列があります。ラベルに多数のバインドされていない値を使用すると、作成される時系列の数が指数関数的に増加する可能性があります。これは Prometheus のパフォーマンスに影響する可能性があり、多くのディスク領域を消費する可能性があります。
Prometheus が多くのディスクを消費する場合、以下の手段を使用できます。
- どのラベルが最も多くの時系列データを作成しているか詳しく知るには、Prometheus HTTP API を使用して時系列データベース (TSDB) のステータスを確認 します。これを実行するには、クラスター管理者権限が必要です。
- 収集されている スクレイプサンプルの数を確認 します。
ユーザー定義メトリクスに割り当てられるバインドされていない属性の数を減らすことで、作成される一意の時系列の数を減らします。
注記使用可能な値の制限されたセットにバインドされる属性を使用すると、可能なキーと値のペアの組み合わせの数が減ります。
- ユーザー定義のプロジェクト全体で スクレイピングできるサンプルの数に制限を適用 します。これには、クラスター管理者の権限が必要です。
前提条件
-
dedicated-adminロールを持つユーザーとしてクラスターにアクセスできる。 -
OpenShift CLI (
oc) がインストールされている。
手順
- Red Hat OpenShift Service on AWS Web コンソールで、Observe → Metrics に移動します。
Expression フィールドに、Prometheus Query Language (PromQL) クエリーを入力します。次のクエリー例は、ディスク領域の消費量の増加につながる可能性のある高カーディナリティメトリクスを識別するのに役立ちます。
次のクエリーを実行すると、スクレイプサンプルの数が最も多いジョブを 10 個特定できます。
topk(10, max by(namespace, job) (topk by(namespace, job) (1, scrape_samples_post_metric_relabeling)))次のクエリーを実行すると、過去 1 時間に最も多くの時系列データを作成したジョブを 10 個特定して、時系列のチャーンを正確に特定できます。
topk(10, sum by(namespace, job) (sum_over_time(scrape_series_added[1h])))
想定よりもサンプルのスクレイプ数が多いメトリクスに割り当てられたラベルで、値が割り当てられていないものの数を確認します。
- メトリクスがユーザー定義のプロジェクトに関連する場合、ワークロードに割り当てられたメトリクスのキーと値のペアを確認します。これらのライブラリーは、アプリケーションレベルで Prometheus クライアントライブラリーを使用して実装されます。ラベルで参照されるバインドされていない属性の数の制限を試行します。
- メトリクスがコアの Red Hat OpenShift Service on AWS プロジェクトに関連している場合 は、Red Hat Customer Portal で Red Hat サポートケースを作成します。
以下の手順に従い、
dedicated-adminとしてログインし、Prometheus HTTP API を使用して TSDB ステータスを確認します。次のコマンドを実行して、Prometheus API ルート URL を取得します。
$ HOST=$(oc -n openshift-monitoring get route prometheus-k8s -ojsonpath='{.status.ingress[].host}')次のコマンドを実行して認証トークンを抽出します。
$ TOKEN=$(oc whoami -t)次のコマンドを実行して、Prometheus の TSDB ステータスのクエリーを実行します。
$ curl -H "Authorization: Bearer $TOKEN" -k "https://$HOST/api/v1/status/tsdb"出力例
"status": "success","data":{"headStats":{"numSeries":507473,
"numLabelPairs":19832,"chunkCount":946298,"minTime":1712253600010,
"maxTime":1712257935346},"seriesCountByMetricName":
[{"name":"etcd_request_duration_seconds_bucket","value":51840},
{"name":"apiserver_request_sli_duration_seconds_bucket","value":47718},
...
8.10. OpenShift CLI (oc) 関連の問題の診断
8.10.1. OpenShift CLI (oc) ログレベルについて
OpenShift CLI (oc) を使用すると、ターミナルからアプリケーションを作成し、Red Hat OpenShift Service on AWS プロジェクトを管理できます。
oc コマンド固有の問題が発生した場合は、oc のログレベルを引き上げ、コマンドで生成される API 要求、API 応答、および curl 要求の詳細を出力します。これにより、特定の oc コマンドの基礎となる操作の詳細ビューが得られます。これにより、障害の性質に関する洞察が得られる可能性があります。
oc ログレベルは、1 から 10 まであります。以下の表は、oc ログレベルのリストとそれらの説明を示しています。
| ログレベル | 説明 |
|---|---|
| 1 - 5 | 標準エラー (stderr) への追加のロギングはありません。 |
| 6 | 標準エラー (stderr) に API 要求のログを記録します。 |
| 7 | 標準エラー (stderr) に API 要求およびヘッダーのログを記録します。 |
| 8 | 標準エラー (stderr) に API 要求、ヘッダーおよび本体、ならびに API 応答ヘッダーおよび本体のログを記録します。 |
| 9 |
標準エラー (stderr) に API 要求、ヘッダーおよび本体、API 応答ヘッダーおよび本体、 |
| 10 |
標準エラー (stderr) に API 要求、ヘッダーおよび本体、API 応答ヘッダーおよび本体、 |
8.10.2. OpenShift CLI (oc) ログレベルの指定
コマンドのログレベルを引き上げて、OpenShift CLI (oc) の問題を調査できます。
通常、Red Hat OpenShift Service on AWS ユーザーの現行セッショントークンは、必要に応じてログに記録される curl 要求に含まれます。また、oc コマンドの基礎となるプロセスを手順ごとにテストする際に使用するために、現行ユーザーのセッショントークンを手動で取得することもできます。
前提条件
-
OpenShift CLI (
oc) がインストールされている。
手順
ocコマンドの実行時にocログレベルを指定します。$ oc <command> --loglevel <log_level>ここでは、以下のようになります。
- <command>
- 実行しているコマンドを指定します。
- <log_level>
- コマンドに適用するログレベルを指定します。
現行ユーザーのセッショントークンを取得するには、次のコマンドを実行します。
$ oc whoami -t出力例
sha256~RCV3Qcn7H-OEfqCGVI0CvnZ6...
8.11. 期限切れトークンのトラブルシューティング
8.11.1. 期限切れのオフラインアクセストークンのトラブルシューティング
Red Hat OpenShift Service on AWS (ROSA) CLI rosa を使用しており、api.openshift.com オフラインアクセストークンの有効期限が切れると、エラーメッセージが表示されます。これは、sso.redhat.com がトークンが無効な場合に発生します。
出力例
Can't get tokens ....
Can't get access tokens ....
手順
以下の URL で新たにオフラインアクセストークンを生成します。URL にアクセスするたびに、新しいオフラインアクセストークンが生成されます。
- Red Hat OpenShift Service on AWS (ROSA): https://console.redhat.com/openshift/token/rosa
8.12. IAM ロールのトラブルシューティング
8.12.1. ocm-roles および user-role の IAM リソースに関する問題の解決
Red Hat OpenShift Service on AWS (ROSA) CLI、rosa を使用してクラスターを作成しようとすると、エラーが発生する場合があります。
出力例
E: Failed to create cluster: The sts_user_role is not linked to account '1oNl'. Please create a user role and link it to the account.
このエラーは、user-role IAM ロールが AWS アカウントにリンクされていないことを意味します。このエラーの原因は、Red Hat 組織内の別のユーザーが ocm-role IAM ロールを作成したことが最も可能性が高くなります。user-role IAM ロールを作成する必要があります。
あるユーザーが Red Hat アカウントにリンクされた ocm-role IAM リソースを設定した後、その Red Hat 組織でクラスターを作成するユーザーは、クラスターをプロビジョニングするために user-role IAM ロールが必要になります。
手順
次のコマンドを使用して、
ocm-roleおよびuser-roleの IAM ロールのステータスを評価します。$ rosa list ocm-role出力例
I: Fetching ocm roles
ROLE NAME                           ROLE ARN                                          LINKED  ADMIN
ManagedOpenShift-OCM-Role-1158  arn:aws:iam::2066:role/ManagedOpenShift-OCM-Role-1158   No      No
$ rosa list user-role出力例
I: Fetching user roles
ROLE NAME                                   ROLE ARN                                        LINKED
ManagedOpenShift-User.osdocs-Role  arn:aws:iam::2066:role/ManagedOpenShift-User.osdocs-Role  Yes
これらのコマンドの結果を使用して、不足している IAM リソースを作成およびリンクできます。
8.12.1.1. ocm-role IAM ロールの作成
ocm-role IAM ロールは、ROSA コマンドラインインターフェイス(CLI) (rosa)を使用して作成します。
前提条件
- AWS アカウントがある。
- OpenShift Cluster Manager 組織で Red Hat 組織管理者特権がある。
- AWS アカウント全体のロールをインストールするために必要な権限がある。
-
インストールホストに最新の ROSA CLI
rosaをインストールして設定した。
手順
基本的な権限を持つ ocm-role IAM ロールを作成するには、次のコマンドを実行します。
$ rosa create ocm-role管理者権限を持つ ocm-role IAM ロールを作成するには、次のコマンドを実行します。
$ rosa create ocm-role --adminこのコマンドを使用すると、特定の属性を指定してロールを作成できます。次の出力例は、選択された "自動モード" を示しています。これにより、ROSA CLI (
rosa) で Operator のロールとポリシーを作成できます。詳細は、「アカウント全体のロールの作成方法」を参照してください。以下の例は、作成フローを示しています。I: Creating ocm role ? Role prefix: ManagedOpenShift ? Enable admin capabilities for the OCM role (optional): No ? Permissions boundary ARN (optional): ? Role Path (optional): ? Role creation mode: auto I: Creating role using 'arn:aws:iam::<ARN>:user/<UserName>' ? Create the 'ManagedOpenShift-OCM-Role-182' role? Yes I: Created role 'ManagedOpenShift-OCM-Role-182' with ARN 'arn:aws:iam::<ARN>:role/ManagedOpenShift-OCM-Role-182' I: Linking OCM role ? OCM Role ARN: arn:aws:iam::<ARN>:role/ManagedOpenShift-OCM-Role-182 ? Link the 'arn:aws:iam::<ARN>:role/ManagedOpenShift-OCM-Role-182' role with organization '<AWS ARN>'? Yes I: Successfully linked role-arn 'arn:aws:iam::<ARN>:role/ManagedOpenShift-OCM-Role-182' with organization account '<AWS ARN>'ここでは、以下のようになります。
Role prefix-
作成されたすべての AWS リソースの接頭辞値。この例では、
ManagedOpenShiftがすべての AWS リソースを付加します。 OCM ロールの管理者機能の有効化 (オプション)このロールに追加の管理者権限を付与するかどうかを選択します。
注記--adminオプションを使用した場合、このプロンプトは表示されません。パーミッション境界 ARN (オプション)- アクセス許可境界を設定するためのポリシーの Amazon Resource Name (ARN)。
ロールのパス (オプション)- ユーザー名の IAM パスを指定します。
ロール作成モード-
AWS ロールの作成方法を選択します。
autoを使用して、ROSA CLI はロールおよびポリシーを生成してリンクします。autoモードでは、AWS ロールを作成するためのいくつかの異なるプロンプトが表示されます。 'ManagedOpenShift-OCM-Role-182' ロールを作成しますか?-
autoメソッドは、接頭辞を使用して特定のocm-roleを作成するかどうかを尋ねます。 OCM Role ARN- IAM ロールを OpenShift Cluster Manager に関連付けることを確認します。
'arn:aws:iam::<ARN>:role/ManagedOpenShift-OCM-Role-182' ロールを組織 '<AWS ARN>' にリンクしますか ?- 作成したロールを AWS 組織にリンクします。
8.12.1.2. ユーザーロール IAM ロールの作成
ROSA コマンドラインインターフェイス(CLI) (rosa)を使用して、user-role IAM ロールを作成できます。
前提条件
- AWS アカウントがある。
-
インストールホストに最新の ROSA CLI
rosaをインストールして設定した。
手順
基本的な権限を持つ
user-roleIAM ロールを作成するには、次のコマンドを実行します。$ rosa create user-roleこのコマンドを使用すると、特定の属性を指定してロールを作成できます。次の出力例は、選択された「自動モード」を示しています。これにより、ROSA CLI (
rosa) で Operator のロールとポリシーを作成できます。詳細は、「自動および手動のデプロイメントモードについて」を参照してください。以下の例は、作成フローを示しています。I: Creating User role ? Role prefix: ManagedOpenShift ? Permissions boundary ARN (optional): ? Role Path (optional): ? Role creation mode: auto I: Creating ocm user role using 'arn:aws:iam::2066:user' ? Create the 'ManagedOpenShift-User.osdocs-Role' role? Yes I: Created role 'ManagedOpenShift-User.osdocs-Role' with ARN 'arn:aws:iam::2066:role/ManagedOpenShift-User.osdocs-Role' I: Linking User role ? User Role ARN: arn:aws:iam::2066:role/ManagedOpenShift-User.osdocs-Role ? Link the 'arn:aws:iam::2066:role/ManagedOpenShift-User.osdocs-Role' role with account '1AGE'? Yes I: Successfully linked role ARN 'arn:aws:iam::2066:role/ManagedOpenShift-User.osdocs-Role' with account '1AGE'ここでは、以下のようになります。
Role prefix-
作成されたすべての AWS リソースの接頭辞値。この例では、
ManagedOpenShiftがすべての AWS リソースを付加します。 パーミッション境界 ARN (オプション)- アクセス許可境界を設定するためのポリシーの Amazon Resource Name (ARN)。
ロールのパス (オプション)- ユーザー名の IAM パスを指定します。
ロール作成モード-
AWS ロールの作成方法を選択します。
autoを使用して、ROSA CLI はロールおよびポリシーを生成してリンクします。autoモードでは、AWS ロールを作成するためのいくつかの異なるプロンプトが表示されます。 'ManagedOpenShift-User.osdocs-Role' ロールを作成しますか?-
autoメソッドは、接頭辞を使用して特定のuser-roleを作成するかどうかを尋ねます。 'arn:aws:iam::2066:role/ManagedOpenShift-User.osdocs-Role' ロールをアカウント '1AGE' にリンクしますか ?- 作成したロールを AWS 組織にリンクします。
重要クラスターを削除する前に
user-roleIAM ロールのリンクを解除または削除すると、エラーが発生してクラスターを削除できなくなります。削除プロセスを続行するには、このロールを作成または再リンクする必要があります。
8.12.1.3. AWS アカウントを IAM ロールに関連付ける
ROSA コマンドラインインターフェイス(CLI) (rosa)を使用して、AWS アカウントを既存の IAM ロールに関連付けたり、リンクしたりできます。
前提条件
- AWS アカウントがある。
- AWS アカウント全体のロールをインストールするために必要な権限がある。詳細は、このセクションの「関連情報」を参照してください。
-
インストールホストに、最新の AWS CLI (
aws)および ROSA CLI をインストールして設定している。 ocm-roleおよびuser-roleIAM ロールを作成したが、まだ AWS アカウントにリンクしていない。次のコマンドを実行して、IAM ロールがすでにリンクされているかどうかを確認できます。$ rosa list ocm-role$ rosa list user-role両方のロールの
Linked列にYesが表示されている場合、ロールはすでに AWS アカウントにリンクされています。
手順
ROSA CLI で、Amazon Resource Name (ARN) を使用して
ocm-roleリソースを Red Hat 組織にリンクします。注記rosa linkコマンドを実行するには、Red Hat Organization Administrator (組織管理者権限) が必要です。ocm-roleリソースを AWS アカウントにリンクすると、それが有効になり、組織内のすべてのユーザーに表示されるようになります。$ rosa link ocm-role --role-arn <arn>以下に例を示します。
I: Linking OCM role
? Link the '<AWS ACCOUNT ID>` role with organization '<ORG ID>'? Yes
I: Successfully linked role-arn '<AWS ACCOUNT ID>' with organization account '<ORG ID>'
ROSA CLI で、Amazon Resource Name (ARN) を使用して、
user-roleリソースを Red Hat ユーザーアカウントにリンクします。$ rosa link user-role --role-arn <arn>以下に例を示します。
I: Linking User role
? Link the 'arn:aws:iam::<ARN>:role/ManagedOpenShift-User-Role-125' role with organization '<AWS ID>'? Yes
I: Successfully linked role-arn 'arn:aws:iam::<ARN>:role/ManagedOpenShift-User-Role-125' with organization account '<AWS ID>'
8.12.1.4. 複数の AWS アカウントを Red Hat 組織に関連付ける
Red Hat 組織には、複数の AWS アカウントを関連付けることができます。複数のアカウントを関連付けると、Red Hat 組織から、関連付けられた任意の AWS アカウントに Red Hat OpenShift Service on AWS クラスターを作成できます。
この機能を使用すると、お客様のビジネスに適した特性に応じて、異なる AWS プロファイルでクラスターを作成できます。たとえば、リージョンごとに 1 つの AWS プロファイルを使用して、リージョンに紐付いた環境を作成できます。
前提条件
- AWS アカウントがある。
- クラスターを作成するために OpenShift Cluster Manager を使用中である。
- AWS アカウント全体のロールをインストールするために必要な権限がある。
-
インストールホストに最新の AWS CLI (
aws)および ROSA コマンドラインインターフェイス(CLI) (rosa)をインストールして設定している。 -
Red Hat OpenShift Service on AWS 用の
ocm-roleおよびuser-roleIAM ロールを作成した。
手順
OpenShift Cluster Manager ロールを作成するときに AWS アカウントプロファイルを指定するには、以下を実行します。
$ rosa create --profile <aws_profile> ocm-roleユーザーロールを作成するときに AWS アカウントプロファイルを指定するには、以下を実行します。
$ rosa create --profile <aws_profile> user-roleアカウントロールを作成するときに AWS アカウントプロファイルを指定するには、以下を実行します。
$ rosa create --profile <aws_profile> account-roles注記プロファイルを指定しない場合は、デフォルトの AWS プロファイルとそれに関連付けられた AWS リージョンが使用されます。
8.13. Red Hat OpenShift Service on AWS クラスターのデプロイメントのトラブルシューティング
このドキュメントでは、クラスターデプロイメントエラーのトラブルシューティング方法を説明します。
8.13.1. 障害が発生したクラスターに関する情報の取得
クラスターのデプロイメントに失敗すると、クラスターは「エラー」状態になります。
手順
以下のコマンドを実行してさらに多くの情報を取得します。
$ rosa describe cluster -c <my_cluster_name> --debug
8.13.2. osdCcsAdmin エラーが発生した場合のクラスター作成のトラブルシューティング
クラスター作成アクションが失敗すると、次のエラーメッセージが表示される場合があります。
出力例
Failed to create cluster: Unable to create cluster spec: Failed to get access keys for user 'osdCcsAdmin': NoSuchEntity: The user with name osdCcsAdmin cannot be found.手順
この問題を修正するには、以下を実行します。
スタックを削除します。
$ rosa init --deleteアカウントを再初期化します。
$ rosa init
8.13.3. Elastic Load Balancing (ELB) サービスにリンクされたロールの作成
AWS アカウントでロードバランサーを作成していない場合は、Elastic Load Balancing (ELB) のサービスにリンクされたロールがまだ存在していない可能性があります。以下のエラーが表示される場合があります。
Error: Error creating network Load Balancer: AccessDenied: User: arn:aws:sts::xxxxxxxxxxxx:assumed-role/ManagedOpenShift-Installer-Role/xxxxxxxxxxxxxxxxxxx is not authorized to perform: iam:CreateServiceLinkedRole on resource: arn:aws:iam::xxxxxxxxxxxx:role/aws-service-role/elasticloadbalancing.amazonaws.com/AWSServiceRoleForElasticLoadBalancing"手順
この問題を解決するには、ロールが AWS アカウントに存在することを確認します。設定されていない場合は、以下のコマンドでこのロールを作成します。
aws iam get-role --role-name "AWSServiceRoleForElasticLoadBalancing" || aws iam create-service-linked-role --aws-service-name "elasticloadbalancing.amazonaws.com"注記このコマンドは、アカウントごとに 1 回のみ実行する必要があります。
8.13.4. 削除できないクラスターの修復
特定のケースで、クラスターを削除しようとすると、OpenShift Cluster Manager に次のエラーが表示されます。
Error deleting cluster
CLUSTERS-MGMT-400: Failed to delete cluster <hash>: sts_user_role is not linked to your account. sts_ocm_role is linked to your organization <org number> which requires sts_user_role to be linked to your Red Hat account <account ID>.Please create a user role and link it to the account: User Account <account ID> is not authorized to perform STS cluster operations

Operation ID: b0572d6e-fe54-499b-8c97-46bf6890011c
CLI からクラスターを削除しようとすると、次のエラーが表示されます。
E: Failed to delete cluster <hash>: sts_user_role is not linked to your account. sts_ocm_role is linked to your organization <org_number> which requires sts_user_role to be linked to your Red Hat account <account_id>.Please create a user role and link it to the account: User Account <account ID> is not authorized to perform STS cluster operations
このエラーは、user-role がリンク解除または削除されたときに発生します。
手順
次のコマンドを実行して、
user-roleIAM リソースを作成します。$ rosa create user-roleロールが作成されたことを確認したら、クラスターを削除できます。以下で、ロールが作成され、リンクされたことを確認します。
I: Successfully linked role ARN <user role ARN> with account <account ID>
Legal Notice
Copyright © Red Hat
OpenShift documentation is licensed under the Apache License 2.0 (https://www.apache.org/licenses/LICENSE-2.0).
Modified versions must remove all Red Hat trademarks.
Portions adapted from https://github.com/kubernetes-incubator/service-catalog/ with modifications by Red Hat.
Red Hat, Red Hat Enterprise Linux, the Red Hat logo, the Shadowman logo, JBoss, OpenShift, Fedora, the Infinity logo, and RHCE are trademarks of Red Hat, Inc., registered in the United States and other countries.
Linux® is the registered trademark of Linus Torvalds in the United States and other countries.
Java® is a registered trademark of Oracle and/or its affiliates.
XFS® is a trademark of Silicon Graphics International Corp. or its subsidiaries in the United States and/or other countries.
MySQL® is a registered trademark of MySQL AB in the United States, the European Union and other countries.
Node.js® is an official trademark of the OpenJS Foundation.
The OpenStack® Word Mark and OpenStack logo are either registered trademarks/service marks or trademarks/service marks of the OpenStack Foundation, in the United States and other countries and are used with the OpenStack Foundation’s permission. We are not affiliated with, endorsed or sponsored by the OpenStack Foundation, or the OpenStack community.
All other trademarks are the property of their respective owners.