Ce contenu n'est pas disponible dans la langue sélectionnée.
Chapter 10. Monitoring project and application metrics using the Developer perspective
The Observe view in the Developer perspective provides options to monitor your project or application metrics, such as CPU, memory, and bandwidth usage, and network related information.
10.1. Prerequisites
- You have created and deployed applications on OpenShift Container Platform.
- You have logged in to the web console and have switched to the Developer perspective.
10.2. Monitoring your project metrics
After you create applications in your project and deploy them, you can use the Developer perspective in the web console to see the metrics for your project.
Procedure
- Go to Observe to see the Dashboard, Metrics, Alerts, and Events for your project.
Optional: Use the Dashboard tab to see graphs depicting the following application metrics:
- CPU usage
- Memory usage
- Bandwidth consumption
- Network-related information such as the rate of transmitted and received packets and the rate of dropped packets.
In the Dashboard tab, you can access the Kubernetes compute resources dashboards.
NoteIn the Dashboard list, the Kubernetes / Compute Resources / Namespace (Pods) dashboard is selected by default.
Use the following options to see further details:
- Select a dashboard from the Dashboard list to see the filtered metrics. All dashboards produce additional sub-menus when selected, except Kubernetes / Compute Resources / Namespace (Pods).
- Select an option from the Time Range list to determine the time frame for the data being captured.
- Set a custom time range by selecting Custom time range from the Time Range list. You can input or select the From and To dates and times. Click Save to save the custom time range.
- Select an option from the Refresh Interval list to determine the time period after which the data is refreshed.
- Hover your cursor over the graphs to see specific details for your pod.
- Click Inspect located in the upper-right corner of every graph to see any particular graph details. The graph details appear in the Metrics tab.
Optional: Use the Metrics tab to query for the required project metric.
Figure 10.1. Monitoring metrics
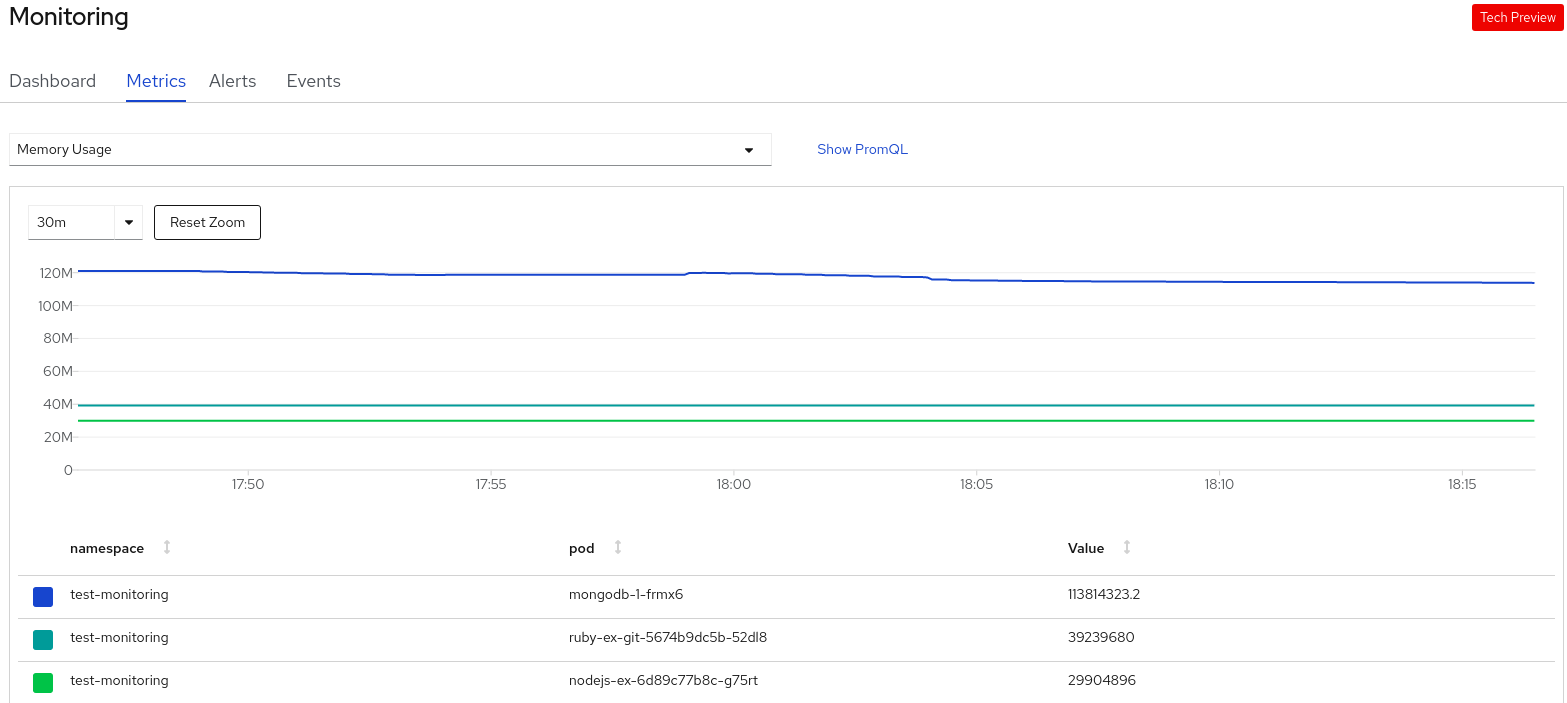
- In the Select Query list, select an option to filter the required details for your project. The filtered metrics for all the application pods in your project are displayed in the graph. The pods in your project are also listed below.
- From the list of pods, clear the colored square boxes to remove the metrics for specific pods to further filter your query result.
- Click Show PromQL to see the Prometheus query. You can further modify this query with the help of prompts to customize the query and filter the metrics you want to see for that namespace.
- Use the drop-down list to set a time range for the data being displayed. You can click Reset Zoom to reset it to the default time range.
- Optional: In the Select Query list, select Custom Query to create a custom Prometheus query and filter relevant metrics.
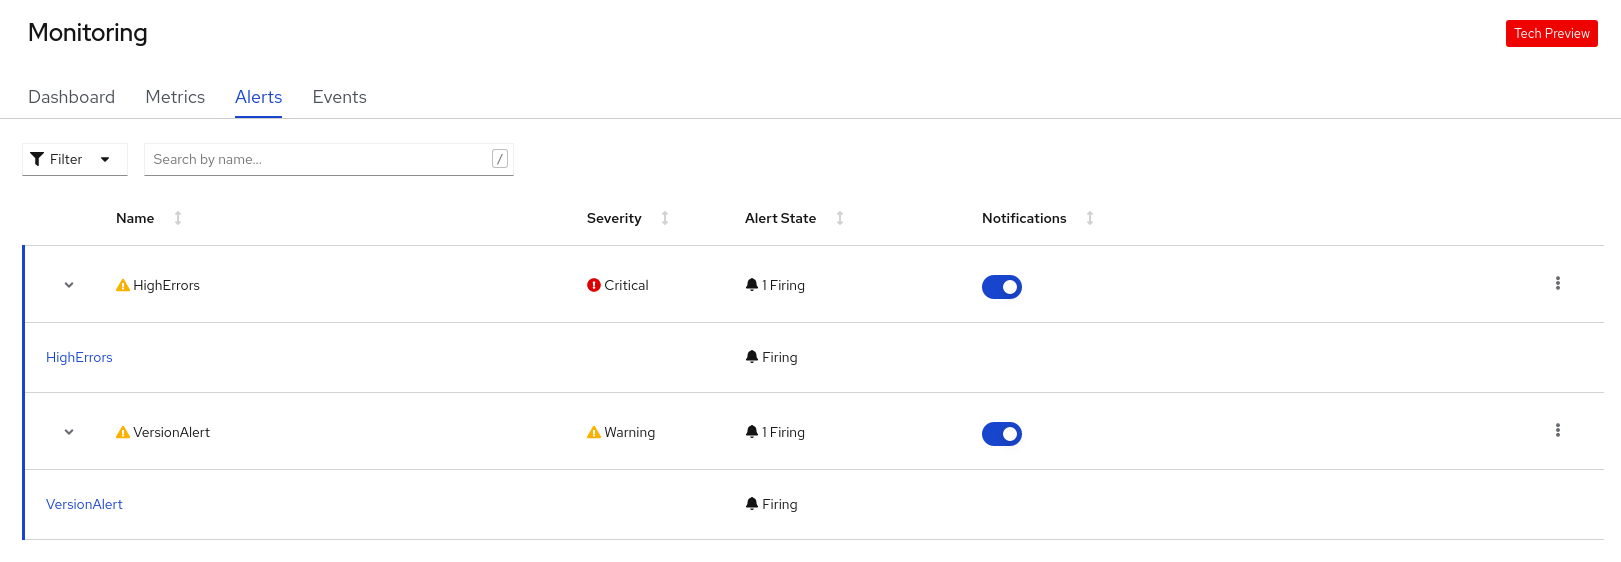
Optional: Use the Alerts tab to do the following tasks:
- See the rules that trigger alerts for the applications in your project.
- Identify the alerts firing in the project.
- Silence such alerts if required.
Figure 10.2. Monitoring alerts
Use the following options to see further details:
- Use the Filter list to filter the alerts by their Alert State and Severity.
- Click on an alert to go to the details page for that alert. In the Alerts Details page, you can click View Metrics to see the metrics for the alert.
- Use the Notifications toggle adjoining an alert rule to silence all the alerts for that rule, and then select the duration for which the alerts will be silenced from the Silence for list. You must have the permissions to edit alerts to see the Notifications toggle.
-
Use the Options menu
 adjoining an alert rule to see the details of the alerting rule.
Optional: Use the Events tab to see the events for your project.
Figure 10.3. Monitoring events
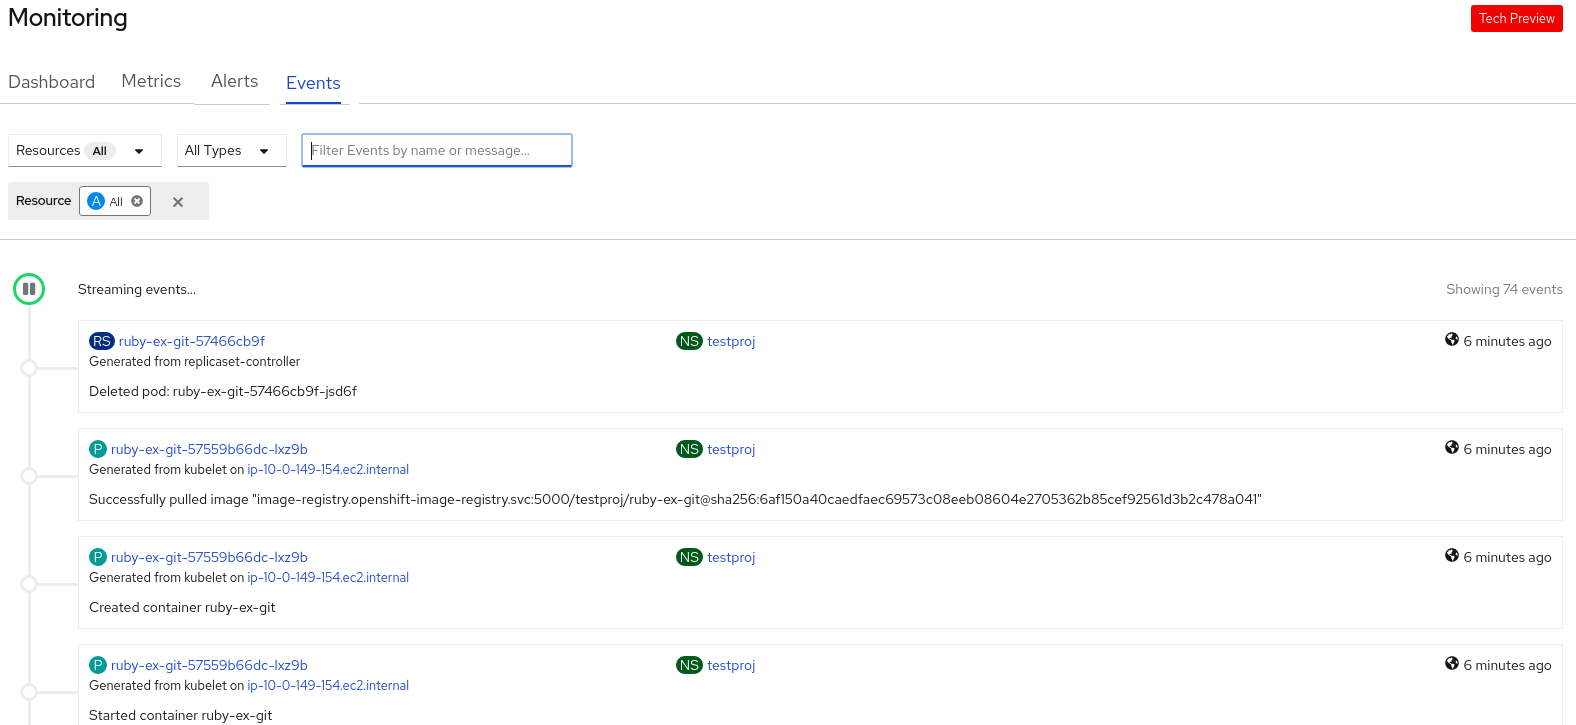
You can filter the displayed events using the following options:
- In the Resources list, select a resource to see events for that resource.
- In the All Types list, select a type of event to see events relevant to that type.
- Search for specific events using the Filter events by names or messages field.
10.3. Monitoring your application metrics
After you create applications in your project and deploy them, you can use the Topology view in the Developer perspective to see the alerts and metrics for your application. Critical and warning alerts for your application are indicated on the workload node in the Topology view.
Procedure
To see the alerts for your workload:
- In the Topology view, click the workload to see the workload details in the right panel.
Click the Observe tab to see the critical and warning alerts for the application; graphs for metrics, such as CPU, memory, and bandwidth usage; and all the events for the application.
NoteOnly critical and warning alerts in the Firing state are displayed in the Topology view. Alerts in the Silenced, Pending and Not Firing states are not displayed.
Figure 10.4. Monitoring application metrics
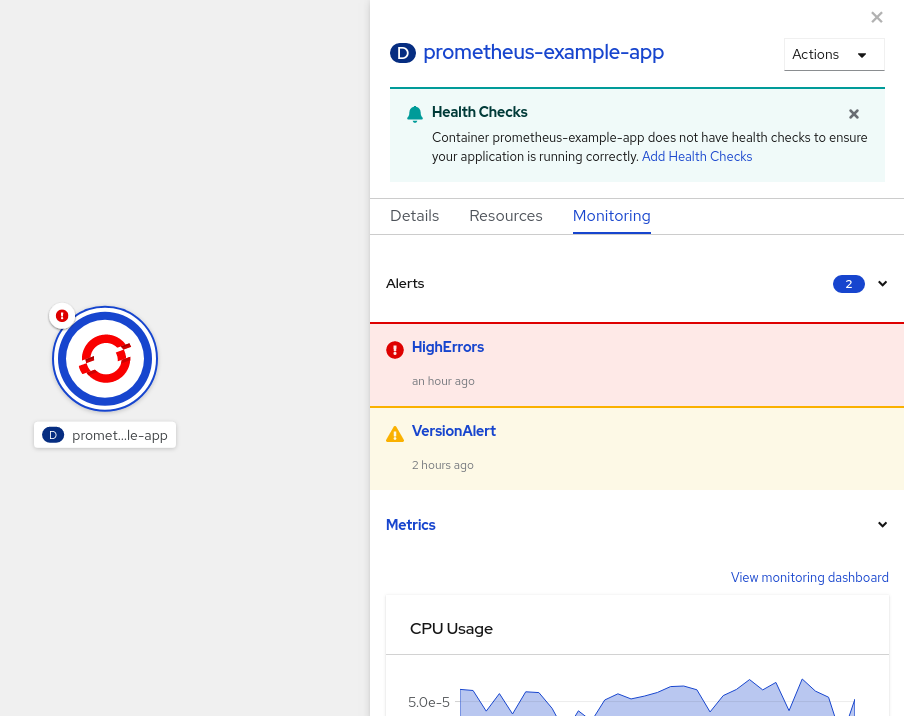
- Click the alert listed in the right panel to see the alert details in the Alert Details page.
- Click any of the charts to go to the Metrics tab to see the detailed metrics for the application.
- Click View monitoring dashboard to see the monitoring dashboard for that application.
10.4. Image vulnerabilities breakdown
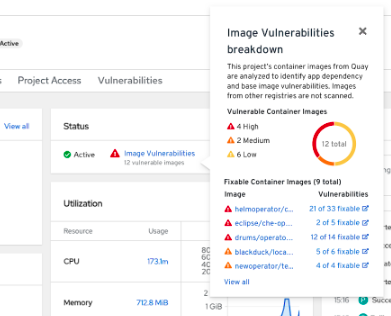
In the Developer perspective, the project dashboard shows the Image Vulnerabilities link in the Status section. Using this link, you can view the Image Vulnerabilities breakdown window, which includes details regarding vulnerable container images and fixable container images. The icon color indicates severity:
- Red: High priority. Fix immediately.
- Orange: Medium priority. Can be fixed after high-priority vulnerabilities.
- Yellow: Low priority. Can be fixed after high and medium-priority vulnerabilities.
Based on the severity level, you can prioritize vulnerabilities and fix them in an organized manner.
Figure 10.5. Viewing image vulnerabilities
10.5. Monitoring your application and image vulnerabilities metrics
After you create applications in your project and deploy them, use the Developer perspective in the web console to see the metrics for your application dependency vulnerabilities across your cluster. The metrics help you to analyze the following image vulnerabilities in detail:
- Total count of vulnerable images in a selected project
- Severity-based counts of all vulnerable images in a selected project
- Drilldown into severity to obtain the details, such as count of vulnerabilities, count of fixable vulnerabilities, and number of affected pods for each vulnerable image
Prerequisites
You have installed the Red Hat Quay Container Security operator from the Operator Hub.
NoteThe Red Hat Quay Container Security operator detects vulnerabilities by scanning the images that are in the quay registry.
Procedure
- For a general overview of the image vulnerabilities, on the navigation panel of the Developer perspective, click Project to see the project dashboard.
- Click Image Vulnerabilities in the Status section. The window that opens displays details such as Vulnerable Container Images and Fixable Container Images.
For a detailed vulnerabilities overview, click the Vulnerabilities tab on the project dashboard.
- To get more detail about an image, click its name.
- View the default graph with all types of vulnerabilities in the Details tab.
- Optional: Click the toggle button to view a specific type of vulnerability. For example, click App dependency to see vulnerabilities specific to application dependency.
- Optional: You can filter the list of vulnerabilities based on their Severity and Type or sort them by Severity, Package, Type, Source, Current Version, and Fixed in Version.
Click a Vulnerability to get its associated details:
- Base image vulnerabilities display information from a Red Hat Security Advisory (RHSA).
- App dependency vulnerabilities display information from the Snyk security application.