1.2. Monitoring stack architecture
You can learn about the monitoring stack architecture, which includes default monitoring components and components for monitoring user-defined projects.
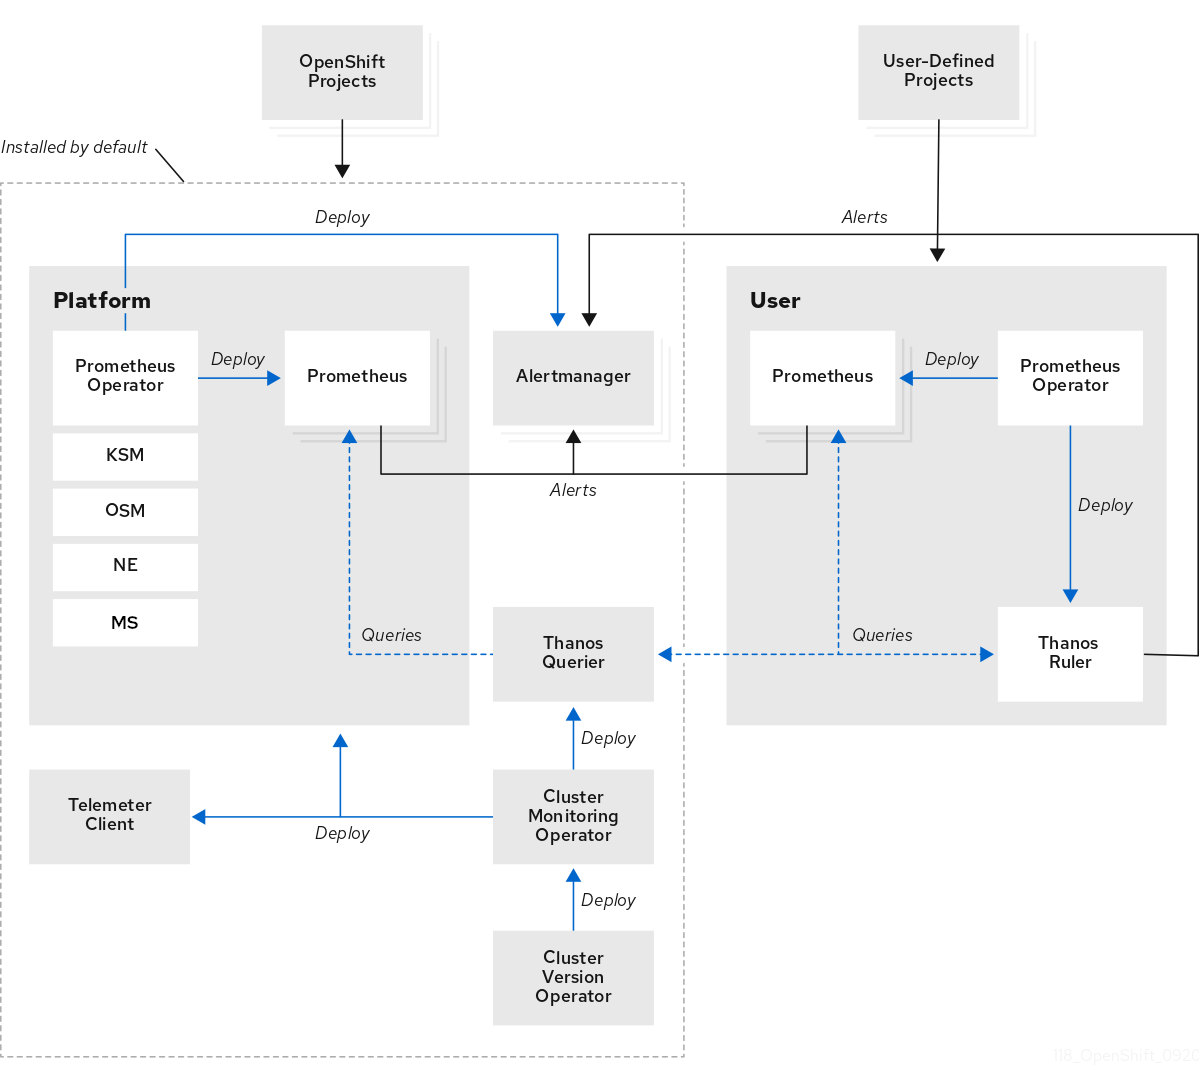
1.2.1. Understanding the monitoring stack
The monitoring stack includes the following components:
- Default platform monitoring components
A set of platform monitoring components are installed in the
openshift-monitoringproject by default during a OpenShift Dedicated installation. Red Hat Site Reliability Engineers (SRE) use these components to monitor core cluster components including Kubernetes services. This includes critical metrics, such as CPU and memory, collected from all of the workloads in every namespace.You can see these components in the Installed by default section in the following diagram.
- Components for monitoring user-defined projects
A set of user-defined project monitoring components are installed in the
openshift-user-workload-monitoringproject by default during a OpenShift Dedicated installation. You can use these components to monitor services and pods in user-defined projects.You can see these components in the User section in the following diagram.
1.2.1.1. Default monitoring targets
The following are examples of targets monitored by Red Hat Site Reliability Engineers (SRE) in your OpenShift Dedicated cluster:
- CoreDNS
- etcd
- HAProxy
- Image registry
- Kubelets
- Kubernetes API server
- Kubernetes controller manager
- Kubernetes scheduler
- OpenShift API server
- OpenShift Controller Manager
- Operator Lifecycle Manager (OLM)
The exact list of targets can vary depending on your cluster capabilities and installed components.