Chapter 5. Network Observability Operator in OpenShift Container Platform
The Network Observability Operator for OpenShift Container Platform deploys a monitoring pipeline. This pipeline collects and enriches network traffic flows generated by the eBPF agent.
5.1. Viewing statuses
View the operational status of the Network Observability Operator by using the oc get command to check the FlowCollector resource status, as well as the status of the eBPF agent, flowlogs-pipeline, and console plugin Pods.
The Network Observability Operator provides the Flow Collector API. When a Flow Collector resource is created, it deploys pods and services to create and store network flows in the Loki log store, as well as to display dashboards, metrics, and flows in the OpenShift Container Platform web console.
Procedure
Run the following command to view the state of
FlowCollector:$ oc get flowcollector/clusterExample output
NAME      AGENT   SAMPLING (EBPF)   DEPLOYMENT MODEL   STATUS
cluster   EBPF    50                DIRECT             Ready
Check the status of pods running in the
netobservnamespace by entering the following command:$ oc get pods -n netobservExample output
NAME                              READY   STATUS    RESTARTS   AGE
flowlogs-pipeline-56hbp           1/1     Running   0          147m
flowlogs-pipeline-9plvv           1/1     Running   0          147m
flowlogs-pipeline-h5gkb           1/1     Running   0          147m
flowlogs-pipeline-hh6kf           1/1     Running   0          147m
flowlogs-pipeline-w7vv5           1/1     Running   0          147m
netobserv-plugin-cdd7dc6c-j8ggp   1/1     Running   0          147m
The
flowlogs-pipelinepods collect flows, enriches the collected flows, then send flows to the Loki storage.netobserv-pluginpods create a visualization plugin for the OpenShift Container Platform Console.Check the status of pods running in the namespace
netobserv-privilegedby entering the following command:$ oc get pods -n netobserv-privilegedExample output
NAME                         READY   STATUS    RESTARTS   AGE
netobserv-ebpf-agent-4lpp6   1/1     Running   0          151m
netobserv-ebpf-agent-6gbrk   1/1     Running   0          151m
netobserv-ebpf-agent-klpl9   1/1     Running   0          151m
netobserv-ebpf-agent-vrcnf   1/1     Running   0          151m
netobserv-ebpf-agent-xf5jh   1/1     Running   0          151m
The
netobserv-ebpf-agentpods monitor network interfaces of the nodes to get flows and send them toflowlogs-pipelinepods.If you are using the Loki Operator, check the status of the
componentpods ofLokiStackcustom resource in thenetobservnamespace by entering the following command:$ oc get pods -n netobservExample output
NAME                                                READY   STATUS    RESTARTS   AGE
lokistack-compactor-0                               1/1     Running   0          18h
lokistack-distributor-654f87c5bc-qhkhv              1/1     Running   0          18h
lokistack-distributor-654f87c5bc-skxgm              1/1     Running   0          18h
lokistack-gateway-796dc6ff7-c54gz                   2/2     Running   0          18h
lokistack-index-gateway-0                           1/1     Running   0          18h
lokistack-index-gateway-1                           1/1     Running   0          18h
lokistack-ingester-0                                1/1     Running   0          18h
lokistack-ingester-1                                1/1     Running   0          18h
lokistack-ingester-2                                1/1     Running   0          18h
lokistack-querier-66747dc666-6vh5x                  1/1     Running   0          18h
lokistack-querier-66747dc666-cjr45                  1/1     Running   0          18h
lokistack-querier-66747dc666-xh8rq                  1/1     Running   0          18h
lokistack-query-frontend-85c6db4fbd-b2xfb           1/1     Running   0          18h
lokistack-query-frontend-85c6db4fbd-jm94f           1/1     Running   0          18h
5.2. Network Observablity Operator architecture
Review the Network Observability Operator architecture, detailing how the FlowCollector resource manages the eBPF agent, which collects and enriches flows, sending the data to Loki for storage or Prometheus for metrics.
The Network Observability Operator provides the FlowCollector API, which is instantiated at installation and configured to reconcile the eBPF agent, the flowlogs-pipeline, and the netobserv-plugin components. Only a single FlowCollector per cluster is supported.
The eBPF agent runs on each cluster node with some privileges to collect network flows. The flowlogs-pipeline receives the network flows data and enriches the data with Kubernetes identifiers. If you choose to use Loki, the flowlogs-pipeline sends flow logs data to Loki for storing and indexing. The netobserv-plugin, which is a dynamic OpenShift Container Platform web console plugin, queries Loki to fetch network flows data. Cluster-admins can view the data in the web console.
If you do not use Loki, you can generate metrics with Prometheus. Those metrics and their related dashboards are accessible in the web console. For more information, see "Network Observability without Loki".
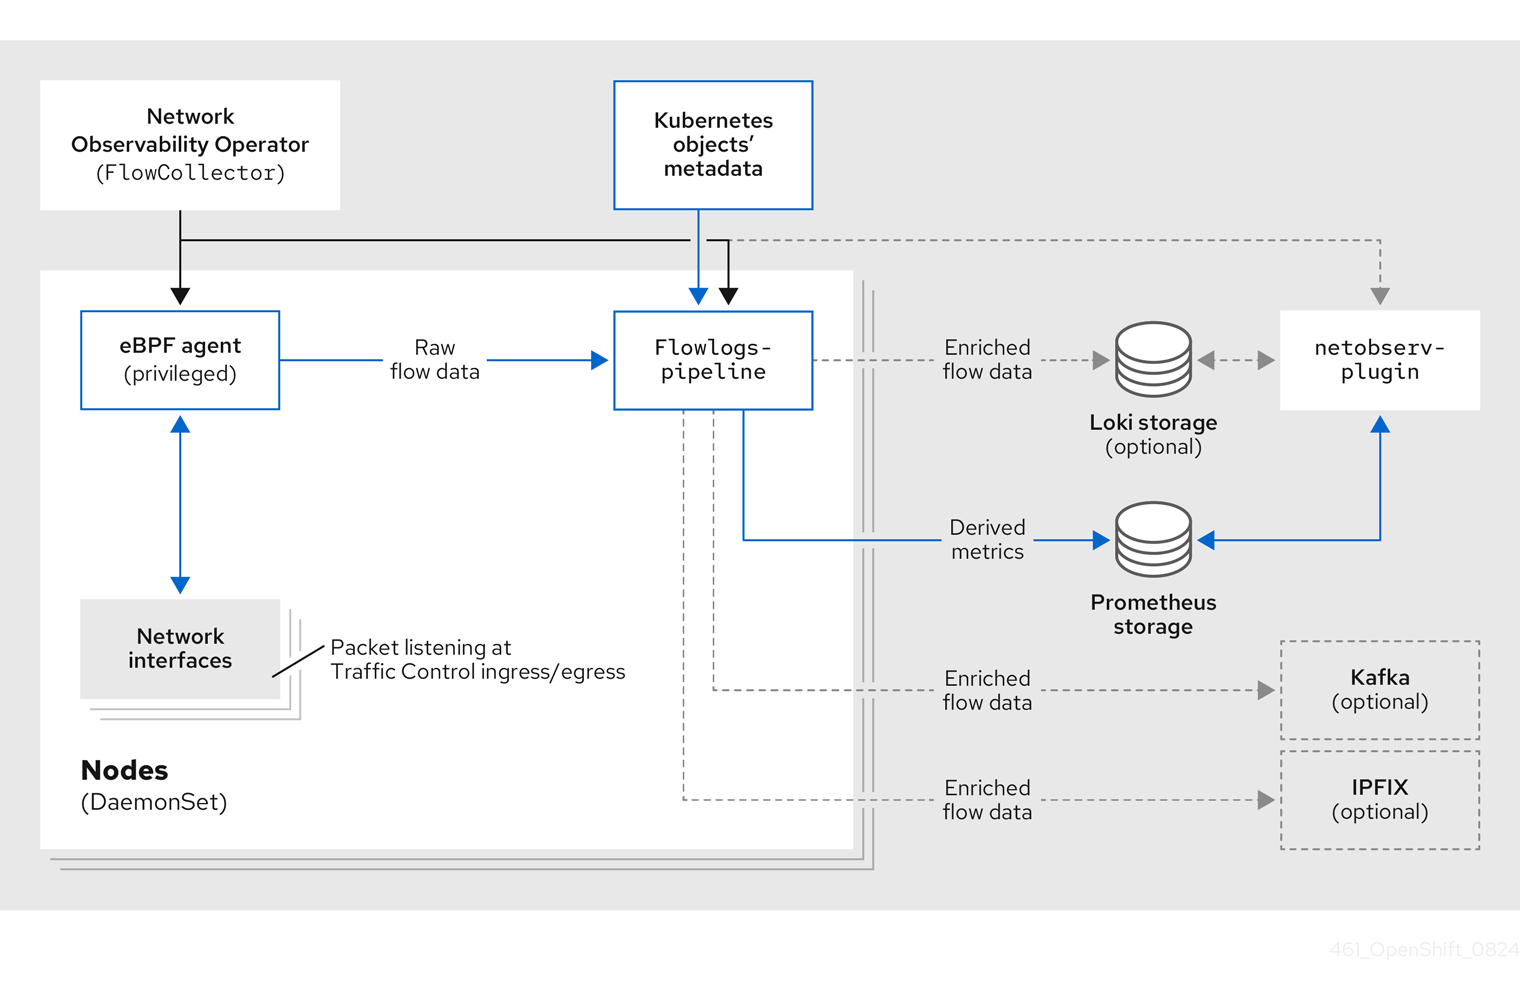
There are three deployment model options for the Network Observability Operator.
The Network Observability Operator does not manage Loki or other data stores. You must install Loki separately by using the Loki Operator. If you use Kafka, you must install it separately by using the Kafka Operator.
- Service deployment model
-
When the
spec.deploymentModelfield in theFlowCollectorresource is set toService, agents are deployed per node as daemon sets. Theflowlogs-pipelineis a standard deployment with a service. You can scale theflowlogs-pipelinecomponent by using thespec.processor.consumerReplicasfield. - Direct deployment model
-
When the
spec.deploymentModelfield is set toDirect, agents and theflowlogs-pipelineare both deployed per node as daemon sets. This model is suitable for technology assessments and small clusters. However, it is less memory-efficient in large clusters because each instance offlowlogs-pipelinecaches the same cluster information. - Kafka deployment model (optional)
If you use the Kafka option, the
eBPF agentsends the network flow data to Kafka. You can scale theflowlogs-pipelinecomponent by using thespec.processor.consumerReplicasfield. Theflowlogs-pipelinecomponent reads from the Kafka topic before sending data to Loki, as shown in the following diagram.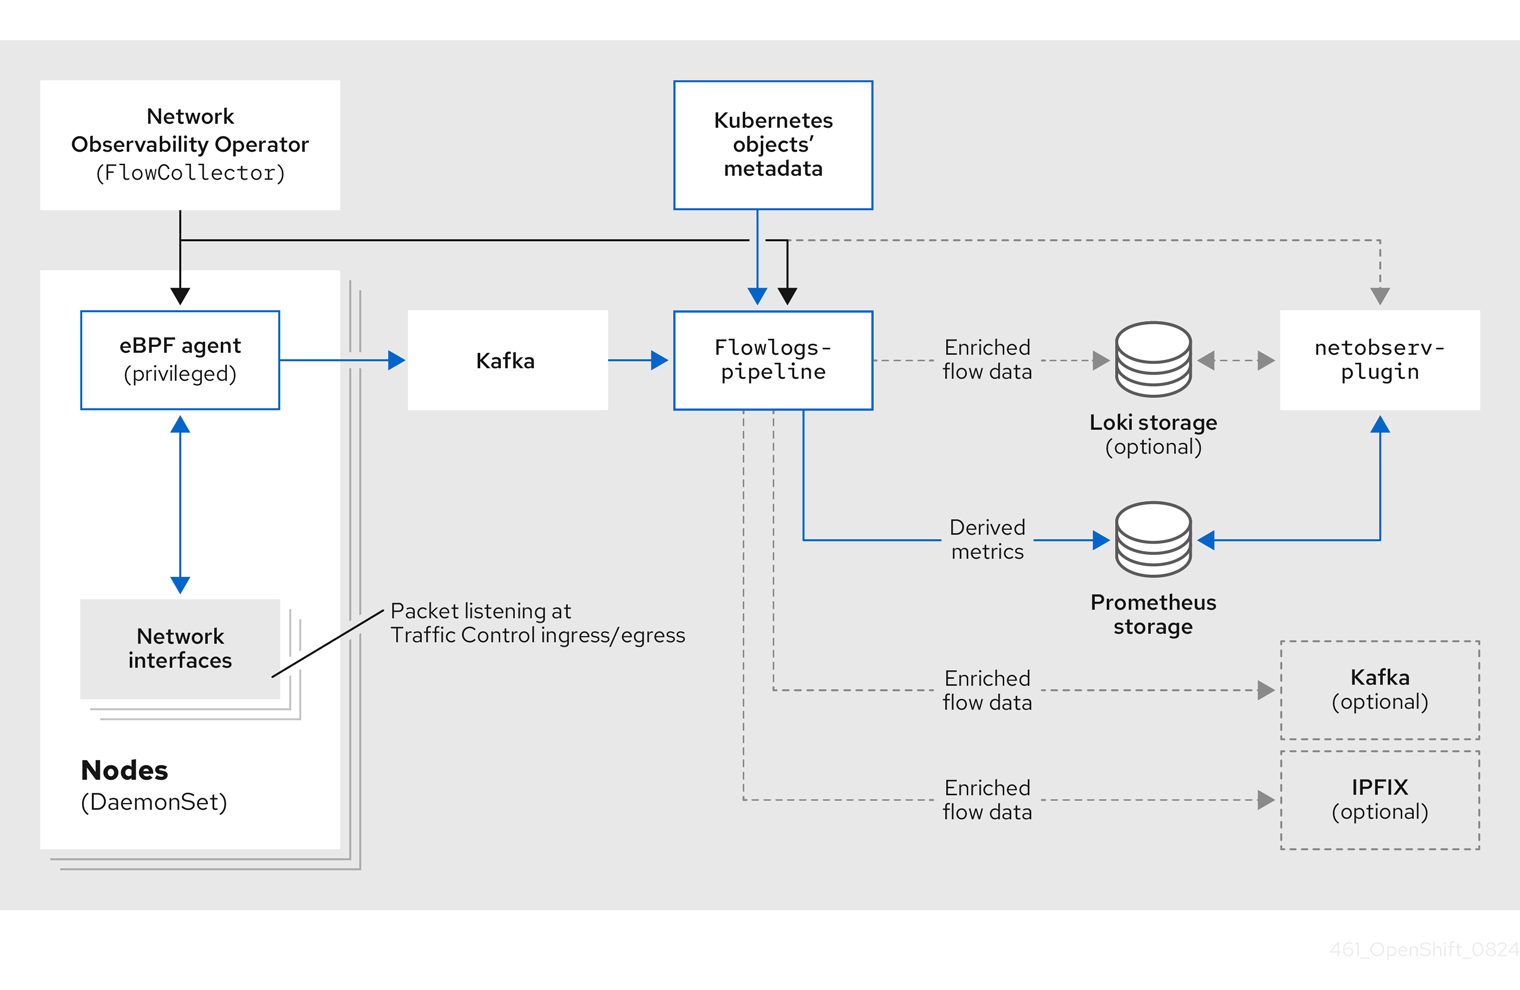
5.3. Viewing Network Observability Operator status and configuration
Inspect the current status, configuration details, and generated resources of the Network Observability Operator by using the oc describe flowcollector/cluster command.
Procedure
Run the following command to view the status and configuration of the Network Observability Operator:
$ oc describe flowcollector/cluster