Chapter 1. Monitoring overview
1.1. About OpenShift Container Platform monitoring
OpenShift Container Platform includes a preconfigured, preinstalled, and self-updating monitoring stack that provides monitoring for core platform components. You also have the option to enable monitoring for user-defined projects.
A cluster administrator can configure the monitoring stack with the supported configurations. OpenShift Container Platform delivers monitoring best practices out of the box.
A set of alerts are included by default that immediately notify cluster administrators about issues with a cluster. Default dashboards in the OpenShift Container Platform web console include visual representations of cluster metrics to help you to quickly understand the state of your cluster.
With the OpenShift Container Platform web console, you can view and manage metrics, alerts, and review monitoring dashboards. OpenShift Container Platform also provides access to third-party interfaces, such as Prometheus, Alertmanager, and Grafana.
After installing OpenShift Container Platform 4.7, cluster administrators can optionally enable monitoring for user-defined projects. By using this feature, cluster administrators, developers, and other users can specify how services and pods are monitored in their own projects. You can also expose custom application metrics for horizontal pod autoscaling. As a cluster administrator, you can find answers to common problems such as user metrics unavailability and Prometheus consuming a lot of disk space in troubleshooting monitoring issues.
1.2. Understanding the monitoring stack
The OpenShift Container Platform monitoring stack is based on the Prometheus open source project and its wider ecosystem. The monitoring stack includes the following:
-
Default platform monitoring components. A set of platform monitoring components are installed in the
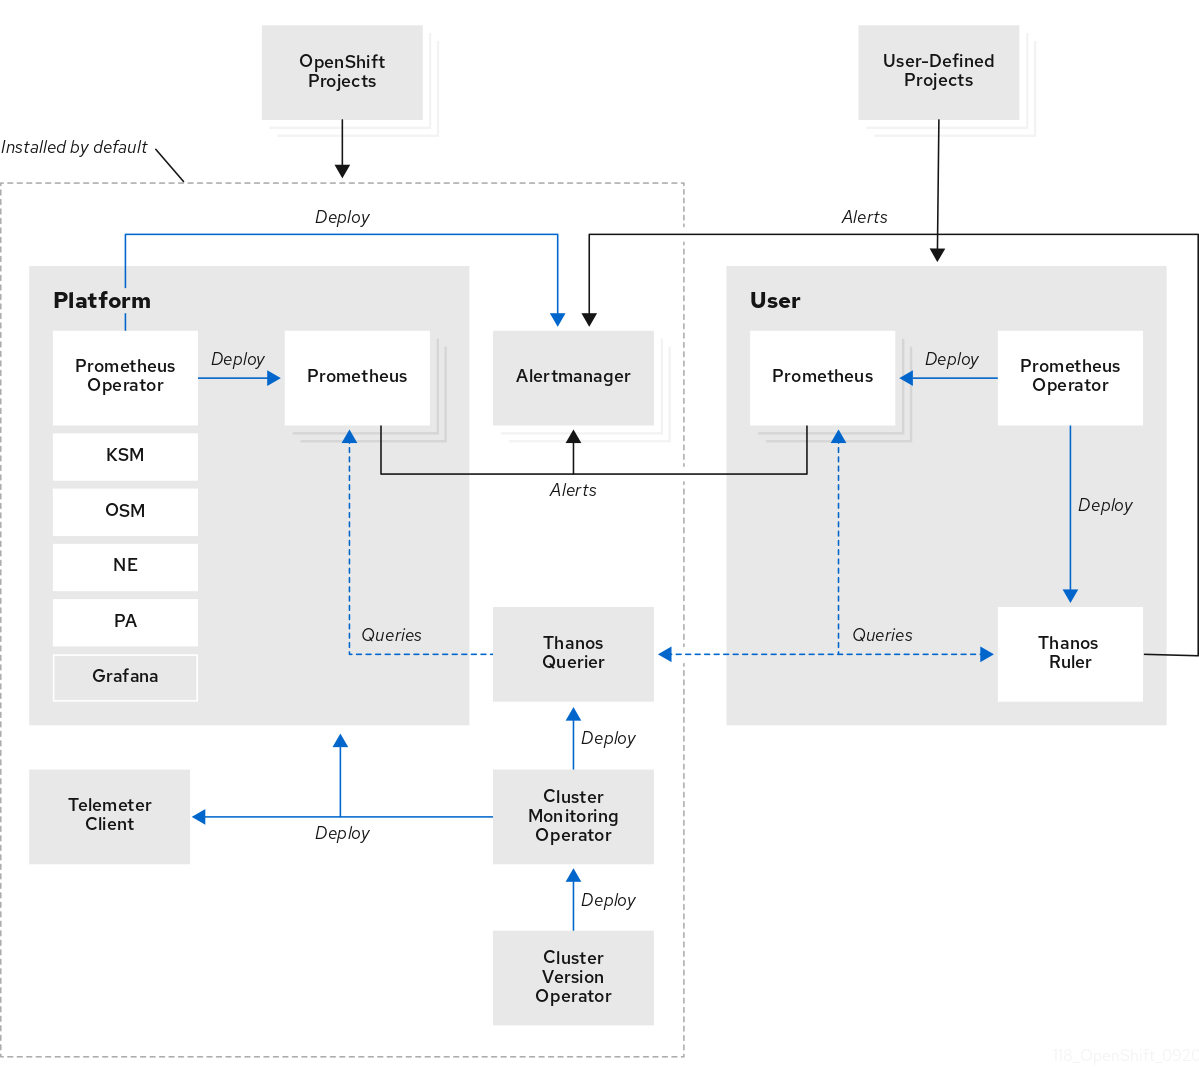
openshift-monitoringproject by default during an OpenShift Container Platform installation. This provides monitoring for core OpenShift Container Platform components including Kubernetes services. The default monitoring stack also enables remote health monitoring for clusters. These components are illustrated in the Installed by default section in the following diagram. -
Components for monitoring user-defined projects. After optionally enabling monitoring for user-defined projects, additional monitoring components are installed in the
openshift-user-workload-monitoringproject. This provides monitoring for user-defined projects. These components are illustrated in the User section in the following diagram.

1.2.1. Default monitoring components
By default, the OpenShift Container Platform 4.7 monitoring stack includes these components:
| Component | Description |
|---|---|
| Cluster Monitoring Operator | The Cluster Monitoring Operator (CMO) is a central component of the monitoring stack. It deploys and manages Prometheus instances, the Thanos Querier, the Telemeter Client, and metrics targets and ensures that they are up to date. The CMO is deployed by the Cluster Version Operator (CVO). |
| Prometheus Operator |
The Prometheus Operator (PO) in the |
| Prometheus | Prometheus is the monitoring system on which the OpenShift Container Platform monitoring stack is based. Prometheus is a time-series database and a rule evaluation engine for metrics. Prometheus sends alerts to Alertmanager for processing. |
| Prometheus Adapter |
The Prometheus Adapter (PA in the preceding diagram) translates Kubernetes node and pod queries for use in Prometheus. The resource metrics that are translated include CPU and memory utilization metrics. The Prometheus Adapter exposes the cluster resource metrics API for horizontal pod autoscaling. The Prometheus Adapter is also used by the |
| Alertmanager | The Alertmanager service handles alerts received from Prometheus. Alertmanager is also responsible for sending the alerts to external notification systems. |
|
|
The |
|
|
The |
|
|
The |
| Thanos Querier | The Thanos Querier aggregates and optionally deduplicates core OpenShift Container Platform metrics and metrics for user-defined projects under a single, multi-tenant interface. |
| Grafana | The Grafana analytics platform provides dashboards for analyzing and visualizing the metrics. The Grafana instance that is provided with the monitoring stack, along with its dashboards, is read-only. |
| Telemeter Client | The Telemeter Client sends a subsection of the data from platform Prometheus instances to Red Hat to facilitate Remote Health Monitoring for clusters. |
All of the components in the monitoring stack are monitored by the stack and are automatically updated when OpenShift Container Platform is updated.
1.2.2. Default monitoring targets
In addition to the components of the stack itself, the default monitoring stack monitors:
- CoreDNS
- Elasticsearch (if Logging is installed)
- etcd
- Fluentd (if Logging is installed)
- HAProxy
- Image registry
- Kubelets
- Kubernetes apiserver
- Kubernetes controller manager
- Kubernetes scheduler
- Metering (if Metering is installed)
- OpenShift apiserver
- OpenShift controller manager
- Operator Lifecycle Manager (OLM)
Each OpenShift Container Platform component is responsible for its monitoring configuration. For problems with the monitoring of an OpenShift Container Platform component, open a Jira issue against that component, not against the general monitoring component.
Other OpenShift Container Platform framework components might be exposing metrics as well. For details, see their respective documentation.
1.2.3. Components for monitoring user-defined projects
OpenShift Container Platform 4.7 includes an optional enhancement to the monitoring stack that enables you to monitor services and pods in user-defined projects. This feature includes the following components:
| Component | Description |
|---|---|
| Prometheus Operator |
The Prometheus Operator (PO) in the |
| Prometheus | Prometheus is the monitoring system through which monitoring is provided for user-defined projects. Prometheus sends alerts to Alertmanager for processing. |
| Thanos Ruler | The Thanos Ruler is a rule evaluation engine for Prometheus that is deployed as a separate process. In OpenShift Container Platform 4.7, Thanos Ruler provides rule and alerting evaluation for the monitoring of user-defined projects. |
The components in the preceding table are deployed after monitoring is enabled for user-defined projects.
All of the components in the monitoring stack are monitored by the stack and are automatically updated when OpenShift Container Platform is updated.
1.2.4. Monitoring targets for user-defined projects
When monitoring is enabled for user-defined projects, you can monitor:
- Metrics provided through service endpoints in user-defined projects.
- Pods running in user-defined projects.