Chapter 41. Installing and configuring kdump
41.1. Installing kdump
The kdump service is installed and activated by default on the new versions of RHEL 8 installations.
41.1.1. What is kdump
kdump is a service that provides a crash dumping mechanism and generates a crash dump or a vmcore dump file. vmcore includes the contents of the system memory for analysis and troubleshooting. kdump uses the kexec system call to boot into the second kernel, capture kernel, without a reboot. This kernel captures the contents of the crashed kernel’s memory and saves it into a file. The second kernel is available in a reserved part of the system memory.
A kernel crash dump can be the only information available if a system failure occur. Therefore, operational kdump is important in mission-critical environments. Red Hat advises to regularly update and test kexec-tools in your normal kernel update cycle. This is important when you install new kernel features.
If you have multiple kernels on a machine, you can enable kdump for all installed kernels or for specified kernels only. When you install kdump, the system creates a default /etc/kdump.conf file. /etc/kdump.conf includes the default minimum kdump configuration, which you can edit to customize the kdump configuration.
41.1.2. Installing kdump using Anaconda
The Anaconda installer provides a graphical interface screen for kdump configuration during an interactive installation. You can enable kdump and reserve the required amount of memory.
Procedure
On the Anaconda installer, click KDUMP and enable
kdump: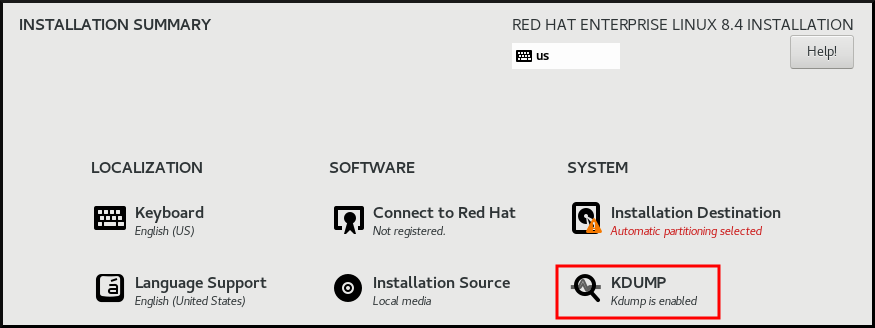
- In Kdump Memory Reservation, select Manual` if you must customize the memory reserve.
In KDUMP > Memory To Be Reserved (MB), set the required memory reserve for
kdump.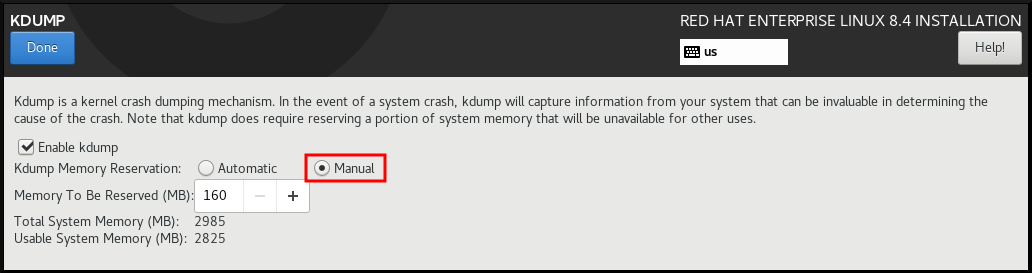
41.1.3. Installing kdump on the command line
Installation options such as custom Kickstart installations, in some cases does not install or enable kdump by default. The following procedure helps you enable kdump in this case.
Prerequisites
- An active RHEL subscription.
-
A repository containing the
kexec-toolspackage for your system CPU architecture. -
Fulfilled requirements for
kdumpconfigurations and targets. For details, see Supported kdump configurations and targets.
Procedure
Check if
kdumpis installed on your system:# rpm -q kexec-toolsOutput if the package is installed:
kexec-tools-2.0.17-11.el8.x86_64Output if the package is not installed:
package kexec-tools is not installedInstall
kdumpand other necessary packages:# dnf install kexec-tools
From kernel-3.10.0-693.el7 onwards, the Intel IOMMU driver is supported for kdump. For kernel-3.10.0-514[.XYZ].el7 and early versions, you must ensure that Intel IOMMU is disabled to prevent an unresponsive capture kernel.
41.2. Configuring kdump on the command line
The memory for kdump is reserved during the system boot. You can configure the memory size in the system’s Grand Unified Bootloader (GRUB) configuration file. The memory size depends on the crashkernel= value specified in the configuration file and the size of the physical memory of system.
41.2.1. Estimating the kdump size
When planning and building your kdump environment, it is important to know the space required by the crash dump file.
The makedumpfile --mem-usage command estimates the space required by the crash dump file. It generates a memory usage report. The report helps you decide the dump level and the pages that are safe to exclude.
Procedure
Enter the following command to generate a memory usage report:
# makedumpfile --mem-usage /proc/kcore


TYPE        PAGES    EXCLUDABLE    DESCRIPTION
-------------------------------------------------------------
ZERO          501635      yes        Pages filled with zero
CACHE         51657       yes        Cache pages
CACHE_PRIVATE 5442        yes        Cache pages + private
USER          16301       yes        User process pages
FREE          77738211    yes        Free pages
KERN_DATA     1333192     no         Dumpable kernel data
The makedumpfile --mem-usage command reports required memory in pages. This means that you must calculate the size of memory in use against the kernel page size.
41.2.2. Configuring kdump memory usage
The memory reservation for kdump occurs during the system boot. The memory size is set in the system’s Grand Unified Bootloader (GRUB) configuration. The memory size depends on the value of the crashkernel= option specified in the configuration file and the size of the system physical memory.
You can define the crashkernel= option in many ways. You can specify the crashkernel= value or configure the auto option. The crashkernel=auto parameter reserves memory automatically, based on the total amount of physical memory in the system. When configured, the kernel automatically reserves an appropriate amount of required memory for the capture kernel. This helps to prevent Out-of-Memory (OOM) errors.
The automatic memory allocation for kdump varies based on system hardware architecture and available memory size.
If the system has less than the minimum memory threshold for automatic allocation, you can configure the amount of reserved memory manually.
Prerequisites
- You have root permissions on the system.
-
Fulfilled requirements for
kdumpconfigurations and targets. For details, see Supported kdump configurations and targets.
Procedure
Prepare the
crashkernel=option.For example, to reserve 128 MB of memory, use the following:
crashkernel=128MAlternatively, you can set the amount of reserved memory to a variable depending on the total amount of installed memory. The syntax for memory reservation into a variable is
crashkernel=<range1>:<size1>,<range2>:<size2>. For example:crashkernel=512M-2G:64M,2G-:128MThe command reserves 64 MB of memory if the total amount of system memory is in the range of 512 MB and 2 GB. If the total amount of memory is more than 2 GB, the memory reserve is 128 MB.
Offset the reserved memory.
Some systems require to reserve memory with a certain fixed offset because the
crashkernelreservation happens early, and you may need to reserve more memory for special usage. When you define an offset, the reserved memory begins there. To offset the reserved memory, use the following syntax:crashkernel=128M@16MIn this example,
kdumpreserves 128 MB of memory starting at 16 MB (physical address0x01000000). If you set the offset parameter to 0 or omit entirely,kdumpoffsets the reserved memory automatically. You can also use this syntax when setting a variable memory reservation. In that case, the offset is always specified last. For example:crashkernel=512M-2G:64M,2G-:128M@16M
Apply the
crashkernel=option to your boot loader configuration:# grubby --update-kernel=ALL --args="crashkernel=<value>"Replace
<value>with the value of thecrashkernel=option that you prepared in the previous step.
41.2.3. Configuring the kdump target
The crash dump is usually stored as a file in a local file system, written directly to a device. Optionally, you can send crash dump over a network by using the NFS or SSH protocols. Only one of these options to preserve a crash dump file can be set at a time. The default behavior is to store it in the /var/crash/ directory of the local file system.
Prerequisites
- You have root permissions on the system.
-
Fulfilled requirements for
kdumpconfigurations and targets. For details, see Supported kdump configurations and targets.
Procedure
To store the crash dump file in
/var/crash/directory of the local file system, edit the/etc/kdump.conffile and specify the path:path /var/crashThe option
path /var/crashrepresents the path to the file system in whichkdumpsaves the crash dump file.Note-
When you specify a dump target in the
/etc/kdump.conffile, then the path is relative to the specified dump target. -
When you do not specify a dump target in the
/etc/kdump.conffile, then the path represents the absolute path from the root directory.
Depending on the file system mounted in the current system, the dump target and the adjusted dump path are configured automatically.
-
When you specify a dump target in the
To secure the crash dump file and the accompanying files produced by
kdump, you should set up proper attributes for the target destination directory, such as user permissions and SELinux contexts. Additionally, you can define a script, for examplekdump_post.shin thekdump.conffile as follows:kdump_post <path_to_kdump_post.sh>The
kdump_postdirective specifies a shell script or a command that executes afterkdumphas completed capturing and saving a crash dump to the specified destination. You can use this mechanism to extend the functionality ofkdumpto perform actions including the adjustments in file permissions.-
The
kdumptarget configuration
# *grep -v ^# /etc/kdump.conf | grep -v ^$*
ext4 /dev/mapper/vg00-varcrashvol
path /var/crash
core_collector makedumpfile -c --message-level 1 -d 31
The dump target is specified (ext4 /dev/mapper/vg00-varcrashvol), and, therefore, it is mounted at /var/crash. The path option is also set to /var/crash. Therefore, the kdump saves the vmcore file in the /var/crash/var/crash directory.
To change the local directory for saving the crash dump, edit the
/etc/kdump.confconfiguration file as arootuser:-
Remove the hash sign (
#) from the beginning of the#path /var/crashline. Replace the value with the intended directory path. For example:
path /usr/local/coresImportantIn RHEL 8, the directory defined as the
kdumptarget using thepathdirective must exist when thekdumpsystemdservice starts to avoid failures. Unlike in earlier versions of RHEL, the directory is no longer created automatically if it does not exist when the service starts.
-
Remove the hash sign (
To write the file to a different partition, edit the
/etc/kdump.confconfiguration file:Remove the hash sign (
#) from the beginning of the#ext4line, depending on your choice.-
device name (the
#ext4 /dev/vg/lv_kdumpline) -
file system label (the
#ext4 LABEL=/bootline) -
UUID (the
#ext4 UUID=03138356-5e61-4ab3-b58e-27507ac41937line)
-
device name (the
Change the file system type and the device name, label or UUID, to the required values. The correct syntax for specifying UUID values is both
UUID="correct-uuid"andUUID=correct-uuid. For example:ext4 UUID=03138356-5e61-4ab3-b58e-27507ac41937ImportantIt is recommended to specify storage devices by using a
LABEL=orUUID=. Disk device names such as/dev/sda3are not guaranteed to be consistent across reboot.When you use Direct Access Storage Device (DASD) on IBM Z hardware, ensure the dump devices are correctly specified in
/etc/dasd.confbefore proceeding withkdump.
To write the crash dump directly to a device, edit the
/etc/kdump.confconfiguration file:-
Remove the hash sign (
#) from the beginning of the#raw /dev/vg/lv_kdumpline. Replace the value with the intended device name. For example:
raw /dev/sdb1
-
Remove the hash sign (
To store the crash dump to a remote machine by using the
NFSprotocol:-
Remove the hash sign (
#) from the beginning of the#nfs my.server.com:/export/tmpline. Replace the value with a valid hostname and directory path. For example:
nfs penguin.example.com:/export/coresRestart the
kdumpservice for the changes to take effect:sudo systemctl restart kdump.serviceNoteWhile using the NFS directive to specify the NFS target,
kdump.serviceautomatically attempts to mount the NFS target to check the disk space. There is no need to mount the NFS target in advance. To preventkdump.servicefrom mounting the target, use thedracut_args --mountdirective inkdump.conf. This will enablekdump.serviceto call thedracututility with the--mountargument to specify the NFS target.
-
Remove the hash sign (
To store the crash dump to a remote machine by using the SSH protocol:
-
Remove the hash sign (
#) from the beginning of the#ssh user@my.server.comline. - Replace the value with a valid username and hostname.
Include your SSH key in the configuration.
-
Remove the hash sign from the beginning of the
#sshkey /root/.ssh/kdump_id_rsaline. Change the value to the location of a key valid on the server you are trying to dump to. For example:
ssh john@penguin.example.com
sshkey /root/.ssh/mykey
-
Remove the hash sign from the beginning of the
-
Remove the hash sign (
41.2.4. Configuring the kdump core collector
The kdump service uses a core_collector program to capture the crash dump image. In RHEL, the makedumpfile utility is the default core collector. It helps shrink the dump file by:
- Compressing the size of a crash dump file and copying only necessary pages by using various dump levels.
- Excluding unnecessary crash dump pages.
- Filtering the page types to be included in the crash dump.
Crash dump file compression is enabled by default in the RHEL 7 and above.
If you need to customize the crash dump file compression, follow this procedure.
Syntax
core_collector makedumpfile -l --message-level 1 -d 31Options
-
-c,-lor-p: specify compress dump file format by each page using either,zlibfor-coption,lzofor-loption orsnappyfor-poption. -
-d(dump_level): excludes pages so that they are not copied to the dump file. -
--message-level: specify the message types. You can restrict outputs printed by specifyingmessage_levelwith this option. For example, specifying 7 asmessage_levelprints common messages and error messages. The maximum value ofmessage_levelis 31.
Prerequisites
- You have root permissions on the system.
-
Fulfilled requirements for
kdumpconfigurations and targets. For details, see Supported kdump configurations and targets.
Procedure
-
As a
root, edit the/etc/kdump.confconfiguration file and remove the hash sign ("#") from the beginning of the#core_collector makedumpfile -l --message-level 1 -d 31. - Enter the following command to enable crash dump file compression:
core_collector makedumpfile -l --message-level 1 -d 31
The -l option specifies the dump compressed file format. The -d option specifies dump level as 31. The --message-level option specifies message level as 1.
Also, consider following examples with the -c and -p options:
To compress a crash dump file by using
-c:core_collector makedumpfile -c -d 31 --message-level 1To compress a crash dump file by using
-p:core_collector makedumpfile -p -d 31 --message-level 1
41.2.5. Configuring the kdump default failure responses
By default, when kdump fails to create a crash dump file at the configured target location, the system reboots and the dump is lost in the process. You can change the default failure response and configure kdump to perform a different operation when it fails to save the core dump to the primary target. The additional actions are:
dump_to_rootfs-
Saves the core dump to the
rootfile system. reboot- Reboots the system, losing the core dump in the process.
halt- Stops the system, losing the core dump in the process.
poweroff- Power the system off, losing the core dump in the process.
shell-
Runs a shell session from within the
initramfs, you can record the core dump manually. final_action-
Enables additional operations such as
reboot,halt, andpoweroffafter a successfulkdumpor when shell ordump_to_rootfsfailure action completes. The default isreboot. failure_action-
Specifies the action to perform when a dump might fail in a kernel crash. The default is
reboot.
Prerequisites
- Root permissions.
-
Fulfilled requirements for
kdumpconfigurations and targets. For details, see Supported kdump configurations and targets.
Procedure
-
As a
rootuser, remove the hash sign (#) from the beginning of the#failure_actionline in the/etc/kdump.confconfiguration file. Replace the value with a required action.
failure_action poweroff
41.2.6. Configuration file for kdump
The configuration file for kdump kernel is /etc/sysconfig/kdump. This file controls the kdump kernel command line parameters. For most configurations, use the default options. However, in some scenarios you might need to modify certain parameters to control the kdump kernel behavior. For example, modifying the KDUMP_COMMANDLINE_APPEND option to append the kdump kernel command-line to obtain a detailed debugging output or the KDUMP_COMMANDLINE_REMOVE option to remove arguments from the kdump command line.
KDUMP_COMMANDLINE_REMOVEThis option removes arguments from the current
kdumpcommand line. It removes parameters that can causekdumperrors orkdumpkernel boot failures. These parameters might have been parsed from the previousKDUMP_COMMANDLINEprocess or inherited from the/proc/cmdlinefile.When this variable is not configured, it inherits all values from the
/proc/cmdlinefile. Configuring this option also provides information that is helpful in debugging an issue.To remove certain arguments, add them to
KDUMP_COMMANDLINE_REMOVEas follows:
# KDUMP_COMMANDLINE_REMOVE="hugepages hugepagesz slub_debug quiet log_buf_len swiotlb"KDUMP_COMMANDLINE_APPENDThis option appends arguments to the current command line. These arguments might have been parsed by the previous
KDUMP_COMMANDLINE_REMOVEvariable.For the
kdumpkernel, disabling certain modules such asmce,cgroup,numa,hest_disablecan help prevent kernel errors. These modules can consume a significant part of the kernel memory reserved forkdumpor causekdumpkernel boot failures.To disable memory
cgroupson thekdumpkernel command line, run the command as follows:
KDUMP_COMMANDLINE_APPEND="cgroup_disable=memory"41.2.7. Testing the kdump configuration
After configuring kdump, you must manually test a system crash and ensure that the vmcore file is generated in the defined kdump target. The vmcore file is captured from the context of the freshly booted kernel. Therefore, vmcore has critical information for debugging a kernel crash.
Do not test kdump on active production systems. The commands to test kdump will cause the kernel to crash with loss of data. Depending on your system architecture, ensure that you schedule significant maintenance time because kdump testing might require several reboots with a long boot time.
If the vmcore file is not generated during the kdump test, identify and fix issues before you run the test again for a successful kdump testing.
If you make any manual system modifications, you must test the kdump configuration at the end of any system modification. For example, if you make any of the following changes, ensure that you test the kdump configuration for an optimal kdump performances for:
- Package upgrades.
- Hardware level changes, for example, storage or networking changes.
- Firmware upgrades.
- New installation and application upgrades that include third party modules.
- If you use the hot-plugging mechanism to add more memory on hardware that support this mechanism.
-
After you make changes in the
/etc/kdump.confor/etc/sysconfig/kdumpfile.
Prerequisites
- You have root permissions on the system.
-
You have saved all important data. The commands to test
kdumpcause the kernel to crash with loss of data. - You have scheduled significant machine maintenance time depending on the system architecture.
Procedure
Enable the
kdumpservice:# kdumpctl restartCheck the status of the
kdumpservice with thekdumpctl:# kdumpctl status kdump:Kdump is operationalOptionally, if you use the
systemctlcommand, the output prints in thesystemdjournal.Start a kernel crash to test the
kdumpconfiguration. Thesysrq-triggerkey combination causes the kernel to crash and might reboot the system if required.# echo c > /proc/sysrq-triggerOn a kernel reboot, the
address-YYYY-MM-DD-HH:MM:SS/vmcorefile is created at the location you have specified in the/etc/kdump.conffile. The default is/var/crash/.
41.2.8. Files produced by kdump after system crash
After your system crashes, the kdump service captures the kernel memory in a dump file (vmcore) and it also generates additional diagnostic files to aid in troubleshooting and postmortem analysis.
Files produced by kdump:
-
vmcore- main kernel memory dump file containing system memory at the time of the crash. It includes data as per the configuration of thecore_collectorprogram specified inkdumpconfiguration. By default the kernel data structures, process information, stack traces, and other diagnostic information. -
vmcore-dmesg.txt- contents of the kernel ring buffer log (dmesg) from the primary kernel that panicked. -
kexec-dmesg.log- has kernel and system log messages from the execution of the secondarykexeckernel that collects thevmcoredata.
41.2.9. Enabling and disabling the kdump service
You can configure to enable or disable the kdump functionality on a specific kernel or on all installed kernels. You must routinely test the kdump functionality and validate its operates correctly.
Prerequisites
- You have root permissions on the system.
-
You have completed
kdumprequirements for configurations and targets. See Supported kdump configurations and targets. -
All configurations for installing
kdumpare set up as required.
Procedure
Enable the
kdumpservice formulti-user.target:# systemctl enable kdump.serviceStart the service in the current session:
# systemctl start kdump.serviceStop the
kdumpservice:# systemctl stop kdump.serviceDisable the
kdumpservice:# systemctl disable kdump.service
It is recommended to set kptr_restrict=1 as default. When kptr_restrict is set to (1) as default, the kdumpctl service loads the crash kernel regardless of whether the Kernel Address Space Layout (KASLR) is enabled.
If kptr_restrict is not set to 1 and KASLR is enabled, the contents of /proc/kore file are generated as all zeros. The kdumpctl service fails to access the /proc/kcore file and load the crash kernel. The kexec-kdump-howto.txt file displays a warning message, which recommends you to set kptr_restrict=1. Verify for the following in the sysctl.conf file to ensure that kdumpctl service loads the crash kernel:
-
Kernel
kptr_restrict=1in thesysctl.conffile.
41.2.10. Preventing kernel drivers from loading for kdump
You can control the capture kernel from loading certain kernel drivers by adding the KDUMP_COMMANDLINE_APPEND= variable in the /etc/sysconfig/kdump configuration file. By using this method, you can prevent the kdump initial RAM disk image initramfs from loading the specified kernel module. This helps to prevent the out-of-memory (OOM) killer errors or other crash kernel failures.
You can append the KDUMP_COMMANDLINE_APPEND= variable by using one of the following configuration options:
-
rd.driver.blacklist=<modules> -
modprobe.blacklist=<modules>
Prerequisites
- You have root permissions on the system.
Procedure
Display the list of modules that are loaded to the currently running kernel. Select the kernel module that you intend to block from loading:
$ lsmod

Module                  Size  Used by
fuse                  126976  3
xt_CHECKSUM            16384  1
ipt_MASQUERADE         16384  1
uinput                 20480  1
xt_conntrack           16384  1
Update the
KDUMP_COMMANDLINE_APPEND=variable in the/etc/sysconfig/kdumpfile. For example:KDUMP_COMMANDLINE_APPEND="rd.driver.blacklist=hv_vmbus,hv_storvsc,hv_utils,hv_netvsc,hid-hyperv"Also, consider the following example by using the
modprobe.blacklist=<modules>configuration option:KDUMP_COMMANDLINE_APPEND="modprobe.blacklist=emcp modprobe.blacklist=bnx2fc modprobe.blacklist=libfcoe modprobe.blacklist=fcoe"Restart the
kdumpservice:# systemctl restart kdump
41.2.11. Running kdump on systems with encrypted disk
When you run a LUKS encrypted partition, systems require certain amount of available memory. If the system has less than the required amount of available memory, the cryptsetup utility fails to mount the partition. As a result, capturing the vmcore file to an encrypted target location fails in the second kernel (capture kernel).
The kdumpctl estimate command helps you estimate the amount of memory you need for kdump. kdumpctl estimate prints the recommended crashkernel value, which is the most suitable memory size required for kdump.
The recommended crashkernel value is calculated based on the current kernel size, kernel module, initramfs, and the LUKS encrypted target memory requirement.
If you are using the custom crashkernel= option, kdumpctl estimate prints the LUKS required size value. The value is the memory size required for LUKS encrypted target.
Procedure
Print the estimate
crashkernel=value:# *kdumpctl estimate* Encrypted kdump target requires extra memory, assuming using the keyslot with minimum memory requirement Reserved crashkernel: 256M Recommended crashkernel: 652M Kernel image size: 47M Kernel modules size: 8M Initramfs size: 20M Runtime reservation: 64M LUKS required size: 512M Large modules: <none> WARNING: Current crashkernel size is lower than recommended size 652M.-
Configure the amount of required memory by increasing the
crashkernel=value. - Reboot the system.
If the kdump service still fails to save the dump file to the encrypted target, increase the crashkernel= value as required.
41.3. Enabling kdump
For your RHEL 8 systems, you can configure enabling or disabling the kdump functionality on a specific kernel or on all installed kernels. However, you must routinely test the kdump functionality and validate its working status.
41.3.1. Enabling kdump for all installed kernels
The kdump service starts by enabling kdump.service after the kexec tool is installed. You can enable and start the kdump service for all kernels installed on the machine.
Prerequisites
- You have administrator privileges.
Procedure
Add the
crashkernel=command-line parameter to all installed kernels:# grubby --update-kernel=ALL --args="crashkernel=xxM"xxMis the required memory in megabytes.Reboot the system:
# rebootEnable the
kdumpservice:# systemctl enable --now kdump.service
Verification
Check that the
kdumpservice is running:# systemctl status kdump.service ○ kdump.service - Crash recovery kernel arming Loaded: loaded (/usr/lib/systemd/system/kdump.service; enabled; vendor preset: disabled) Active: active (live)
41.3.2. Enabling kdump for a specific installed kernel
You can enable the kdump service for a specific kernel on the machine.
Prerequisites
- You have administrator privileges.
Procedure
List the kernels installed on the machine.
# ls -a /boot/vmlinuz-*
/boot/vmlinuz-0-rescue-2930657cd0dc43c2b75db480e5e5b4a9
/boot/vmlinuz-4.18.0-330.el8.x86_64
/boot/vmlinuz-4.18.0-330.rt7.111.el8.x86_64
Add a specific
kdumpkernel to the system’s Grand Unified Bootloader (GRUB) configuration.For example:
# grubby --update-kernel=vmlinuz-4.18.0-330.el8.x86_64 --args="crashkernel=xxM"xxMis the required memory reserve in megabytes.Enable the
kdumpservice.# systemctl enable --now kdump.service
Verification
Check that the
kdumpservice is running.# systemctl status kdump.service ○ kdump.service - Crash recovery kernel arming Loaded: loaded (/usr/lib/systemd/system/kdump.service; enabled; vendor preset: disabled) Active: active (live)
41.3.3. Disabling the kdump service
You can stop the kdump.service and disable the service from starting on your RHEL 8 systems.
Prerequisites
-
Fulfilled requirements for
kdumpconfigurations and targets. For details, see Supported kdump configurations and targets. -
All configurations for installing
kdumpare set up according to your needs. For details, see Installing kdump.
Procedure
To stop the
kdumpservice in the current session:# systemctl stop kdump.serviceTo disable the
kdumpservice:# systemctl disable kdump.service
It is recommended to set kptr_restrict=1 as default. When kptr_restrict is set to (1) as default, the kdumpctl service loads the crash kernel regardless of whether the Kernel Address Space Layout (KASLR) is enabled.
If kptr_restrict is not set to 1 and KASLR is enabled, the contents of /proc/kore file are generated as all zeros. The kdumpctl service fails to access the /proc/kcore file and load the crash kernel. The kexec-kdump-howto.txt file displays a warning message, which recommends you to set kptr_restrict=1. Verify for the following in the sysctl.conf file to ensure that kdumpctl service loads the crash kernel:
-
Kernel
kptr_restrict=1in thesysctl.conffile.
41.4. Configuring kdump in the web console
You can set up and test the kdump configuration by using the RHEL 8 web console. The web console can enable the kdump service at boot time. With the web console, you can configure the reserved memory for kdump and to select the vmcore saving location in an uncompressed or compressed format.
41.4.1. Configuring kdump memory usage and target location in web console
You can configure the memory reserve for the kdump kernel and also specify the target location to capture the vmcore dump file with the RHEL web console interface.
Prerequisites
- The web console must be installed and accessible. For details, see Installing the web console.
Procedure
-
In the web console, open the tab and start the
kdumpservice by setting the Kernel crash dump switch to on. Configure the
kdumpmemory usage in the terminal, for example:$ sudo grubby --update-kernel ALL --args crashkernel=512MRestart the system to apply the changes.
- In the Kernel dump tab, click Edit at the end of the Crash dump location field.
Specify the target directory for saving the
vmcoredump file:- For a local filesystem, select Local Filesystem from the drop-down menu.
For a remote system by using the SSH protocol, select Remote over SSH from the drop-down menu and specify the following fields:
- In the Server field, enter the remote server address.
- In the SSH key field, enter the SSH key location.
- In the Directory field, enter the target directory.
For a remote system by using the NFS protocol, select Remote over NFS from the drop-down menu and specify the following fields:
- In the Server field, enter the remote server address.
- In the Export field, enter the location of the shared folder of an NFS server.
In the Directory field, enter the target directory.
NoteYou can reduce the size of the
vmcorefile by selecting the Compression checkbox.
Optional: Display the automation script by clicking View automation script.
A window with the generated script opens. You can browse a shell script and an Ansible playbook generation options tab.
Optional: Copy the script by clicking Copy to clipboard.
You can use this script to apply the same configuration on multiple machines.
Verification
- Click .
Click Crash system under Test kdump settings.
WarningWhen you start the system crash, the kernel operation stops and results in a system crash with data loss.
41.5. Supported kdump configurations and targets
The kdump mechanism is a feature of the Linux kernel that generates a crash dump file when a kernel crash occurs. The kernel dump file has critical information that helps to analyze and determine the root cause of a kernel crash. The crash can be because of various factors, hardware issues or third-party kernel modules problems, to name a few.
By using the provided information and procedures, you can perform the following actions:
- Identify the supported configurations and targets for your RHEL 8 systems.
- Configure kdump.
- Verify kdump operation.
41.5.1. Memory requirements for kdump
For kdump to capture a kernel crash dump and save it for further analysis, a part of the system memory should be permanently reserved for the capture kernel. When reserved, this part of the system memory is not available to the main kernel.
The memory requirements vary based on certain system parameters. One of the major factors is the system’s hardware architecture. To identify the exact machine architecture, such as Intel 64 and AMD64, also known as x86_64, and print it to standard output, use the following command:
$ uname -m
With the stated list of minimum memory requirements, you can set the appropriate memory size to automatically reserve a memory for kdump on the latest available versions. The memory size depends on the system’s architecture and total available physical memory.
| Architecture | Available Memory | Minimum Reserved Memory |
|---|---|---|
|
AMD64 and Intel 64 ( | 1 GB to 4 GB | 192 MB of RAM |
| 4 GB to 64 GB | 256 MB of RAM | |
| 64 GB and more | 512 MB of RAM | |
|
64-bit ARM architecture ( | 2 GB and more | 480 MB of RAM |
|
IBM Power Systems ( | 2 GB to 4 GB | 384 MB of RAM |
| 4 GB to 16 GB | 512 MB of RAM | |
| 16 GB to 64 GB | 1 GB of RAM | |
| 64 GB to 128 GB | 2 GB of RAM | |
| 128 GB and more | 4 GB of RAM | |
|
IBM Z ( | 1 GB to 4 GB | 192 MB of RAM |
| 4 GB to 64 GB | 256 MB of RAM | |
| 64 GB and more | 512 MB of RAM |
On many systems, kdump is able to estimate the amount of required memory and reserve it automatically. This behavior is enabled by default, but only works on systems that have more than a certain amount of total available memory, which varies based on the system architecture.
The automatic configuration of reserved memory based on the total amount of memory in the system is a best effort estimation. The actual required memory might vary due to other factors such as I/O devices. Using not enough of memory might cause debug kernel unable to boot as a capture kernel in the case of kernel panic. To avoid this problem, increase the crash kernel memory sufficiently.
41.5.2. Minimum threshold for automatic memory reservation
By default, the kexec-tools utility configures the crashkernel command line parameter and reserves a certain amount of memory for kdump. On some systems however, it is still possible to assign memory for kdump either by using the crashkernel=auto parameter in the boot loader configuration file, or by enabling this option in the graphical configuration utility. For this automatic reservation to work, a certain amount of total memory needs to be available in the system. The memory requirement varies based on the system’s architecture. If the system memory is less than the specified threshold value, you must configure the memory manually.
| Architecture | Required Memory |
|---|---|
|
AMD64 and Intel 64 ( | 2 GB |
|
IBM Power Systems ( | 2 GB |
|
IBM Z ( | 4 GB |
The crashkernel=auto option in the boot command line is no longer supported on RHEL 9 and later releases.
41.5.3. Supported kdump targets
When a kernel crash occurs, the operating system saves the dump file on the configured or default target location. You can save the dump file either directly to a device, store as a file on a local file system, or send the dump file over a network. With the following list of dump targets, you can know the targets that are currently supported or not supported by kdump.
| Target type | Supported Targets | Unsupported Targets |
|---|---|---|
| Physical storage |
|
|
| Network |
|
|
| Hypervisor |
| |
| File systems | The ext[234], XFS, and NFS file systems. |
The |
| Firmware |
|
41.5.4. Supported kdump filtering levels
To reduce the size of the dump file, kdump uses the makedumpfile core collector to compress the data and also exclude unwanted information, for example, you can remove hugepages and hugetlbfs pages by using the -8 level. The levels that makedumpfile currently supports can be seen in the table for Filtering levels for `kdump` .
| Option | Description |
|---|---|
|
| Zero pages |
|
| Cache pages |
|
| Cache private |
|
| User pages |
|
| Free pages |
41.5.5. Supported default failure responses
By default, when kdump fails to create a core dump, the operating system reboots. However, you can configure kdump to perform a different operation in case it fails to save the core dump to the primary target.
| Option | Description |
|---|---|
|
| Attempt to save the core dump to the root file system. This option is especially useful in combination with a network target: if the network target is unreachable, this option configures kdump to save the core dump locally. The system is rebooted afterwards. |
|
| Reboot the system, losing the core dump in the process. |
|
| Halt the system, losing the core dump in the process. |
|
| Power off the system, losing the core dump in the process. |
|
| Run a shell session from within the initramfs, allowing the user to record the core dump manually. |
|
|
Enable additional operations such as |
41.5.6. Using final_action parameter
When kdump succeeds or if kdump fails to save the vmcore file at the configured target, you can perform additional operations like reboot, halt, and poweroff by using the final_action parameter. If the final_action parameter is not specified, reboot is the default response.
Procedure
To configure
final_action, edit the/etc/kdump.conffile and add one of the following options:-
final_action reboot -
final_action halt -
final_action poweroff
-
Restart the
kdumpservice for the changes to take effect.# kdumpctl restart
41.5.7. Using failure_action parameter
The failure_action parameter specifies the action to perform when a dump fails in the event of a kernel crash. The default action for failure_action is reboot that reboots the system.
The parameter recognizes the following actions to take:
reboot- Reboots the system after a dump failure.
dump_to_rootfs- Saves the dump file on a root file system when a non-root dump target is configured.
halt- Halts the system.
poweroff- Stops the running operations on the system.
shell-
Starts a shell session inside
initramfs, from which you can manually perform additional recovery actions.
Procedure
To configure an action to take if the dump fails, edit the
/etc/kdump.conffile and specify one of thefailure_actionoptions:-
failure_action reboot -
failure_action halt -
failure_action poweroff -
failure_action shell -
failure_action dump_to_rootfs
-
Restart the
kdumpservice for the changes to take effect.# kdumpctl restart
41.6. Testing the kdump configuration
After configuring kdump, you must manually test a system crash and ensure that the vmcore file is generated in the defined kdump target. The vmcore file is captured from the context of the freshly booted kernel. Therefore, vmcore has critical information for debugging a kernel crash.
Do not test kdump on active production systems. The commands to test kdump will cause the kernel to crash with loss of data. Depending on your system architecture, ensure that you schedule significant maintenance time because kdump testing might require several reboots with a long boot time.
If the vmcore file is not generated during the kdump test, identify and fix issues before you run the test again for a successful kdump testing.
If you make any manual system modifications, you must test the kdump configuration at the end of any system modification. For example, if you make any of the following changes, ensure that you test the kdump configuration for an optimal kdump performances for:
- Package upgrades.
- Hardware level changes, for example, storage or networking changes.
- Firmware upgrades.
- New installation and application upgrades that include third party modules.
- If you use the hot-plugging mechanism to add more memory on hardware that support this mechanism.
-
After you make changes in the
/etc/kdump.confor/etc/sysconfig/kdumpfile.
Prerequisites
- You have root permissions on the system.
-
You have saved all important data. The commands to test
kdumpcause the kernel to crash with loss of data. - You have scheduled significant machine maintenance time depending on the system architecture.
Procedure
Enable the
kdumpservice:# kdumpctl restartCheck the status of the
kdumpservice with thekdumpctl:# kdumpctl status kdump:Kdump is operationalOptionally, if you use the
systemctlcommand, the output prints in thesystemdjournal.Start a kernel crash to test the
kdumpconfiguration. Thesysrq-triggerkey combination causes the kernel to crash and might reboot the system if required.# echo c > /proc/sysrq-triggerOn a kernel reboot, the
address-YYYY-MM-DD-HH:MM:SS/vmcorefile is created at the location you have specified in the/etc/kdump.conffile. The default is/var/crash/.
41.7. Using kexec to boot into a different kernel
You can use the kexec system call to enable loading and booting into another kernel from the currently running kernel. kexec performs a function of a boot loader from within the kernel.
The kexec utility loads the kernel and the initramfs image for the kexec system call to boot into another kernel.
The following procedure describes how to manually invoke the kexec system call when using the kexec utility to reboot into another kernel.
Procedure
Run the
kexecutility:# kexec -l /boot/vmlinuz-3.10.0-1040.el7.x86_64 --initrd=/boot/initramfs-3.10.0-1040.el7.x86_64.img --reuse-cmdlineThe command manually loads the kernel and the
initramfsimage for thekexecsystem call.Reboot the system:
# rebootThe command detects the kernel, shuts down all services and then calls the
kexecsystem call to reboot into the kernel you provided in the previous step.
When you use the kexec -e command to reboot your machine into a different kernel, the system does not go through the standard shutdown sequence before starting the next kernel. This can cause data loss or an unresponsive system.
41.8. Preventing kernel drivers from loading for kdump
You can control the capture kernel from loading certain kernel drivers by adding the KDUMP_COMMANDLINE_APPEND= variable in the /etc/sysconfig/kdump configuration file. By using this method, you can prevent the kdump initial RAM disk image initramfs from loading the specified kernel module. This helps to prevent the out-of-memory (OOM) killer errors or other crash kernel failures.
You can append the KDUMP_COMMANDLINE_APPEND= variable by using one of the following configuration options:
-
rd.driver.blacklist=<modules> -
modprobe.blacklist=<modules>
Prerequisites
- You have root permissions on the system.
Procedure
Display the list of modules that are loaded to the currently running kernel. Select the kernel module that you intend to block from loading:
$ lsmod

Module                  Size  Used by
fuse                  126976  3
xt_CHECKSUM            16384  1
ipt_MASQUERADE         16384  1
uinput                 20480  1
xt_conntrack           16384  1
Update the
KDUMP_COMMANDLINE_APPEND=variable in the/etc/sysconfig/kdumpfile. For example:KDUMP_COMMANDLINE_APPEND="rd.driver.blacklist=hv_vmbus,hv_storvsc,hv_utils,hv_netvsc,hid-hyperv"Also, consider the following example by using the
modprobe.blacklist=<modules>configuration option:KDUMP_COMMANDLINE_APPEND="modprobe.blacklist=emcp modprobe.blacklist=bnx2fc modprobe.blacklist=libfcoe modprobe.blacklist=fcoe"Restart the
kdumpservice:# systemctl restart kdump
41.9. Running kdump on systems with encrypted disk
When you run a LUKS encrypted partition, systems require certain amount of available memory. If the system has less than the required amount of available memory, the cryptsetup utility fails to mount the partition. As a result, capturing the vmcore file to an encrypted target location fails in the second kernel (capture kernel).
The kdumpctl estimate command helps you estimate the amount of memory you need for kdump. kdumpctl estimate prints the recommended crashkernel value, which is the most suitable memory size required for kdump.
The recommended crashkernel value is calculated based on the current kernel size, kernel module, initramfs, and the LUKS encrypted target memory requirement.
If you are using the custom crashkernel= option, kdumpctl estimate prints the LUKS required size value. The value is the memory size required for LUKS encrypted target.
Procedure
Print the estimate
crashkernel=value:# *kdumpctl estimate* Encrypted kdump target requires extra memory, assuming using the keyslot with minimum memory requirement Reserved crashkernel: 256M Recommended crashkernel: 652M Kernel image size: 47M Kernel modules size: 8M Initramfs size: 20M Runtime reservation: 64M LUKS required size: 512M Large modules: <none> WARNING: Current crashkernel size is lower than recommended size 652M.-
Configure the amount of required memory by increasing the
crashkernel=value. - Reboot the system.
If the kdump service still fails to save the dump file to the encrypted target, increase the crashkernel= value as required.
41.10. Firmware assisted dump mechanisms
Firmware assisted dump (fadump) is a dump capturing mechanism, provided as an alternative to the kdump mechanism on IBM POWER systems. The kexec and kdump mechanisms are useful for capturing core dumps on AMD64 and Intel 64 systems. However, some hardware, such as mini systems and mainframe computers, uses the onboard firmware to isolate regions of memory and prevent any accidental overwriting of data that is important to the crash analysis. The fadump utility is optimized for the fadump mechanisms and their integration with RHEL on IBM POWER systems.
41.10.1. Firmware assisted dump on IBM PowerPC hardware
The fadump utility captures the vmcore file from a fully-reset system with PCI and I/O devices. This mechanism uses firmware to preserve memory regions during a crash and then reuses the kdump userspace scripts to save the vmcore file. The memory regions consist of all system memory contents, except the boot memory, system registers, and hardware Page Table Entries (PTEs).
The fadump mechanism offers improved reliability over the traditional dump type, by rebooting the partition and using a new kernel to dump the data from the previous kernel crash. The fadump requires an IBM POWER6 processor-based or later version hardware platform.
For further details about the fadump mechanism, including PowerPC specific methods of resetting hardware, see the /usr/share/doc/kexec-tools/fadump-howto.txt file.
The area of memory that is not preserved, known as boot memory, is the amount of RAM required to successfully boot the kernel after a crash event. By default, the boot memory size is 256MB or 5% of total system RAM, whichever is larger.
Unlike kexec-initiated event, the fadump mechanism uses the production kernel to recover a crash dump. When booting after a crash, PowerPC hardware makes the device node /proc/device-tree/rtas/ibm.kernel-dump available to the proc filesystem (procfs). The fadump-aware kdump scripts, check for the stored vmcore, and then complete the system reboot cleanly.
41.10.2. Enabling firmware assisted dump mechanism
You can enhance the crash dumping capabilities of IBM POWER systems by enabling the firmware assisted dump (fadump) mechanism.
In the Secure Boot environment, the GRUB boot loader allocates a boot memory region, known as the Real Mode Area (RMA). The RMA has a size of 512 MB, divided among the boot components. If a component exceeds its size allocation, GRUB fails with an out-of-memory (OOM) error.
Do not enable firmware assisted dump (fadump) mechanism in the Secure Boot environment on RHEL 8.7 and 8.6 versions. The GRUB2 boot loader fails with the following error:
error: ../../grub-core/kern/mm.c:376:out of memory.
Press any key to continue…
The system is recoverable only if you increase the default initramfs size due to the fadump configuration.
For information about workaround methods to recover the system, see the System boot ends in GRUB Out of Memory (OOM) article.
Procedure
-
Install and configure
kdump. Enable the
fadump=onkernel option:# grubby --update-kernel=ALL --args="fadump=on"Optional: If you want to specify reserved boot memory instead of using the defaults, enable the
crashkernel=xxMoption, wherexxis the amount of the memory required in megabytes:# grubby --update-kernel=ALL --args="crashkernel=xxM fadump=on"ImportantWhen specifying boot configuration options, test all boot configuration options before you run them. If the
kdumpkernel fails to boot, increase the value specified incrashkernel=argument gradually to set an appropriate value.
41.10.3. Firmware assisted dump mechanisms on IBM Z hardware
IBM Z systems support the following firmware assisted dump mechanisms:
-
Stand-alone dump (sadump) -
VMDUMP
The kdump infrastructure is supported and utilized on IBM Z systems. However, using one of the firmware assisted dump (fadump) methods for IBM Z has the following benefits:
-
The system console initiates and controls the
sadumpmechanism, and stores it on anIPLbootable device. -
The
VMDUMPmechanism is similar tosadump. This tool is also initiated from the system console, but retrieves the resulting dump from hardware and copies it to the system for analysis. -
These methods (similarly to other hardware based dump mechanisms) have the ability to capture the state of a machine in the early boot phase, before the
kdumpservice starts. -
Although
VMDUMPcontains a mechanism to receive the dump file into a Red Hat Enterprise Linux system, the configuration and control ofVMDUMPis managed from the IBM Z Hardware console.
41.10.4. Using sadump on Fujitsu PRIMEQUEST systems
The Fujitsu sadump mechanism provides a fallback dump capture when kdump is unable to complete successfully. You can manually invoke sadump from the system Management Board (MMB) interface. Using MMB, configure kdump like for an Intel 64 or AMD64 server and then proceed to enable sadump.
Procedure
Add or edit the following lines in the
/etc/sysctl.conffile to ensure thatkdumpstarts as expected forsadump:kernel.panic=0 kernel.unknown_nmi_panic=1WarningIn particular, ensure that after
kdump, the system does not reboot. If the system reboots afterkdumphas failed to save thevmcorefile, then it is not possible to invoke thesadump.Set the
failure_actionparameter in/etc/kdump.confappropriately ashaltorshell.failure_action shell
41.11. Analyzing a core dump
To identify the cause of the system crash, you can use the crash utility, which provides an interactive prompt similar to the GNU Debugger (GDB). By using crash, you can analyze a core dump created by kdump, netdump, diskdump, or xendump and a running Linux system. Alternatively, you can use the Kernel Oops Analyzer or the Kdump Helper tool.
41.11.1. Installing the crash utility
With the provided information, understand the required packages and the procedure to install the crash utility. The crash utility might not be installed by default on your RHEL 8 systems. crash is a tool to interactively analyze a system’s state while it is running or after a kernel crash occurs and a core dump file is created. The core dump file is also known as the vmcore file.
Procedure
Enable the relevant repositories:
# subscription-manager repos --enable baseos repository# subscription-manager repos --enable appstream repository# subscription-manager repos --enable rhel-8-for-x86_64-baseos-debug-rpmsInstall the
crashpackage:# yum install crashInstall the
kernel-debuginfopackage:# yum install kernel-debuginfoThe package
kernel-debuginfowill correspond to the running kernel and provides the data necessary for the dump analysis.
41.11.2. Running and exiting the crash utility
The crash utility is a powerful tool for analyzing kdump. By running crash on a crash dump file, you can gain insights into the system’s state at the time of the crash, identify the root cause of the issue, and troubleshoot kernel-related problems.
Prerequisites
-
Identify the currently running kernel (for example
4.18.0-5.el8.x86_64).
Procedure
To start the
crashutility, pass the following two necessary parameters:-
The debug-info (a decompressed vmlinuz image), for example
/usr/lib/debug/lib/modules/4.18.0-5.el8.x86_64/vmlinuxprovided through a specifickernel-debuginfopackage. The actual vmcore file, for example
/var/crash/127.0.0.1-2018-10-06-14:05:33/vmcore.The resulting
crashcommand will be as follows:# crash /usr/lib/debug/lib/modules/4.18.0-5.el8.x86_64/vmlinux /var/crash/127.0.0.1-2018-10-06-14:05:33/vmcoreUse the same <kernel> version that was captured by
kdump.Example 41.1. Running the crash utility
The following example shows analyzing a core dump created on October 6 2018 at 14:05 PM, using the 4.18.0-5.el8.x86_64 kernel.
...
WARNING: kernel relocated [202MB]: patching 90160 gdb minimal_symbol values

      KERNEL: /usr/lib/debug/lib/modules/4.18.0-5.el8.x86_64/vmlinux
    DUMPFILE: /var/crash/127.0.0.1-2018-10-06-14:05:33/vmcore  [PARTIAL DUMP]
        CPUS: 2
        DATE: Sat Oct  6 14:05:16 2018
      UPTIME: 01:03:57
LOAD AVERAGE: 0.00, 0.00, 0.00
       TASKS: 586
    NODENAME: localhost.localdomain
     RELEASE: 4.18.0-5.el8.x86_64
     VERSION: #1 SMP Wed Aug 29 11:51:55 UTC 2018
     MACHINE: x86_64  (2904 Mhz)
      MEMORY: 2.9 GB
       PANIC: "sysrq: SysRq : Trigger a crash"
         PID: 10635
     COMMAND: "bash"
        TASK: ffff8d6c84271800  [THREAD_INFO: ffff8d6c84271800]
         CPU: 1
       STATE: TASK_RUNNING (SYSRQ)

crash>
-
The debug-info (a decompressed vmlinuz image), for example
To exit the interactive prompt and stop
crash, typeexitorq.crash> exit ~]#
The crash command is also utilized as a powerful tool for debugging a live system. However, you must use it with caution to avoid system-level issues.
41.11.3. Displaying various indicators in the crash utility
Use the crash utility to display various indicators, such as a kernel message buffer, a backtrace, a process status, virtual memory information and open files.
Displaying the message buffer
To display the kernel message buffer, type the
logcommand at the interactive prompt:crash> log ... several lines omitted ... EIP: 0060:[<c068124f>] EFLAGS: 00010096 CPU: 2 EIP is at sysrq_handle_crash+0xf/0x20 EAX: 00000063 EBX: 00000063 ECX: c09e1c8c EDX: 00000000 ESI: c0a09ca0 EDI: 00000286 EBP: 00000000 ESP: ef4dbf24 DS: 007b ES: 007b FS: 00d8 GS: 00e0 SS: 0068 Process bash (pid: 5591, ti=ef4da000 task=f196d560 task.ti=ef4da000) Stack: c068146b c0960891 c0968653 00000003 00000000 00000002 efade5c0 c06814d0 <0> fffffffb c068150f b7776000 f2600c40 c0569ec4 ef4dbf9c 00000002 b7776000 <0> efade5c0 00000002 b7776000 c0569e60 c051de50 ef4dbf9c f196d560 ef4dbfb4 Call Trace: [<c068146b>] ? __handle_sysrq+0xfb/0x160 [<c06814d0>] ? write_sysrq_trigger+0x0/0x50 [<c068150f>] ? write_sysrq_trigger+0x3f/0x50 [<c0569ec4>] ? proc_reg_write+0x64/0xa0 [<c0569e60>] ? proc_reg_write+0x0/0xa0 [<c051de50>] ? vfs_write+0xa0/0x190 [<c051e8d1>] ? sys_write+0x41/0x70 [<c0409adc>] ? syscall_call+0x7/0xb Code: a0 c0 01 0f b6 41 03 19 d2 f7 d2 83 e2 03 83 e0 cf c1 e2 04 09 d0 88 41 03 f3 c3 90 c7 05 c8 1b 9e c0 01 00 00 00 0f ae f8 89 f6 <c6> 05 00 00 00 00 01 c3 89 f6 8d bc 27 00 00 00 00 8d 50 d0 83 EIP: [<c068124f>] sysrq_handle_crash+0xf/0x20 SS:ESP 0068:ef4dbf24 CR2: 0000000000000000Type
help logfor more information about the command usage.NoteThe kernel message buffer includes the most essential information about the system crash. It is always dumped first in to the
vmcore-dmesg.txtfile. If you fail to obtain the fullvmcorefile, for example, due to insufficient space on the target location, you can obtain the required information from the kernel message buffer. By default,vmcore-dmesg.txtis placed in the/var/crash/directory.
Displaying a backtrace
To display the kernel stack trace, use the
btcommand.crash> bt PID: 5591 TASK: f196d560 CPU: 2 COMMAND: "bash" #0 [ef4dbdcc] crash_kexec at c0494922 #1 [ef4dbe20] oops_end at c080e402 #2 [ef4dbe34] no_context at c043089d #3 [ef4dbe58] bad_area at c0430b26 #4 [ef4dbe6c] do_page_fault at c080fb9b #5 [ef4dbee4] error_code (via page_fault) at c080d809 EAX: 00000063 EBX: 00000063 ECX: c09e1c8c EDX: 00000000 EBP: 00000000 DS: 007b ESI: c0a09ca0 ES: 007b EDI: 00000286 GS: 00e0 CS: 0060 EIP: c068124f ERR: ffffffff EFLAGS: 00010096 #6 [ef4dbf18] sysrq_handle_crash at c068124f #7 [ef4dbf24] __handle_sysrq at c0681469 #8 [ef4dbf48] write_sysrq_trigger at c068150a #9 [ef4dbf54] proc_reg_write at c0569ec2 #10 [ef4dbf74] vfs_write at c051de4e #11 [ef4dbf94] sys_write at c051e8cc #12 [ef4dbfb0] system_call at c0409ad5 EAX: ffffffda EBX: 00000001 ECX: b7776000 EDX: 00000002 DS: 007b ESI: 00000002 ES: 007b EDI: b7776000 SS: 007b ESP: bfcb2088 EBP: bfcb20b4 GS: 0033 CS: 0073 EIP: 00edc416 ERR: 00000004 EFLAGS: 00000246Type
bt <pid>to display the backtrace of a specific process or typehelp btfor more information aboutbtusage.
Displaying a process status
To display the status of processes in the system, use the
pscommand.crash> ps PID PPID CPU TASK ST %MEM VSZ RSS COMM > 0 0 0 c09dc560 RU 0.0 0 0 [swapper] > 0 0 1 f7072030 RU 0.0 0 0 [swapper] 0 0 2 f70a3a90 RU 0.0 0 0 [swapper] > 0 0 3 f70ac560 RU 0.0 0 0 [swapper] 1 0 1 f705ba90 IN 0.0 2828 1424 init ... several lines omitted ... 5566 1 1 f2592560 IN 0.0 12876 784 auditd 5567 1 2 ef427560 IN 0.0 12876 784 auditd 5587 5132 0 f196d030 IN 0.0 11064 3184 sshd > 5591 5587 2 f196d560 RU 0.0 5084 1648 bashUse
ps <pid>to display the status of a single specific process. Use help ps for more information aboutpsusage.
Displaying virtual memory information
To display basic virtual memory information, type the
vmcommand at the interactive prompt.crash> vm PID: 5591 TASK: f196d560 CPU: 2 COMMAND: "bash" MM PGD RSS TOTAL_VM f19b5900 ef9c6000 1648k 5084k VMA START END FLAGS FILE f1bb0310 242000 260000 8000875 /lib/ld-2.12.so f26af0b8 260000 261000 8100871 /lib/ld-2.12.so efbc275c 261000 262000 8100873 /lib/ld-2.12.so efbc2a18 268000 3ed000 8000075 /lib/libc-2.12.so efbc23d8 3ed000 3ee000 8000070 /lib/libc-2.12.so efbc2888 3ee000 3f0000 8100071 /lib/libc-2.12.so efbc2cd4 3f0000 3f1000 8100073 /lib/libc-2.12.so efbc243c 3f1000 3f4000 100073 efbc28ec 3f6000 3f9000 8000075 /lib/libdl-2.12.so efbc2568 3f9000 3fa000 8100071 /lib/libdl-2.12.so efbc2f2c 3fa000 3fb000 8100073 /lib/libdl-2.12.so f26af888 7e6000 7fc000 8000075 /lib/libtinfo.so.5.7 f26aff2c 7fc000 7ff000 8100073 /lib/libtinfo.so.5.7 efbc211c d83000 d8f000 8000075 /lib/libnss_files-2.12.so efbc2504 d8f000 d90000 8100071 /lib/libnss_files-2.12.so efbc2950 d90000 d91000 8100073 /lib/libnss_files-2.12.so f26afe00 edc000 edd000 4040075 f1bb0a18 8047000 8118000 8001875 /bin/bash f1bb01e4 8118000 811d000 8101873 /bin/bash f1bb0c70 811d000 8122000 100073 f26afae0 9fd9000 9ffa000 100073 ... several lines omitted ...Use
vm <pid>to display information about a single specific process, or usehelp vmfor more information aboutvmusage.
Displaying open files
To display information about open files, use the
filescommand.crash> files PID: 5591 TASK: f196d560 CPU: 2 COMMAND: "bash" ROOT: / CWD: /root FD FILE DENTRY INODE TYPE PATH 0 f734f640 eedc2c6c eecd6048 CHR /pts/0 1 efade5c0 eee14090 f00431d4 REG /proc/sysrq-trigger 2 f734f640 eedc2c6c eecd6048 CHR /pts/0 10 f734f640 eedc2c6c eecd6048 CHR /pts/0 255 f734f640 eedc2c6c eecd6048 CHR /pts/0Use
files <pid>to display files opened by only one selected process, or usehelp filesfor more information aboutfilesusage.
41.11.4. Using Kernel Oops Analyzer
The Kernel Oops Analyzer tool analyzes the crash dump by comparing the oops messages with known issues in the knowledge base.
Prerequisites
-
An
oopsmessage is secured to feed the Kernel Oops Analyzer.
Procedure
- Access the Kernel Oops Analyzer tool.
To diagnose a kernel crash issue, upload a kernel oops log generated in
vmcore.-
Alternatively, you can diagnose a kernel crash issue by providing a text message or a
vmcore-dmesg.txtas an input.
-
Alternatively, you can diagnose a kernel crash issue by providing a text message or a
-
Click
DETECTto compare theoopsmessage based on information from themakedumpfileagainst known solutions.
41.11.5. The Kdump Helper tool
The Kdump Helper tool helps to set up the kdump using the provided information. Kdump Helper generates a configuration script based on your preferences. Initiating and running the script on your server sets up the kdump service.
41.12. Using early kdump to capture boot time crashes
Early kdump is a feature of the kdump mechanism that captures the vmcore file if a system or kernel crash occurs during the early phases of the boot process before the system services start. Early kdump loads the crash kernel and the initramfs of crash kernel in the memory much earlier.
A kernel crash can sometimes occur during the early boot phase before the kdump service starts and is able to capture and save the contents of the crashed kernel memory. Therefore, crucial information related to the crash that is important for troubleshooting is lost. To address this problem, you can use the early kdump feature, which is a part of the kdump service.
41.12.1. Enabling early kdump
The early kdump feature sets up the crash kernel and the initial RAM disk image (initramfs) to load early enough to capture the vmcore information for an early crash. This helps to eliminate the risk of losing information about the early boot kernel crashes.
Prerequisites
- An active RHEL subscription.
-
A repository containing the
kexec-toolspackage for your system CPU architecture. -
Fulfilled
kdumpconfiguration and targets requirements. For more information see, Supported kdump configurations and targets.
Procedure
Verify that the
kdumpservice is enabled and active:# systemctl is-enabled kdump.service && systemctl is-active kdump.service enabled activeIf
kdumpis not enabled and running, set all required configurations and verify thatkdumpservice is enabled.Rebuild the
initramfsimage of the booting kernel with theearly kdumpfunctionality:# dracut -f --add earlykdumpAdd the
rd.earlykdumpkernel command line parameter:# grubby --update-kernel=/boot/vmlinuz-$(uname -r) --args="rd.earlykdump"Reboot the system to reflect the changes:
# reboot
Verification
Verify that
rd.earlykdumpis successfully added andearly kdumpfeature is enabled:# cat /proc/cmdline BOOT_IMAGE=(hd0,msdos1)/vmlinuz-4.18.0-187.el8.x86_64 root=/dev/mapper/rhel-root ro crashkernel=auto resume=/dev/mapper/rhel-swap rd.lvm.lv=rhel/root rd.lvm.lv=rhel/swap rhgb quiet rd.earlykdump # journalctl -x | grep early-kdump Mar 20 15:44:41 redhat dracut-cmdline[304]: early-kdump is enabled. Mar 20 15:44:42 redhat dracut-cmdline[304]: kexec: loaded early-kdump kernel