このコンテンツは選択した言語では利用できません。
17.3. Monitoring Red Hat Gluster Storage Trusted Storage Pool
17.3.1. Configuring Nagios
Note
configure-gluster-nagios command, ensure that all the Red Hat Gluster Storage nodes are configured as mentioned in Section 17.2.2, “Configuring Red Hat Gluster Storage Nodes for Nagios”.
- Execute the
configure-gluster-nagioscommand manually on the Nagios server using the following command:# configure-gluster-nagios -c cluster-name -H HostName-or-IP-addressFor-c, provide a cluster name (a logical name for the cluster) and for-H, provide the host name or ip address of a node in the Red Hat Gluster Storage trusted storage pool. - Perform the steps given below when
configure-gluster-nagioscommand runs:- Confirm the configuration when prompted.
- Enter the current Nagios server host name or IP address to be configured all the nodes.
- Confirm restarting Nagios server when prompted.
# configure-gluster-nagios -c demo-cluster -H HostName-or-IP-address
Cluster configurations changed
Changes :
Hostgroup demo-cluster - ADD
Host demo-cluster - ADD
  Service - Volume Utilization - vol-1 -ADD
  Service - Volume Split-Brain - vol-1 -ADD
  Service - Volume Status - vol-1 -ADD
  Service - Volume Utilization - vol-2 -ADD
  Service - Volume Status - vol-2 -ADD
  Service - Cluster Utilization -ADD
  Service - Cluster - Quorum -ADD
  Service - Cluster Auto Config -ADD
Host Host_Name - ADD
  Service - Brick Utilization - /bricks/vol-1-5 -ADD
  Service - Brick - /bricks/vol-1-5 -ADD
  Service - Brick Utilization - /bricks/vol-1-6 -ADD
  Service - Brick - /bricks/vol-1-6 -ADD
  Service - Brick Utilization - /bricks/vol-2-3 -ADD
  Service - Brick - /bricks/vol-2-3 -ADD
Are you sure, you want to commit the changes? (Yes, No) [Yes]:
Enter Nagios server address [Nagios_Server_Address]:
Cluster configurations synced successfully from host ip-address
Do you want to restart Nagios to start monitoring newly discovered entities? (Yes, No) [Yes]:
Nagios re-started successfully
All the hosts, volumes and bricks are added and displayed.
- Login to the Nagios server GUI using the following URL.
https://NagiosServer-HostName-or-IPaddress/nagiosNote
- The default Nagios user name and password is nagiosadmin / nagiosadmin.
- You can manually update/discover the services by executing the
configure-gluster-nagioscommand or by runningCluster Auto Configservice through Nagios Server GUI. - If the node with which auto-discovery was performed is down or removed from the cluster, run the
configure-gluster-nagioscommand with a different node address to continue discovering or monitoring the nodes and services. - If new nodes or services are added, removed, or if snapshot restore was performed on Red Hat Gluster Storage node, run
configure-gluster-nagioscommand.
17.3.2. Verifying the Configuration
- Verify the updated configurations using the following command:
# nagios -v /etc/nagios/nagios.cfgIf error occurs, verify the parameters set in/etc/nagios/nagios.cfgand update the configuration files. - Restart Nagios server using the following command:
# service nagios restart - Log into the Nagios server GUI using the following URL with the Nagios Administrator user name and password.
https://NagiosServer-HostName-or-IPaddress/nagiosNote
To change the default password, see Changing Nagios Password section in Red Hat Gluster Storage Administration Guide. - Click Services in the left pane of the Nagios server GUI and verify the list of hosts and services displayed.

Figure 17.3. Nagios Services
17.3.3. Using Nagios Server GUI
https://NagiosServer-HostName-or-IPaddress/nagios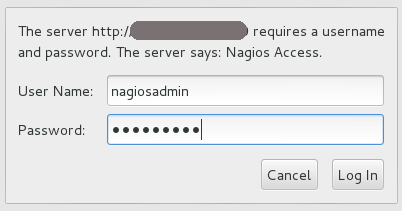
Figure 17.4. Nagios Login
To view the overview of the hosts and services being monitored, click Tactical Overview in the left pane. The overview of Network Outages, Hosts, Services, and Monitoring Features are displayed.
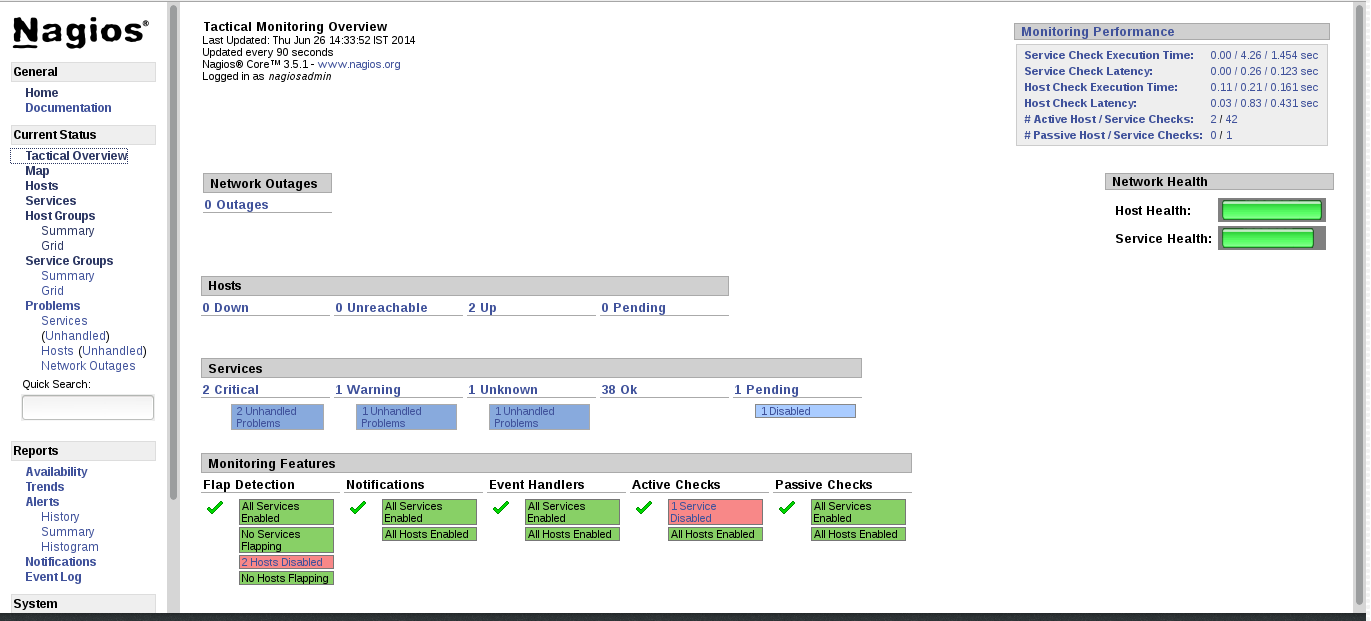
Figure 17.5. Tactical Overview
To view the status summary of all the hosts, click Summary under Host Groups in the left pane.
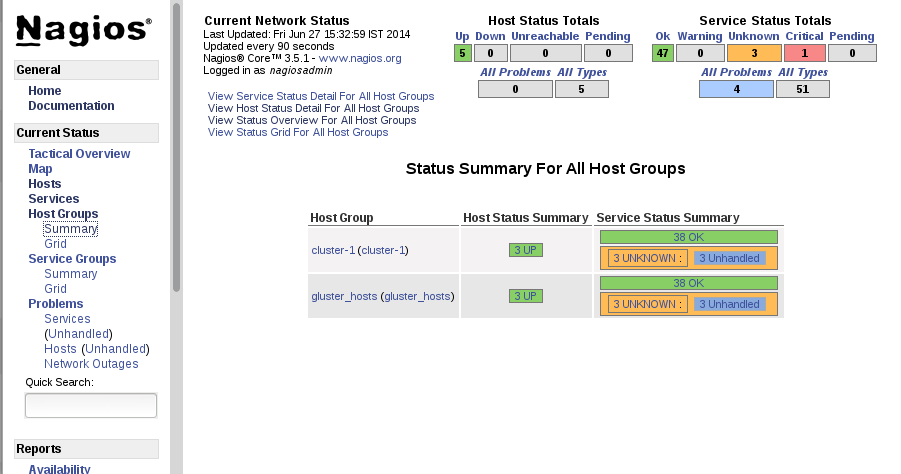
Figure 17.6. Host Groups Summary
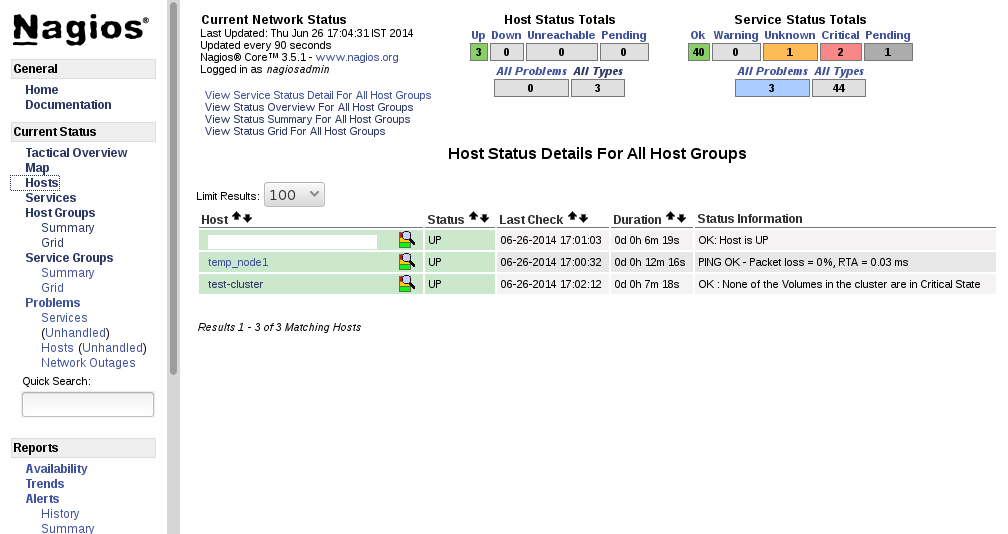
Figure 17.7. Host Status
Note
To view the list of all hosts and their service status click Services in the left pane.
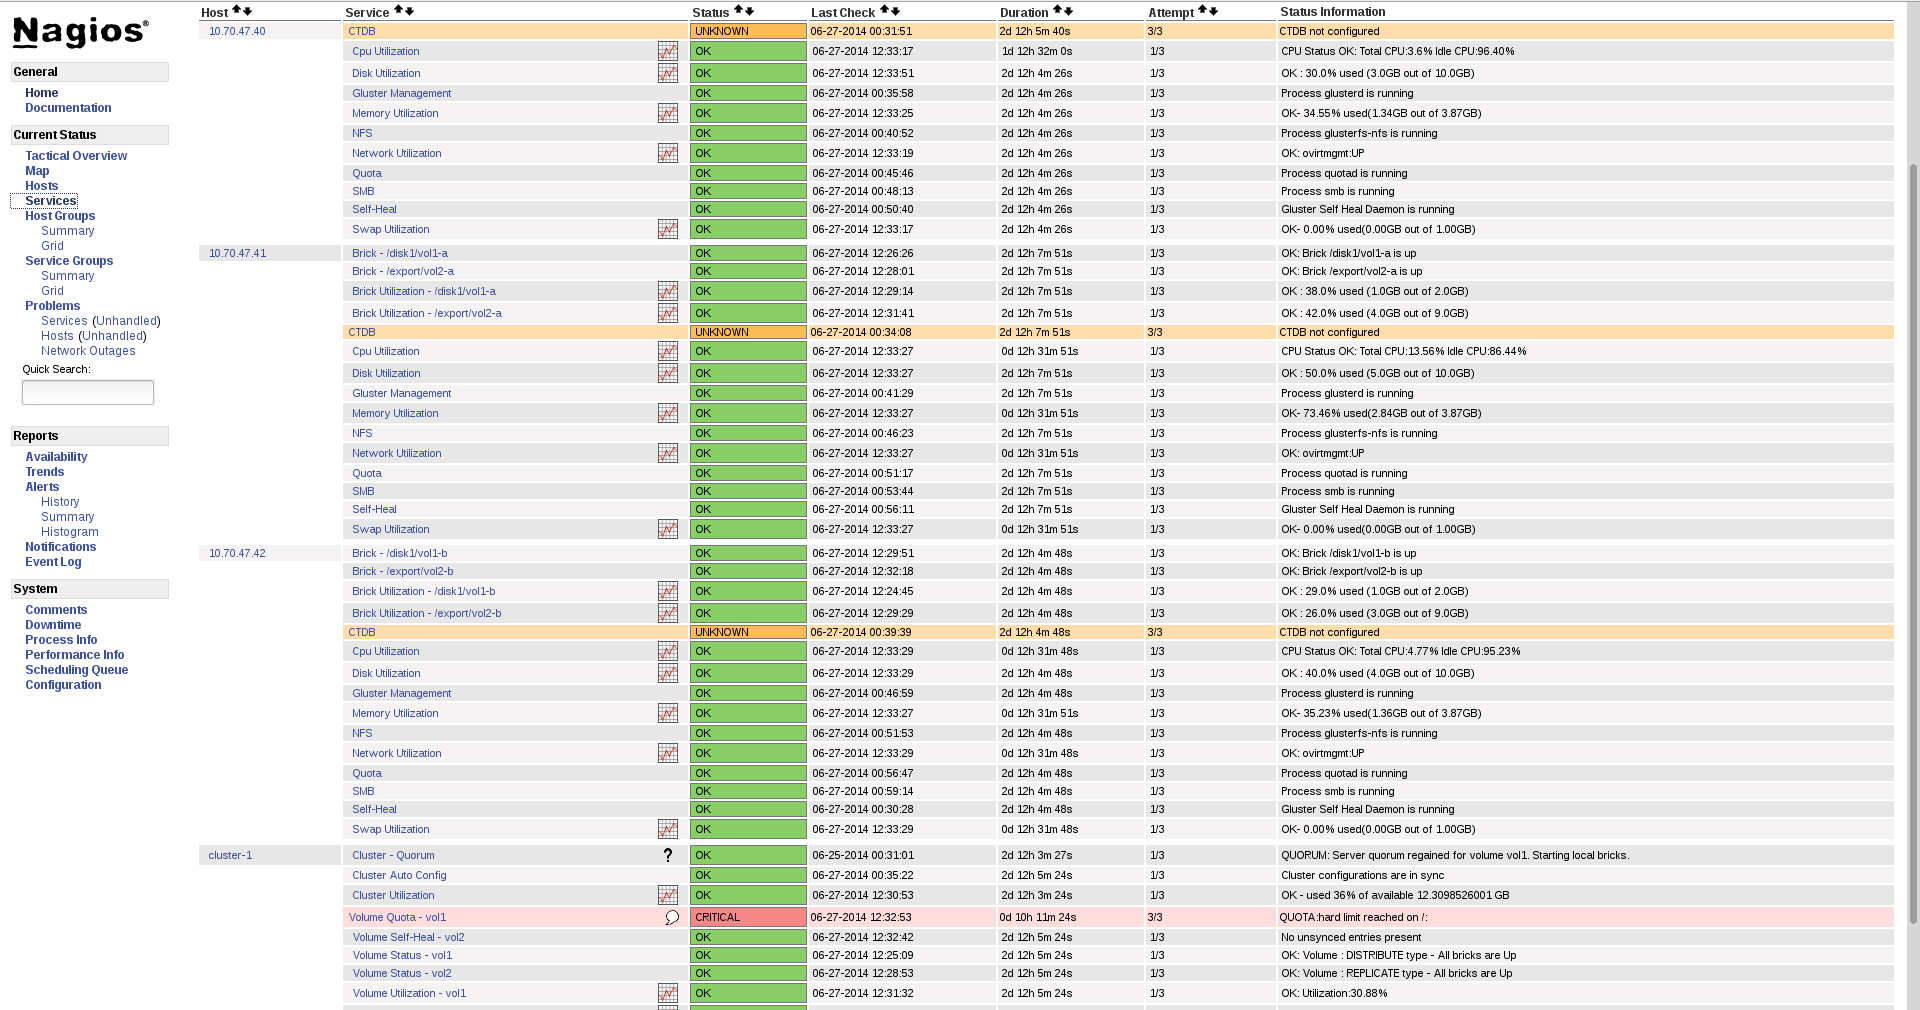
Figure 17.8. Service Status
Note
- Click
Hostsin the left pane. The list of hosts are displayed. - Click
 corresponding to the host name to view the host details.
- Select the service name to view the Service State Information. You can view the utilization of the following services:
- Memory
- Swap
- CPU
- Network
- Brick
- DiskThe Brick/Disk Utilization Performance data has four sets of information for every mount point which are brick/disk space detail, inode detail of a brick/disk, thin pool utilization and thin pool metadata utilization if brick/disk is made up of thin LV.The Performance data for services is displayed in the following format: value[UnitOfMeasurement];warningthreshold;criticalthreshold;min;max.For Example,Performance Data: /bricks/brick2=31.596%;80;90;0;0.990 /bricks/brick2.inode=0.003%;80;90;0;1048064 /bricks/brick2.thinpool=19.500%;80;90;0;1.500 /bricks/brick2.thinpool-metadata=4.100%;80;90;0;0.004As part of disk utilization service, the following mount points will be monitored:
/ , /boot, /home, /var and /usrif available.
- To view the utilization graph, click
 corresponding to the service name. The utilization graph is displayed.
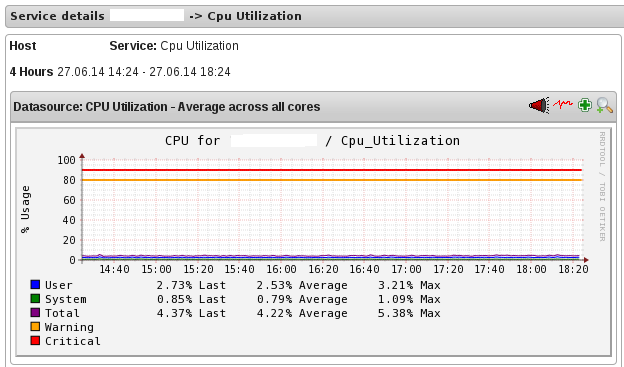
Figure 17.9. CPU Utilization
- To monitor status, click on the service name. You can monitor the status for the following resources:
- Disk
- Network
- To monitor process, click on the process name. You can monitor the following processes:
- Gluster NFS (Network File System)
- Self-Heal (Self-Heal)
- Gluster Management (glusterd)
- Quota (Quota daemon)
- CTDB
- SMB
Note
Monitoring Openstack Swift operations is not supported.
- Click
Hostsin the left pane. The list of hosts and clusters are displayed. - Click
 corresponding to the cluster name to view the cluster details.
- To view utilization graph, click
 corresponding to the service name. You can monitor the following utilizations:
- Cluster
- Volume
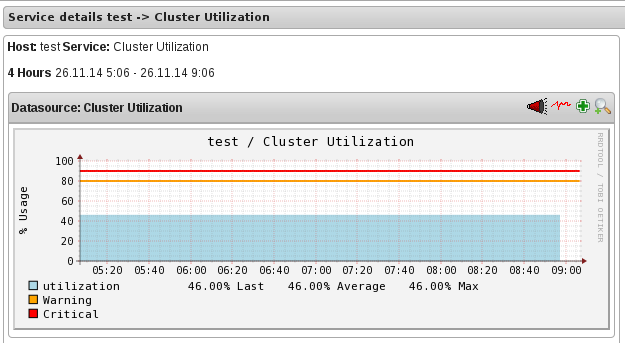
Figure 17.10. Cluster Utilization
- To monitor status, click on the service name. You can monitor the status for the following resources:
- Host
- Volume
- Brick
- To monitor cluster services, click on the service name. You can monitor the following:
- Volume Quota
- Volume Geo-replication
- Volume Split-Brain
- Cluster Quorum (A cluster quorum service would be present only when there are volumes in the cluster.)
If new nodes or services are added or removed, or if snapshot restore is performed on Red Hat Gluster Storage node, reschedule the Cluster Auto config service using Nagios Server GUI or execute the configure-gluster-nagios command. To synchronize the configurations using Nagios Server GUI, perform the steps given below:
- Login to the Nagios Server GUI using the following URL in your browser with nagiosadmin user name and password.
https://NagiosServer-HostName-or-IPaddress/nagios - Click Services in left pane of Nagios server GUI and click Cluster Auto Config.
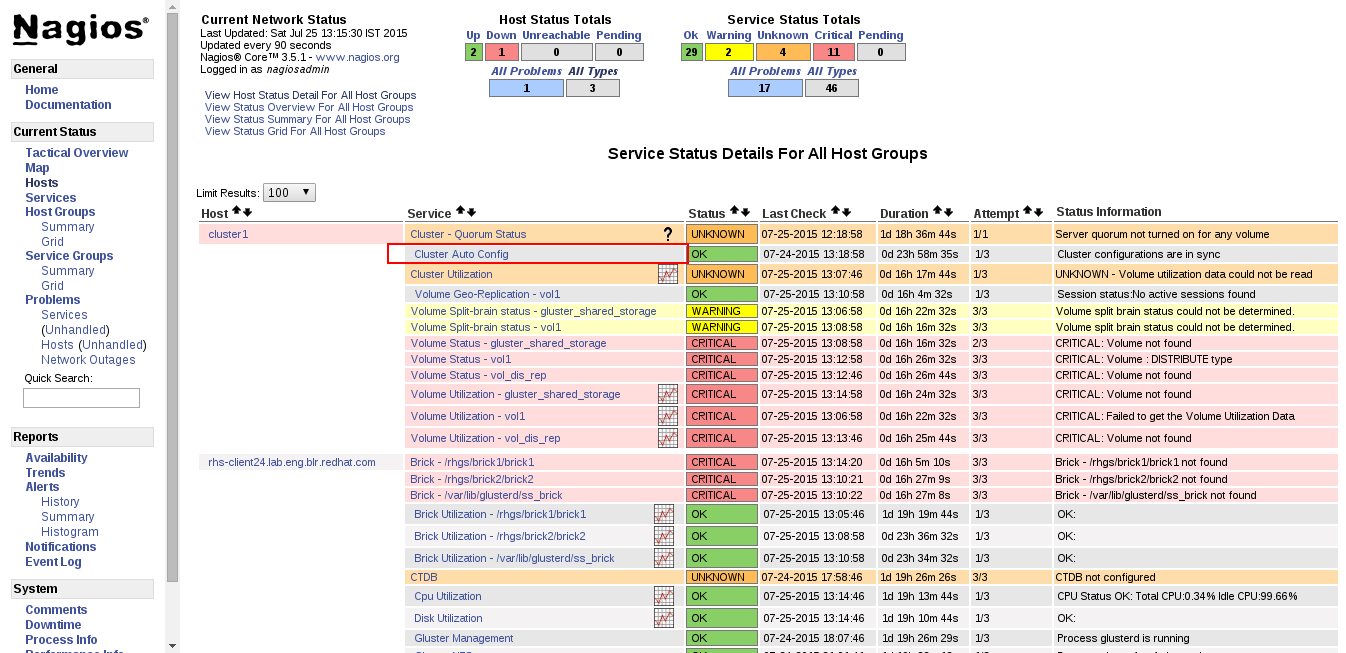
Figure 17.11. Nagios Services
- In Service Commands, click Re-schedule the next check of this service. The Command Options window is displayed.
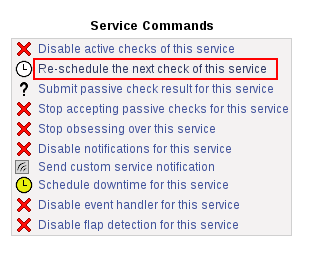
Figure 17.12. Service Commands
- In Command Options window, click .
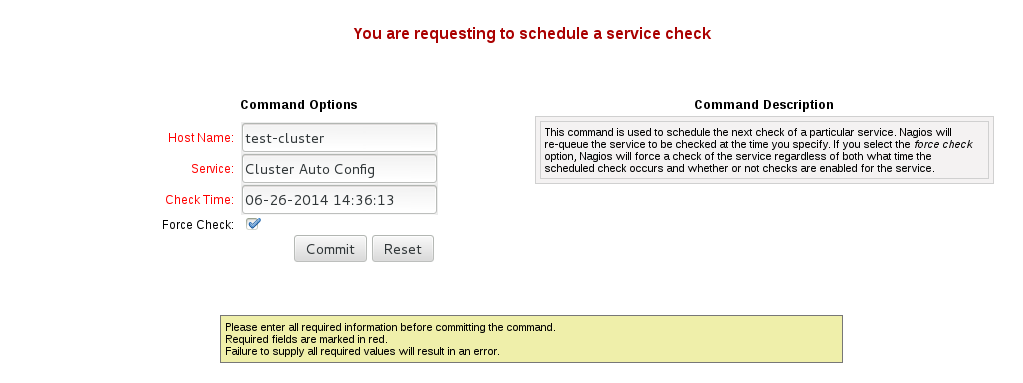
Figure 17.13. Command Options
You can enable or disable Host and Service notifications through Nagios GUI.
- To enable and disable Host Notifcations:
- Login to the Nagios Server GUI using the following URL in your browser with
nagiosadminuser name and password.https://NagiosServer-HostName-or-IPaddress/nagios - Click Hosts in left pane of Nagios server GUI and select the host.
- Click Enable notifications for this host or Disable notifications for this host in Host Commands section.
- Click Commit to enable or disable notification for the selected host.
- To enable and disable Service Notification:
- Login to the Nagios Server GUI.
- Click Services in left pane of Nagios server GUI and select the service to enable or disable.
- Click Enable notifications for this service or Disable notifications for this service from the Service Commands section.
- Click Commit to enable or disable the selected service notification.
- To enable and disable all Service Notifications for a host:
- Login to the Nagios Server GUI.
- Click Hosts in left pane of Nagios server GUI and select the host to enable or disable all services notifications.
- Click Enable notifications for all services on this host or Disable notifications for all services on this host from the Service Commands section.
- Click Commit to enable or disable all service notifications for the selected host.
- To enable or disable all Notifications:
- Login to the Nagios Server GUI.
- Click Process Info under Systems section from left pane of Nagios server GUI.
- Click Enable notifications or Disable notifications in Process Commands section.
- Click Commit.
You can enable a service to monitor or disable a service you have been monitoring using the Nagios GUI.
- To enable Service Monitoring:
- Login to the Nagios Server GUI using the following URL in your browser with
nagiosadminuser name and password.https://NagiosServer-HostName-or-IPaddress/nagios - Click Services in left pane of Nagios server GUI and select the service to enable monitoring.
- Click Enable active checks of this service from the Service Commands and click Commit.
- Click Start accepting passive checks for this service from the Service Commands and click Commit.Monitoring is enabled for the selected service.
- To disable Service Monitoring:
- Login to the Nagios Server GUI using the following URL in your browser with
nagiosadminuser name and password.https://NagiosServer-HostName-or-IPaddress/nagios - Click Services in left pane of Nagios server GUI and select the service to disable monitoring.
- Click Disable active checks of this service from the Service Commands and click Commit.
- Click Stop accepting passive checks for this service from the Service Commands and click Commit.Monitoring is disabled for the selected service.
Note
| Service Name | Status | Messsage | Description |
|---|---|---|---|
| SMB | OK | OK: No gluster volume uses smb | When no volumes are exported through smb. |
| OK | Process smb is running | When SMB service is running and when volumes are exported using SMB. | |
| CRITICAL | CRITICAL: Process smb is not running | When SMB service is down and one or more volumes are exported through SMB. | |
| CTDB | UNKNOWN | CTDB not configured | When CTDB service is not running, and smb or nfs service is running. |
| CRITICAL | Node status: BANNED/STOPPED | When CTDB service is running but Node status is BANNED/STOPPED. | |
| WARNING | Node status: UNHEALTHY/DISABLED/PARTIALLY_ONLINE | When CTDB service is running but Node status is UNHEALTHY/DISABLED/PARTIALLY_ONLINE. | |
| OK | Node status: OK | When CTDB service is running and healthy. | |
| Gluster Management | OK | Process glusterd is running | When glusterd is running as unique. |
| WARNING | PROCS WARNING: 3 processes | When there are more then one glusterd is running. | |
| CRITICAL | CRITICAL: Process glusterd is not running | When there is no glusterd process running. | |
| UNKNOWN | NRPE: Unable to read output | When unable to communicate or read output | |
| Gluster NFS | OK | OK: No gluster volume uses nfs | When no volumes are configured to be exported through NFS. |
| OK | Process glusterfs-nfs is running | When glusterfs-nfs process is running. | |
| CRITICAL | CRITICAL: Process glusterfs-nfs is not running | When glusterfs-nfs process is down and there are volumes which requires NFS export. | |
| Auto-Config | OK | Cluster configurations are in sync | When auto-config has not detected any change in Gluster configuration. This shows that Nagios configuration is already in synchronization with the Gluster configuration and auto-config service has not made any change in Nagios configuration. |
| OK | Cluster configurations synchronized successfully from host host-address | When auto-config has detected change in the Gluster configuration and has successfully updated the Nagios configuration to reflect the change Gluster configuration. | |
| CRITICAL | Can't remove all hosts except sync host in 'auto' mode. Run auto discovery manually. | When the host used for auto-config itself is removed from the Gluster peer list. Auto-config will detect this as all host except the synchronized host is removed from the cluster. This will not change the Nagios configuration and the user need to manually run the auto-config. | |
| QUOTA | OK | OK: Quota not enabled | When quota is not enabled in any volumes. |
| OK | Process quotad is running | When glusterfs-quota service is running. | |
| CRITICAL | CRITICAL: Process quotad is not running | When glusterfs-quota service is down and quota is enabled for one or more volumes. | |
| CPU Utilization | OK | CPU Status OK: Total CPU:4.6% Idle CPU:95.40% | When CPU usage is less than 80%. |
| WARNING | CPU Status WARNING: Total CPU:82.40% Idle CPU:17.60% | When CPU usage is more than 80%. | |
| CRITICAL | CPU Status CRITICAL: Total CPU:97.40% Idle CPU:2.6% | When CPU usage is more than 90%. | |
| Memory Utilization | OK | OK- 65.49% used(1.28GB out of 1.96GB) | When used memory is below warning threshold. (Default warning threshold is 80%) |
| WARNING | WARNING- 85% used(1.78GB out of 2.10GB) | When used memory is below critical threshold (Default critical threshold is 90%) and greater than or equal to warning threshold (Default warning threshold is 80%). | |
| CRITICAL | CRITICAL- 92% used(1.93GB out of 2.10GB) | When used memory is greater than or equal to critical threshold (Default critical threshold is 90% ) | |
| Brick Utilization | OK | OK | When used space of any of the four parameters, space detail, inode detail, thin pool, and thin pool-metadata utilizations, are below threshold of 80%. |
| WARNING | WARNING:mount point /brick/brk1 Space used (0.857 / 1.000) GB | If any of the four parameters, space detail, inode detail, thin pool utilization, and thinpool-metadata utilization, crosses warning threshold of 80% (Default is 80%). | |
| CRITICAL | CRITICAL : mount point /brick/brk1 (inode used 9980/1000) | If any of the four parameters, space detail, inode detail, thin pool utilization, and thinpool-metadata utilizations, crosses critical threshold 90% (Default is 90%). | |
| Disk Utilization | OK | OK | When used space of any of the four parameters, space detail, inode detail, thin pool utilization, and thinpool-metadata utilizations, are below threshold of 80%. |
| WARNING | WARNING:mount point /boot Space used (0.857 / 1.000) GB | When used space of any of the four parameters, space detail, inode detail, thin pool utilization, and thinpool-metadata utilizations, are above warning threshold of 80%. | |
| CRITICAL | CRITICAL : mount point /home (inode used 9980/1000) | If any of the four parameters, space detail, inode detail, thin pool utilization, and thinpool-metadata utilizations, crosses critical threshold 90% (Default is 90%). | |
| Network Utilization | OK | OK: tun0:UP,wlp3s0:UP,virbr0:UP | When all the interfaces are UP. |
| WARNING | WARNING: tun0:UP,wlp3s0:UP,virbr0:DOWN | When any of the interfaces is down. | |
| UNKNOWN | UNKNOWN | When network utilization/status is unknown. | |
| Swap Utilization | OK | OK- 0.00% used(0.00GB out of 1.00GB) | When used memory is below warning threshold (Default warning threshold is 80%). |
| WARNING | WARNING- 83% used(1.24GB out of 1.50GB) | When used memory is below critical threshold (Default critical threshold is 90%) and greater than or equal to warning threshold (Default warning threshold is 80%). | |
| CRITICAL | CRITICAL- 83% used(1.42GB out of 1.50GB) | When used memory is greater than or equal to critical threshold (Default critical threshold is 90%). | |
| Cluster Quorum | PENDING | When cluster.server-quorum-type is not set to server; or when there are no problems in the cluster identified. | |
| OK | Quorum regained for volume | When quorum is regained for volume. | |
| CRITICAL | Quorum lost for volume | When quorum is lost for volume. | |
| Volume Geo-replication | OK | "Session Status: slave_vol1-OK .....slave_voln-OK. | When all sessions are active. |
| OK | Session status :No active sessions found | When Geo-replication sessions are deleted. | |
| CRITICAL | Session Status: slave_vol1-FAULTY slave_vol2-OK | If one or more nodes are Faulty and there's no replica pair that's active. | |
| WARNING | Session Status: slave_vol1-NOT_STARTED slave_vol2-STOPPED slave_vol3- PARTIAL_FAULTY |
| |
| WARNING | Geo replication status could not be determined. | When there's an error in getting Geo replication status. This error occurs when volfile is locked as another transaction is in progress. | |
| UNKNOWN | Geo replication status could not be determined. | When glusterd is down. | |
| Volume Quota | OK | QUOTA: not enabled or configured | When quota is not set |
| OK | QUOTA:OK | When quota is set and usage is below quota limits. | |
| WARNING | QUOTA:Soft limit exceeded on path of directory | When quota exceeds soft limit. | |
| CRITICAL | QUOTA:hard limit reached on path of directory | When quota reaches hard limit. | |
| UNKNOWN | QUOTA: Quota status could not be determined as command execution failed | When there's an error in getting Quota status. This occurs when
| |
| Volume Status | OK | Volume : volume type - All bricks are Up | When all volumes are up. |
| WARNING | Volume :volume type Brick(s) - list of bricks is|are down, but replica pair(s) are up | When bricks in the volume are down but replica pairs are up. | |
| UNKNOWN | Command execution failed Failure message | When command execution fails. | |
| CRITICAL | Volume not found. | When volumes are not found. | |
| CRITICAL | Volume: volume-type is stopped. | When volumes are stopped. | |
| CRITICAL | Volume : volume type - All bricks are down. | When all bricks are down. | |
| CRITICAL | Volume : volume type Bricks - brick list are down, along with one or more replica pairs | When bricks are down along with one or more replica pairs. | |
|
Volume Self-Heal
(available in Red Hat Gluster Storage version 3.1.0 and earlier)
| OK | When volume is not a replicated volume, there is no self-heal to be done. | |
| OK | No unsynced entries present | When there are no unsynched entries in a replicated volume. | |
| WARNING | Unsynched entries present : There are unsynched entries present. | If self-heal process is turned on, these entries may be auto healed. If not, self-heal will need to be run manually. If unsynchronized entries persist over time, this could indicate a split brain scenario. | |
| WARNING | Self heal status could not be determined as the volume was deleted | When self-heal status can not be determined as the volume is deleted. | |
| UNKNOWN |
When there's an error in getting self heal status. This error occurs when:
| ||
|
Volume Self-Heal Info
(available in Red Hat Gluster Storage version 3.1.3 and later)
| OK | No unsynced entries found. | Displayed when there are no entries in a replicated volume that haven't been synced. |
| WARNING | Unsynced entries found. | Displayed when there are entries in a replicated volume that still need to be synced. If self-heal is enabled, these may heal automatically. If self-heal is not enabled, healing must be run manually. | |
| WARNING | Volume heal information could not be determined. | Displayed when self-heal status cannot be determined, usually because the volume has been deleted. | |
| UNKNOWN | Glusterd cannot be queried. | Displayed when self-heal status cannot be retrieved. usually because the volume has been stopped, the glusterd service is down, or the volfile is locked because another transaction is in progress. | |
|
Volume Split-Brain Status
(available in Red Hat Gluster Storage version 3.1.1 and later)
| OK | No split-brain entries found. | Displayed when files are present and do not have split-brain issues. |
| UNKNOWN | Glusterd cannot be queried. | Displayed when split-brain status cannot be retrieved, usually because the volume has been stopped, the glusterd service is down, or the volfile is locked because another transaction is in progress. | |
| WARNING | Volume split-brain status could not be determined. | Displayed when split-brain status cannot be determined, usually because the volume no longer exists. | |
| CRITICAL |
14 entries found in split-brain state.
| Displays the number of files in a split-brain state when files in split-brain state are detected. | |
| Cluster Utilization | OK | OK : 28.0% used (1.68GB out of 6.0GB) | When used % is below the warning threshold (Default warning threshold is 80%). |
| WARNING | WARNING: 82.0% used (4.92GB out of 6.0GB) | Used% is above the warning limit. (Default warning threshold is 80%) | |
| CRITICAL | CRITICAL : 92.0% used (5.52GB out of 6.0GB) | Used% is above the warning limit. (Default critical threshold is 90%) | |
| UNKNOWN | Volume utilization data could not be read | When volume services are present, but the volume utilization data is not available as it's either not populated yet or there is error in fetching volume utilization data. | |
| Volume Utilization | OK | OK: Utilization: 40 % | When used % is below the warning threshold (Default warning threshold is 80%). |
| WARNING | WARNING - used 84% of available 200 GB | When used % is above the warning threshold (Default warning threshold is 80%). | |
| CRITICAL | CRITICAL - used 96% of available 200 GB | When used % is above the critical threshold (Default critical threshold is 90%). | |
| UNKNOWN | UNKNOWN - Volume utilization data could not be read | When all the bricks in the volume are killed or if glusterd is stopped in all the nodes in a cluster. |