此内容没有您所选择的语言版本。
41.2. Implementation
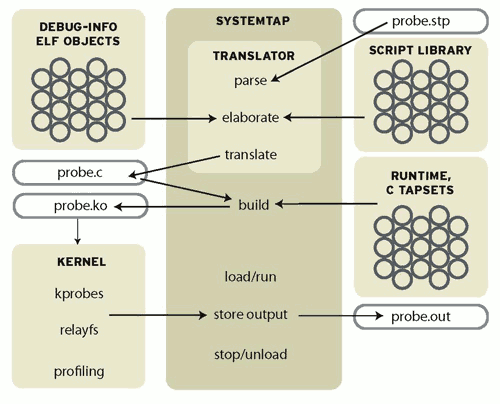
SystemTap takes a compiler-oriented approach to generating instrumentation. Refer to Figure 41.1, “Flow of Data in SystemTap” "Flow of data in SystemTap" for an overall diagram of SystemTap used in this discussion. In the upper right hand corner of the diagram is the probe.stp, the probe script the developer has written. This is parsed by the translator into parse trees. During this time the input is checked for syntax errors. The translator then performs elaboration, pulling in additional code from the script library and determining locations of probe points and variables from the debug information. After the elaboration is complete the translator can generate the probe.c, the kernel module in C.
The probe.c file is compiled into a regular kernel module, probe.ko, using the GCC compiler. The compilation may pull in support code from the runtime libraries. After GCC has generated the probe.ko, the SystemTap daemon is started to collect the output of the instrumentation module. The instrumentation module is loaded into the kernel, and data collection is started. Data from the instrumentation module is transferred to user-space via relayfs and displayed by the daemon. When the user hits Control-C the daemon unloads the module, which also shuts down the data collection process.

Figure 41.1. Flow of Data in SystemTap