Dieser Inhalt ist in der von Ihnen ausgewählten Sprache nicht verfügbar.
Chapter 17. Using Precision Time Protocol hardware
17.1. About Precision Time Protocol in OpenShift cluster nodes
Precision Time Protocol (PTP) is used to synchronize clocks in a network. When used in conjunction with hardware support, PTP is capable of sub-microsecond accuracy, and is more accurate than Network Time Protocol (NTP).
If your openshift-sdn cluster with PTP uses the User Datagram Protocol (UDP) for hardware time stamping and you migrate to the OVN-Kubernetes plugin, the hardware time stamping cannot be applied to primary interface devices, such as an Open vSwitch (OVS) bridge. As a result, UDP version 4 configurations cannot work with a br-ex interface.
You can configure linuxptp services and use PTP-capable hardware in OpenShift Container Platform cluster nodes.
Use the OpenShift Container Platform web console or OpenShift CLI (oc) to install PTP by deploying the PTP Operator. The PTP Operator creates and manages the linuxptp services and provides the following features:
- Discovery of the PTP-capable devices in the cluster.
-
Management of the configuration of
linuxptpservices. -
Notification of PTP clock events that negatively affect the performance and reliability of your application with the PTP Operator
cloud-event-proxysidecar.
The PTP Operator works with PTP-capable devices on clusters provisioned only on bare-metal infrastructure.
17.1.1. Elements of a PTP domain
PTP is used to synchronize multiple nodes connected in a network, with clocks for each node. The clocks synchronized by PTP are organized in a leader-follower hierarchy. The hierarchy is created and updated automatically by the best master clock (BMC) algorithm, which runs on every clock. Follower clocks are synchronized to leader clocks, and follower clocks can themselves be the source for other downstream clocks.
Figure 17.1. PTP nodes in the network
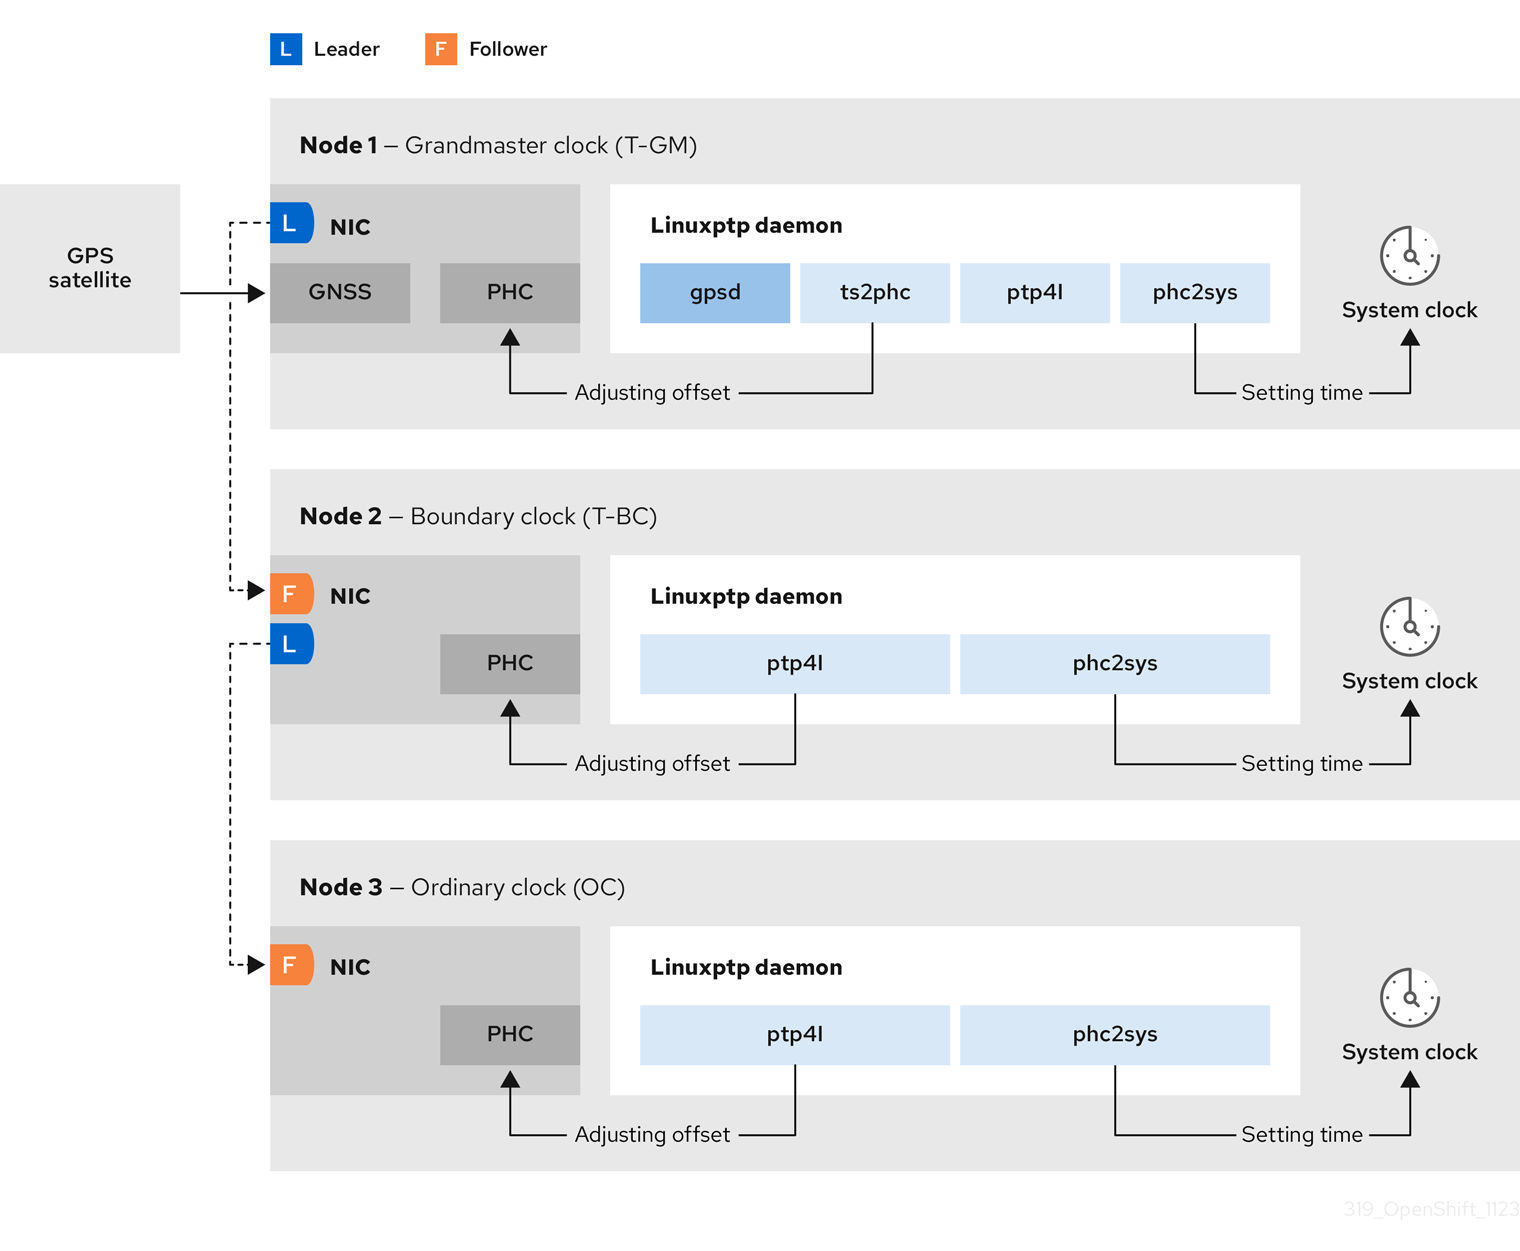
The three primary types of PTP clocks are described below.
- Grandmaster clock
- The grandmaster clock provides standard time information to other clocks across the network and ensures accurate and stable synchronisation. It writes time stamps and responds to time requests from other clocks. Grandmaster clocks synchronize to a Global Navigation Satellite System (GNSS) time source. The Grandmaster clock is the authoritative source of time in the network and is responsible for providing time synchronization to all other devices.
- Boundary clock
- The boundary clock has ports in two or more communication paths and can be a source and a destination to other destination clocks at the same time. The boundary clock works as a destination clock upstream. The destination clock receives the timing message, adjusts for delay, and then creates a new source time signal to pass down the network. The boundary clock produces a new timing packet that is still correctly synced with the source clock and can reduce the number of connected devices reporting directly to the source clock.
- Ordinary clock
- The ordinary clock has a single port connection that can play the role of source or destination clock, depending on its position in the network. The ordinary clock can read and write timestamps.
17.1.1.1. Advantages of PTP over NTP
One of the main advantages that PTP has over NTP is the hardware support present in various network interface controllers (NIC) and network switches. The specialized hardware allows PTP to account for delays in message transfer and improves the accuracy of time synchronization. To achieve the best possible accuracy, it is recommended that all networking components between PTP clocks are PTP hardware enabled.
Hardware-based PTP provides optimal accuracy, since the NIC can timestamp the PTP packets at the exact moment they are sent and received. Compare this to software-based PTP, which requires additional processing of the PTP packets by the operating system.
Before enabling PTP, ensure that NTP is disabled for the required nodes. You can disable the chrony time service (chronyd) using a MachineConfig custom resource. For more information, see Disabling chrony time service.
17.1.2. Using dual Intel E810 NIC hardware with PTP
OpenShift Container Platform supports single and dual NIC Intel E810 hardware for precision PTP timing in grandmaster clocks (T-GM) and boundary clocks (T-BC).
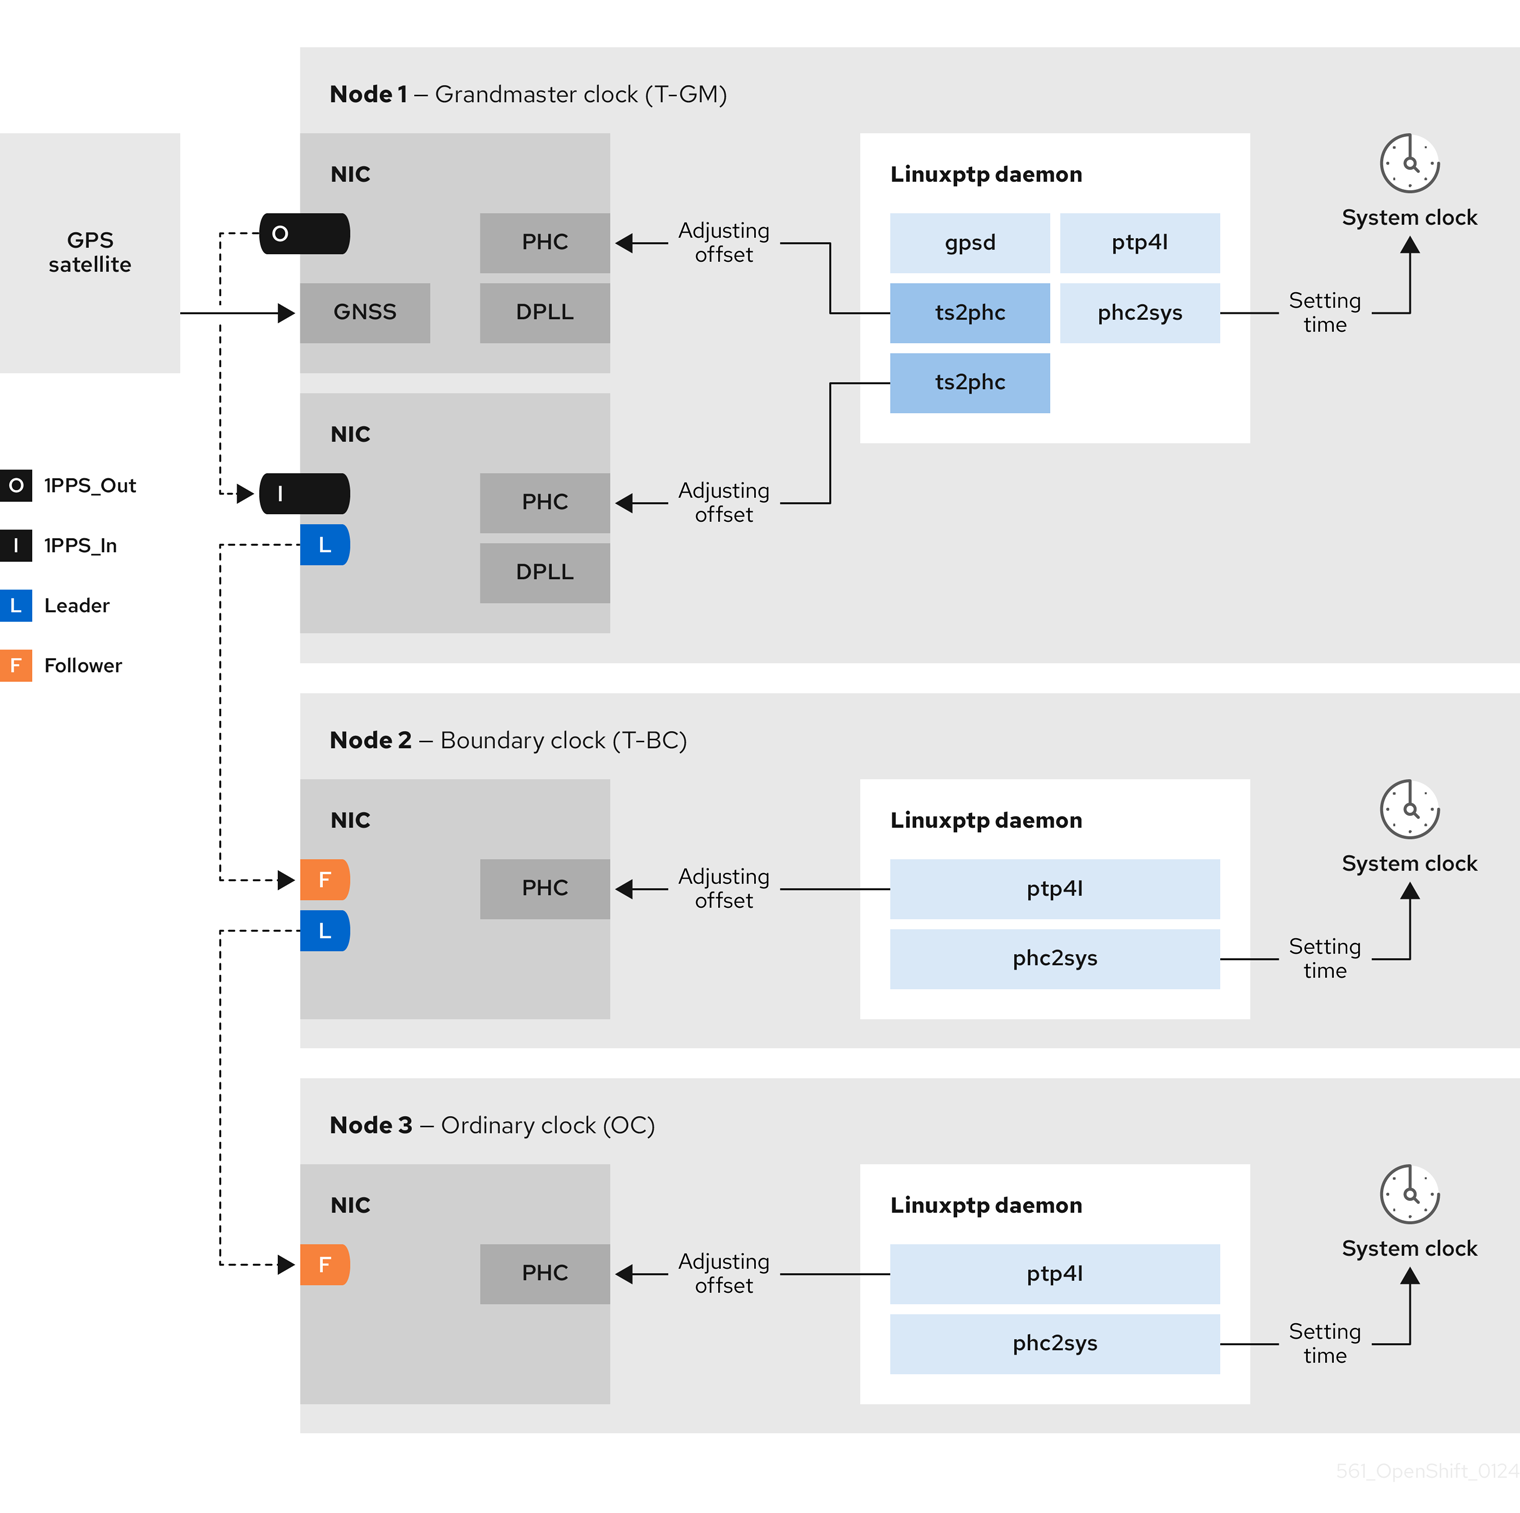
- Dual NIC grandmaster clock
You can use a cluster host that has dual NIC hardware as PTP grandmaster clock. One NIC receives timing information from the global navigation satellite system (GNSS). The second NIC receives the timing information from the first using the SMA1 Tx/Rx connections on the E810 NIC faceplate. The system clock on the cluster host is synchronized from the NIC that is connected to the GNSS satellite.
Dual NIC grandmaster clocks are a feature of distributed RAN (D-RAN) configurations where the Remote Radio Unit (RRU) and Baseband Unit (BBU) are located at the same radio cell site. D-RAN distributes radio functions across multiple sites, with backhaul connections linking them to the core network.
Figure 17.2. Dual NIC grandmaster clock
 Note
NoteIn a dual NIC T-GM configuration, a single
ts2phcprocess reports as twots2phcinstances in the system.- Dual NIC boundary clock
For 5G telco networks that deliver mid-band spectrum coverage, each virtual distributed unit (vDU) requires connections to 6 radio units (RUs). To make these connections, each vDU host requires 2 NICs configured as boundary clocks.
Dual NIC hardware allows you to connect each NIC to the same upstream leader clock with separate
ptp4linstances for each NIC feeding the downstream clocks.
17.1.3. Overview of linuxptp and gpsd in OpenShift Container Platform nodes
OpenShift Container Platform uses the PTP Operator with linuxptp and gpsd packages for high precision network synchronization. The linuxptp package provides tools and daemons for PTP timing in networks. Cluster hosts with Global Navigation Satellite System (GNSS) capable NICs use gpsd to interface with GNSS clock sources.
The linuxptp package includes the ts2phc, pmc, ptp4l, and phc2sys programs for system clock synchronization.
- ts2phc
ts2phcsynchronizes the PTP hardware clock (PHC) across PTP devices with a high degree of precision.ts2phcis used in grandmaster clock configurations. It receives the precision timing signal a high precision clock source such as Global Navigation Satellite System (GNSS). GNSS provides an accurate and reliable source of synchronized time for use in large distributed networks. GNSS clocks typically provide time information with a precision of a few nanoseconds.The
ts2phcsystem daemon sends timing information from the grandmaster clock to other PTP devices in the network by reading time information from the grandmaster clock and converting it to PHC format. PHC time is used by other devices in the network to synchronize their clocks with the grandmaster clock.- pmc
-
pmcimplements a PTP management client (pmc) according to IEEE standard 1588.1588.pmcprovides basic management access for theptp4lsystem daemon.pmcreads from standard input and sends the output over the selected transport, printing any replies it receives. - ptp4l
ptp4limplements the PTP boundary clock and ordinary clock and runs as a system daemon.ptp4ldoes the following:- Synchronizes the PHC to the source clock with hardware time stamping
- Synchronizes the system clock to the source clock with software time stamping
- phc2sys
-
phc2syssynchronizes the system clock to the PHC on the network interface controller (NIC). Thephc2syssystem daemon continuously monitors the PHC for timing information. When it detects a timing error, the PHC corrects the system clock.
The gpsd package includes the ubxtool, gspipe, gpsd, programs for GNSS clock synchronization with the host clock.
- ubxtool
-
ubxtoolCLI allows you to communicate with a u-blox GPS system. TheubxtoolCLI uses the u-blox binary protocol to communicate with the GPS. - gpspipe
-
gpspipeconnects togpsdoutput and pipes it tostdout. - gpsd
-
gpsdis a service daemon that monitors one or more GPS or AIS receivers connected to the host.
17.1.4. Overview of GNSS timing for PTP grandmaster clocks
OpenShift Container Platform supports receiving precision PTP timing from Global Navigation Satellite System (GNSS) sources and grandmaster clocks (T-GM) in the cluster.
OpenShift Container Platform supports PTP timing from GNSS sources with Intel E810 Westport Channel NICs only.
Figure 17.3. Overview of Synchronization with GNSS and T-GM
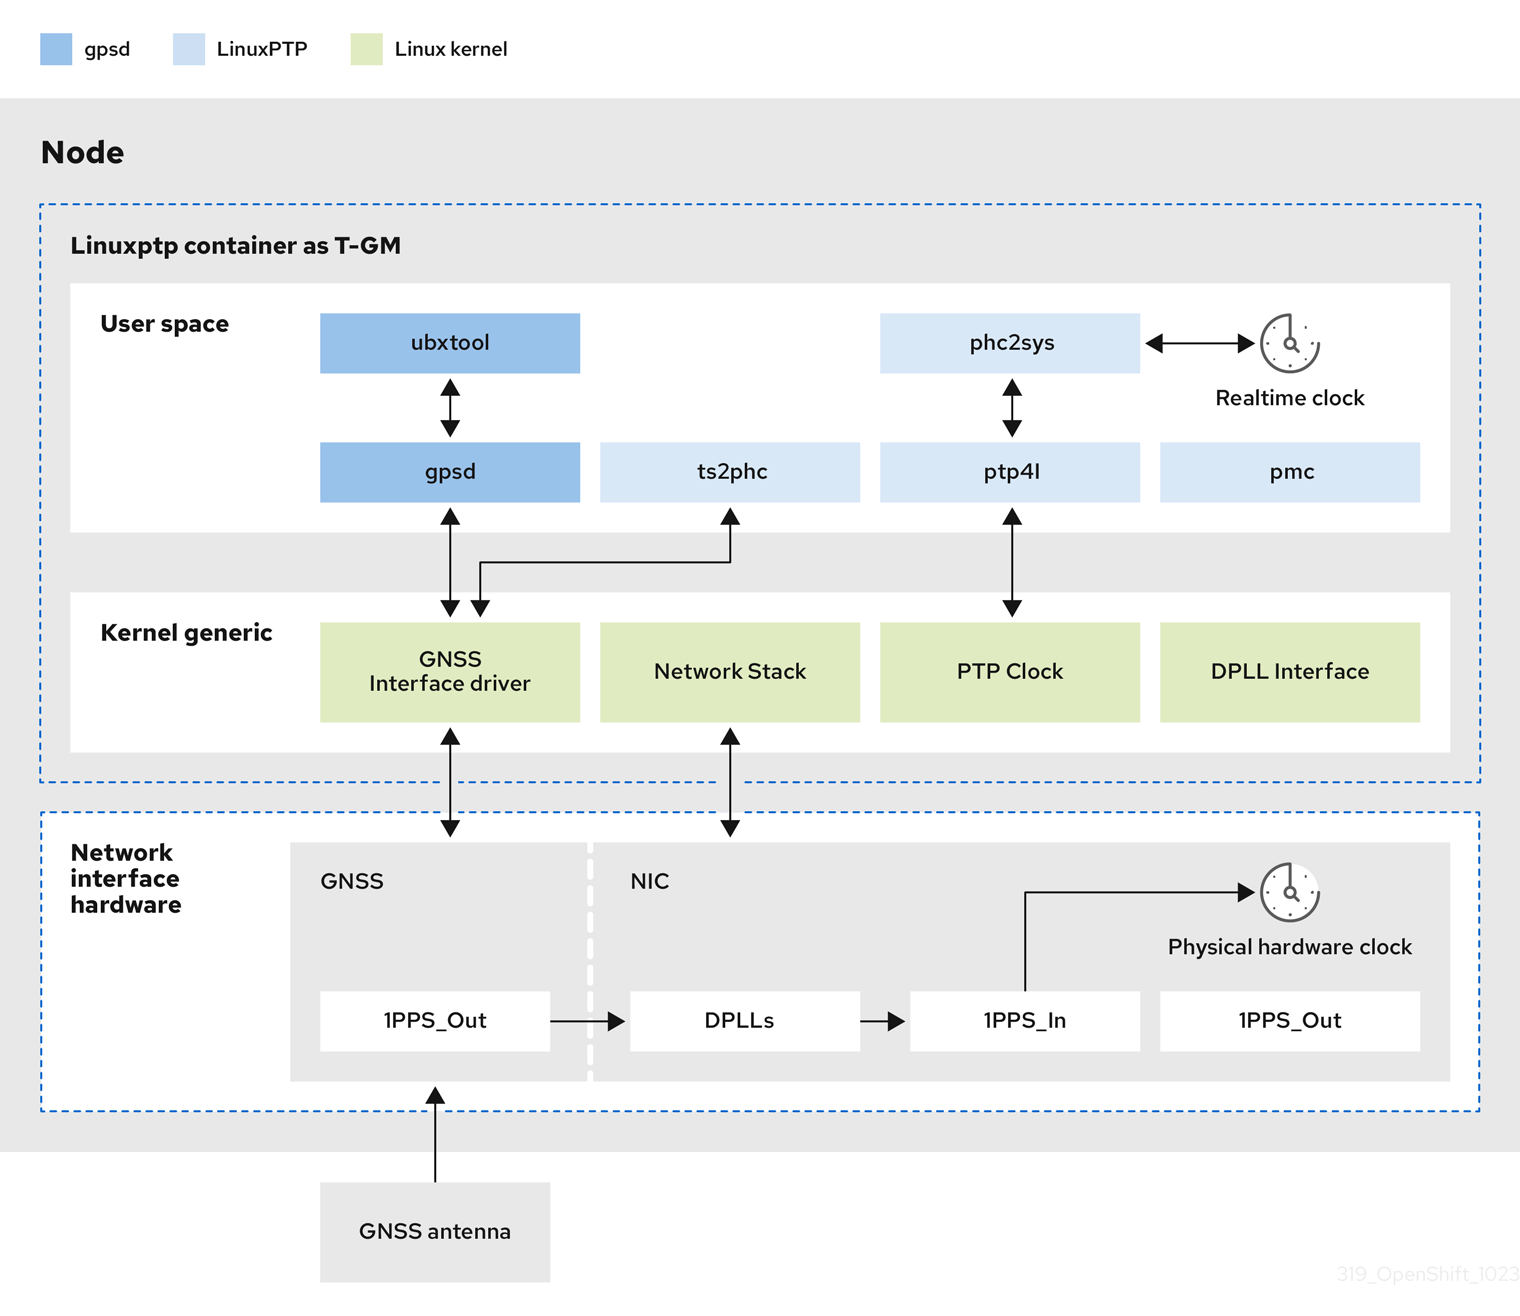
- Global Navigation Satellite System (GNSS)
GNSS is a satellite-based system used to provide positioning, navigation, and timing information to receivers around the globe. In PTP, GNSS receivers are often used as a highly accurate and stable reference clock source. These receivers receive signals from multiple GNSS satellites, allowing them to calculate precise time information. The timing information obtained from GNSS is used as a reference by the PTP grandmaster clock.
By using GNSS as a reference, the grandmaster clock in the PTP network can provide highly accurate timestamps to other devices, enabling precise synchronization across the entire network.
- Digital Phase-Locked Loop (DPLL)
- DPLL provides clock synchronization between different PTP nodes in the network. DPLL compares the phase of the local system clock signal with the phase of the incoming synchronization signal, for example, PTP messages from the PTP grandmaster clock. The DPLL continuously adjusts the local clock frequency and phase to minimize the phase difference between the local clock and the reference clock.
17.1.4.1. Handling leap second events in GNSS-synced PTP grandmaster clocks
A leap second is a one-second adjustment that is occasionally applied to Coordinated Universal Time (UTC) to keep it synchronized with International Atomic Time (TAI). UTC leap seconds are unpredictable. Internationally agreed leap seconds are listed in leap-seconds.list. This file is regularly updated by the International Earth Rotation and Reference Systems Service (IERS). An unhandled leap second can have a significant impact on far edge RAN networks. It can cause the far edge RAN application to immediately disconnect voice calls and data sessions.
17.2. Configuring PTP devices
The PTP Operator adds the NodePtpDevice.ptp.openshift.io custom resource definition (CRD) to OpenShift Container Platform.
When installed, the PTP Operator searches your cluster for Precision Time Protocol (PTP) capable network devices on each node. The Operator creates and updates a NodePtpDevice custom resource (CR) object for each node that provides a compatible PTP-capable network device.
Network interface controller (NIC) hardware with built-in PTP capabilities sometimes require a device-specific configuration. You can use hardware-specific NIC features for supported hardware with the PTP Operator by configuring a plugin in the PtpConfig custom resource (CR). The linuxptp-daemon service uses the named parameters in the plugin stanza to start linuxptp processes, ptp4l and phc2sys, based on the specific hardware configuration.
In OpenShift Container Platform 4.14, the Intel E810 NIC is supported with a PtpConfig plugin.
17.2.1. Installing the PTP Operator using the CLI
As a cluster administrator, you can install the Operator by using the CLI.
Prerequisites
- A cluster installed on bare-metal hardware with nodes that have hardware that supports PTP.
-
Install the OpenShift CLI (
oc). -
Log in as a user with
cluster-adminprivileges.
Procedure
Create a namespace for the PTP Operator.
Save the following YAML in the
ptp-namespace.yamlfile:apiVersion: v1 kind: Namespace metadata: name: openshift-ptp annotations: workload.openshift.io/allowed: management labels: name: openshift-ptp openshift.io/cluster-monitoring: "true"Create the
NamespaceCR:$ oc create -f ptp-namespace.yaml
Create an Operator group for the PTP Operator.
Save the following YAML in the
ptp-operatorgroup.yamlfile:apiVersion: operators.coreos.com/v1 kind: OperatorGroup metadata: name: ptp-operators namespace: openshift-ptp spec: targetNamespaces: - openshift-ptpCreate the
OperatorGroupCR:$ oc create -f ptp-operatorgroup.yaml
Subscribe to the PTP Operator.
Save the following YAML in the
ptp-sub.yamlfile:apiVersion: operators.coreos.com/v1alpha1 kind: Subscription metadata: name: ptp-operator-subscription namespace: openshift-ptp spec: channel: "stable" name: ptp-operator source: redhat-operators sourceNamespace: openshift-marketplaceCreate the
SubscriptionCR:$ oc create -f ptp-sub.yaml
To verify that the Operator is installed, enter the following command:
$ oc get csv -n openshift-ptp -o custom-columns=Name:.metadata.name,Phase:.status.phaseExample output
Name                         Phase
4.14.0-202301261535          Succeeded
17.2.2. Installing the PTP Operator by using the web console
As a cluster administrator, you can install the PTP Operator by using the web console.
You have to create the namespace and Operator group as mentioned in the previous section.
Procedure
Install the PTP Operator using the OpenShift Container Platform web console:
-
In the OpenShift Container Platform web console, click Operators
OperatorHub. - Choose PTP Operator from the list of available Operators, and then click Install.
- On the Install Operator page, under A specific namespace on the cluster select openshift-ptp. Then, click Install.
-
In the OpenShift Container Platform web console, click Operators
Optional: Verify that the PTP Operator installed successfully:
-
Switch to the Operators
Installed Operators page. Ensure that PTP Operator is listed in the openshift-ptp project with a Status of InstallSucceeded.
NoteDuring installation an Operator might display a Failed status. If the installation later succeeds with an InstallSucceeded message, you can ignore the Failed message.
If the Operator does not appear as installed, to troubleshoot further:
-
Go to the Operators
Installed Operators page and inspect the Operator Subscriptions and Install Plans tabs for any failure or errors under Status. -
Go to the Workloads
Pods page and check the logs for pods in the openshift-ptpproject.
-
Go to the Operators
-
Switch to the Operators
17.2.3. Discovering PTP-capable network devices in your cluster
Identify PTP-capable network devices that exist in your cluster so that you can configure them
Prerequisties
- You installed the PTP Operator.
Procedure
To return a complete list of PTP capable network devices in your cluster, run the following command:
$ oc get NodePtpDevice -n openshift-ptp -o yamlExample output
apiVersion: v1
items:
- apiVersion: ptp.openshift.io/v1
  kind: NodePtpDevice
  metadata:
    creationTimestamp: "2022-01-27T15:16:28Z"
    generation: 1
    name: dev-worker-0
1 namespace: openshift-ptp resourceVersion: "6538103" uid: d42fc9ad-bcbf-4590-b6d8-b676c642781a spec: {} status: devices:2 - name: eno1 - name: eno2 - name: eno3 - name: eno4 - name: enp5s0f0 - name: enp5s0f1 ...
17.2.4. Configuring linuxptp services as a grandmaster clock
You can configure the linuxptp services (ptp4l, phc2sys, ts2phc) as grandmaster clock (T-GM) by creating a PtpConfig custom resource (CR) that configures the host NIC.
The ts2phc utility allows you to synchronize the system clock with the PTP grandmaster clock so that the node can stream precision clock signal to downstream PTP ordinary clocks and boundary clocks.
Use the following example PtpConfig CR as the basis to configure linuxptp services as T-GM for an Intel Westport Channel E810-XXVDA4T network interface.
To configure PTP fast events, set appropriate values for ptp4lOpts, ptp4lConf, and ptpClockThreshold. ptpClockThreshold is used only when events are enabled. See "Configuring the PTP fast event notifications publisher" for more information.
Prerequisites
- For T-GM clocks in production environments, install an Intel E810 Westport Channel NIC in the bare-metal cluster host.
-
Install the OpenShift CLI (
oc). -
Log in as a user with
cluster-adminprivileges. - Install the PTP Operator.
Procedure
Create the
PtpConfigCR. For example:Depending on your requirements, use one of the following T-GM configurations for your deployment. Save the YAML in the
grandmaster-clock-ptp-config.yamlfile:Example 17.1. PTP grandmaster clock configuration for E810 NIC
apiVersion: ptp.openshift.io/v1 kind: PtpConfig metadata: name: grandmaster namespace: openshift-ptp annotations: {} spec: profile: - name: "grandmaster" ptp4lOpts: "-2 --summary_interval -4" phc2sysOpts: -r -u 0 -m -N 8 -R 16 -s $iface_master -n 24 ptpSchedulingPolicy: SCHED_FIFO ptpSchedulingPriority: 10 ptpSettings: logReduce: "true" plugins: e810: enableDefaultConfig: false settings: LocalMaxHoldoverOffSet: 1500 LocalHoldoverTimeout: 14400 MaxInSpecOffset: 1500 pins: $e810_pins # "$iface_master": # "U.FL2": "0 2" # "U.FL1": "0 1" # "SMA2": "0 2" # "SMA1": "0 1" ublxCmds: - args: #ubxtool -P 29.20 -z CFG-HW-ANT_CFG_VOLTCTRL,1 - "-P" - "29.20" - "-z" - "CFG-HW-ANT_CFG_VOLTCTRL,1" reportOutput: false - args: #ubxtool -P 29.20 -e GPS - "-P" - "29.20" - "-e" - "GPS" reportOutput: false - args: #ubxtool -P 29.20 -d Galileo - "-P" - "29.20" - "-d" - "Galileo" reportOutput: false - args: #ubxtool -P 29.20 -d GLONASS - "-P" - "29.20" - "-d" - "GLONASS" reportOutput: false - args: #ubxtool -P 29.20 -d BeiDou - "-P" - "29.20" - "-d" - "BeiDou" reportOutput: false - args: #ubxtool -P 29.20 -d SBAS - "-P" - "29.20" - "-d" - "SBAS" reportOutput: false - args: #ubxtool -P 29.20 -t -w 5 -v 1 -e SURVEYIN,600,50000 - "-P" - "29.20" - "-t" - "-w" - "5" - "-v" - "1" - "-e" - "SURVEYIN,600,50000" reportOutput: true - args: #ubxtool -P 29.20 -p MON-HW - "-P" - "29.20" - "-p" - "MON-HW" reportOutput: true - args: #ubxtool -P 29.20 -p CFG-MSG,1,38,248 - "-P" - "29.20" - "-p" - "CFG-MSG,1,38,248" reportOutput: true ts2phcOpts: " " ts2phcConf: | [nmea] ts2phc.master 1 [global] use_syslog 0 verbose 1 logging_level 7 ts2phc.pulsewidth 100000000 #cat /dev/GNSS to find available serial port #example value of gnss_serialport is /dev/ttyGNSS_1700_0 ts2phc.nmea_serialport $gnss_serialport [$iface_master] ts2phc.extts_polarity rising ts2phc.extts_correction 0 ptp4lConf: | [$iface_master] masterOnly 1 [$iface_master_1] masterOnly 1 [$iface_master_2] masterOnly 1 [$iface_master_3] masterOnly 1 [global] # # Default Data Set # twoStepFlag 1 priority1 128 priority2 128 domainNumber 24 #utc_offset 37 clockClass 6 clockAccuracy 0x27 offsetScaledLogVariance 0xFFFF free_running 0 freq_est_interval 1 dscp_event 0 dscp_general 0 dataset_comparison G.8275.x G.8275.defaultDS.localPriority 128 # # Port Data Set # logAnnounceInterval -3 logSyncInterval -4 logMinDelayReqInterval -4 logMinPdelayReqInterval 0 announceReceiptTimeout 3 syncReceiptTimeout 0 delayAsymmetry 0 fault_reset_interval -4 neighborPropDelayThresh 20000000 masterOnly 0 G.8275.portDS.localPriority 128 # # Run time options # assume_two_step 0 logging_level 6 path_trace_enabled 0 follow_up_info 0 hybrid_e2e 0 inhibit_multicast_service 0 net_sync_monitor 0 tc_spanning_tree 0 tx_timestamp_timeout 50 unicast_listen 0 unicast_master_table 0 unicast_req_duration 3600 use_syslog 1 verbose 0 summary_interval -4 kernel_leap 1 check_fup_sync 0 clock_class_threshold 7 # # Servo Options # pi_proportional_const 0.0 pi_integral_const 0.0 pi_proportional_scale 0.0 pi_proportional_exponent -0.3 pi_proportional_norm_max 0.7 pi_integral_scale 0.0 pi_integral_exponent 0.4 pi_integral_norm_max 0.3 step_threshold 2.0 first_step_threshold 0.00002 clock_servo pi sanity_freq_limit 200000000 ntpshm_segment 0 # # Transport options # transportSpecific 0x0 ptp_dst_mac 01:1B:19:00:00:00 p2p_dst_mac 01:80:C2:00:00:0E udp_ttl 1 udp6_scope 0x0E uds_address /var/run/ptp4l # # Default interface options # clock_type BC network_transport L2 delay_mechanism E2E time_stamping hardware tsproc_mode filter delay_filter moving_median delay_filter_length 10 egressLatency 0 ingressLatency 0 boundary_clock_jbod 0 # # Clock description # productDescription ;; revisionData ;; manufacturerIdentity 00:00:00 userDescription ; timeSource 0x20 recommend: - profile: "grandmaster" priority: 4 match: - nodeLabel: "node-role.kubernetes.io/$mcp"NoteFor E810 Westport Channel NICs, set the value for
ts2phc.nmea_serialportto/dev/gnss0.Create the CR by running the following command:
$ oc create -f grandmaster-clock-ptp-config.yaml
Verification
Check that the
PtpConfigprofile is applied to the node.Get the list of pods in the
openshift-ptpnamespace by running the following command:$ oc get pods -n openshift-ptp -o wideExample output
NAME                          READY   STATUS    RESTARTS   AGE     IP             NODE
linuxptp-daemon-74m2g         3/3     Running   3          4d15h   10.16.230.7    compute-1.example.com
ptp-operator-5f4f48d7c-x7zkf  1/1     Running   1          4d15h   10.128.1.145   compute-1.example.com
Check that the profile is correct. Examine the logs of the
linuxptpdaemon that corresponds to the node you specified in thePtpConfigprofile. Run the following command:$ oc logs linuxptp-daemon-74m2g -n openshift-ptp -c linuxptp-daemon-containerExample output
ts2phc[94980.334]: [ts2phc.0.config] nmea delay: 98690975 ns
ts2phc[94980.334]: [ts2phc.0.config] ens3f0 extts index 0 at 1676577329.999999999 corr 0 src 1676577330.901342528 diff -1
ts2phc[94980.334]: [ts2phc.0.config] ens3f0 master offset         -1 s2 freq      -1
ts2phc[94980.441]: [ts2phc.0.config] nmea sentence: GNRMC,195453.00,A,4233.24427,N,07126.64420,W,0.008,,160223,,,A,V
phc2sys[94980.450]: [ptp4l.0.config] CLOCK_REALTIME phc offset       943 s2 freq  -89604 delay    504
phc2sys[94980.512]: [ptp4l.0.config] CLOCK_REALTIME phc offset      1000 s2 freq  -89264 delay    474
17.2.5. Configuring linuxptp services as a grandmaster clock for dual E810 Westport Channel NICs
You can configure the linuxptp services (ptp4l, phc2sys, ts2phc) as grandmaster clock (T-GM) for dual E810 Westport Channel NICs by creating a PtpConfig custom resource (CR) that configures the host NICs.
For distributed RAN (D-RAN) use cases, you can configure PTP for dual NICs as follows:
- NIC one is synced to the global navigation satellite system (GNSS) time source.
-
NIC two is synced to the 1PPS timing output provided by NIC one. This configuration is provided by the PTP hardware plugin in the
PtpConfigCR.
The dual NIC PTP T-GM configuration uses a single instance of ptp4l and one ts2phc process reporting two ts2phc instances, one for each NIC. The host system clock is synchronized from the NIC that is connected to the GNSS time source.
Use the following example PtpConfig CR as the basis to configure linuxptp services as T-GM for dual Intel Westport Channel E810-XXVDA4T network interfaces.
To configure PTP fast events, set appropriate values for ptp4lOpts, ptp4lConf, and ptpClockThreshold. ptpClockThreshold is used only when events are enabled. See "Configuring the PTP fast event notifications publisher" for more information.
Prerequisites
- For T-GM clocks in production environments, install two Intel E810 Westport Channel NICs in the bare-metal cluster host.
-
Install the OpenShift CLI (
oc). -
Log in as a user with
cluster-adminprivileges. - Install the PTP Operator.
Procedure
Create the
PtpConfigCR. For example:Save the following YAML in the
grandmaster-clock-ptp-config-dual-nics.yamlfile:Example 17.2. PTP grandmaster clock configuration for dual E810 NICs
# In this example two cards $iface_nic1 and $iface_nic2 are connected via # SMA1 ports by a cable and $iface_nic2 receives 1PPS signals from $iface_nic1 apiVersion: ptp.openshift.io/v1 kind: PtpConfig metadata: name: grandmaster namespace: openshift-ptp annotations: {} spec: profile: - name: "grandmaster" ptp4lOpts: "-2 --summary_interval -4" phc2sysOpts: -r -u 0 -m -N 8 -R 16 -s $iface_nic1 -n 24 ptpSchedulingPolicy: SCHED_FIFO ptpSchedulingPriority: 10 ptpSettings: logReduce: "true" plugins: e810: enableDefaultConfig: false settings: LocalMaxHoldoverOffSet: 1500 LocalHoldoverTimeout: 14400 MaxInSpecOffset: 1500 pins: $e810_pins # "$iface_nic1": # "U.FL2": "0 2" # "U.FL1": "0 1" # "SMA2": "0 2" # "SMA1": "2 1" # "$iface_nic2": # "U.FL2": "0 2" # "U.FL1": "0 1" # "SMA2": "0 2" # "SMA1": "1 1" ublxCmds: - args: #ubxtool -P 29.20 -z CFG-HW-ANT_CFG_VOLTCTRL,1 - "-P" - "29.20" - "-z" - "CFG-HW-ANT_CFG_VOLTCTRL,1" reportOutput: false - args: #ubxtool -P 29.20 -e GPS - "-P" - "29.20" - "-e" - "GPS" reportOutput: false - args: #ubxtool -P 29.20 -d Galileo - "-P" - "29.20" - "-d" - "Galileo" reportOutput: false - args: #ubxtool -P 29.20 -d GLONASS - "-P" - "29.20" - "-d" - "GLONASS" reportOutput: false - args: #ubxtool -P 29.20 -d BeiDou - "-P" - "29.20" - "-d" - "BeiDou" reportOutput: false - args: #ubxtool -P 29.20 -d SBAS - "-P" - "29.20" - "-d" - "SBAS" reportOutput: false - args: #ubxtool -P 29.20 -t -w 5 -v 1 -e SURVEYIN,600,50000 - "-P" - "29.20" - "-t" - "-w" - "5" - "-v" - "1" - "-e" - "SURVEYIN,600,50000" reportOutput: true - args: #ubxtool -P 29.20 -p MON-HW - "-P" - "29.20" - "-p" - "MON-HW" reportOutput: true - args: #ubxtool -P 29.20 -p CFG-MSG,1,38,248 - "-P" - "29.20" - "-p" - "CFG-MSG,1,38,248" reportOutput: true ts2phcOpts: " " ts2phcConf: | [nmea] ts2phc.master 1 [global] use_syslog 0 verbose 1 logging_level 7 ts2phc.pulsewidth 100000000 #cat /dev/GNSS to find available serial port #example value of gnss_serialport is /dev/ttyGNSS_1700_0 ts2phc.nmea_serialport $gnss_serialport [$iface_nic1] ts2phc.extts_polarity rising ts2phc.extts_correction 0 [$iface_nic2] ts2phc.master 0 ts2phc.extts_polarity rising #this is a measured value in nanoseconds to compensate for SMA cable delay ts2phc.extts_correction -10 ptp4lConf: | [$iface_nic1] masterOnly 1 [$iface_nic1_1] masterOnly 1 [$iface_nic1_2] masterOnly 1 [$iface_nic1_3] masterOnly 1 [$iface_nic2] masterOnly 1 [$iface_nic2_1] masterOnly 1 [$iface_nic2_2] masterOnly 1 [$iface_nic2_3] masterOnly 1 [global] # # Default Data Set # twoStepFlag 1 priority1 128 priority2 128 domainNumber 24 #utc_offset 37 clockClass 6 clockAccuracy 0x27 offsetScaledLogVariance 0xFFFF free_running 0 freq_est_interval 1 dscp_event 0 dscp_general 0 dataset_comparison G.8275.x G.8275.defaultDS.localPriority 128 # # Port Data Set # logAnnounceInterval -3 logSyncInterval -4 logMinDelayReqInterval -4 logMinPdelayReqInterval 0 announceReceiptTimeout 3 syncReceiptTimeout 0 delayAsymmetry 0 fault_reset_interval -4 neighborPropDelayThresh 20000000 masterOnly 0 G.8275.portDS.localPriority 128 # # Run time options # assume_two_step 0 logging_level 6 path_trace_enabled 0 follow_up_info 0 hybrid_e2e 0 inhibit_multicast_service 0 net_sync_monitor 0 tc_spanning_tree 0 tx_timestamp_timeout 50 unicast_listen 0 unicast_master_table 0 unicast_req_duration 3600 use_syslog 1 verbose 0 summary_interval -4 kernel_leap 1 check_fup_sync 0 clock_class_threshold 7 # # Servo Options # pi_proportional_const 0.0 pi_integral_const 0.0 pi_proportional_scale 0.0 pi_proportional_exponent -0.3 pi_proportional_norm_max 0.7 pi_integral_scale 0.0 pi_integral_exponent 0.4 pi_integral_norm_max 0.3 step_threshold 2.0 first_step_threshold 0.00002 clock_servo pi sanity_freq_limit 200000000 ntpshm_segment 0 # # Transport options # transportSpecific 0x0 ptp_dst_mac 01:1B:19:00:00:00 p2p_dst_mac 01:80:C2:00:00:0E udp_ttl 1 udp6_scope 0x0E uds_address /var/run/ptp4l # # Default interface options # clock_type BC network_transport L2 delay_mechanism E2E time_stamping hardware tsproc_mode filter delay_filter moving_median delay_filter_length 10 egressLatency 0 ingressLatency 0 boundary_clock_jbod 1 # # Clock description # productDescription ;; revisionData ;; manufacturerIdentity 00:00:00 userDescription ; timeSource 0x20 recommend: - profile: "grandmaster" priority: 4 match: - nodeLabel: "node-role.kubernetes.io/$mcp"NoteFor E810 Westport Channel NICs, set the value for
ts2phc.nmea_serialportto/dev/gnss0.Create the CR by running the following command:
$ oc create -f grandmaster-clock-ptp-config-dual-nics.yaml
Verification
Check that the
PtpConfigprofile is applied to the node.Get the list of pods in the
openshift-ptpnamespace by running the following command:$ oc get pods -n openshift-ptp -o wideExample output
NAME                          READY   STATUS    RESTARTS   AGE     IP             NODE
linuxptp-daemon-74m2g         3/3     Running   3          4d15h   10.16.230.7    compute-1.example.com
ptp-operator-5f4f48d7c-x7zkf  1/1     Running   1          4d15h   10.128.1.145   compute-1.example.com
Check that the profile is correct. Examine the logs of the
linuxptpdaemon that corresponds to the node you specified in thePtpConfigprofile. Run the following command:$ oc logs linuxptp-daemon-74m2g -n openshift-ptp -c linuxptp-daemon-containerExample output
ts2phc[509863.660]: [ts2phc.0.config] nmea delay: 347527248 ns
ts2phc[509863.660]: [ts2phc.0.config] ens2f0 extts index 0 at 1705516553.000000000 corr 0 src 1705516553.652499081 diff 0
ts2phc[509863.660]: [ts2phc.0.config] ens2f0 master offset          0 s2 freq      -0
I0117 18:35:16.000146 1633226 stats.go:57] state updated for ts2phc =s2
I0117 18:35:16.000163 1633226 event.go:417] dpll State s2, gnss State s2, tsphc state s2, gm state s2,
ts2phc[1705516516]:[ts2phc.0.config] ens2f0 nmea_status 1 offset 0 s2
GM[1705516516]:[ts2phc.0.config] ens2f0 T-GM-STATUS s2
ts2phc[509863.677]: [ts2phc.0.config] ens7f0 extts index 0 at 1705516553.000000010 corr -10 src 1705516553.652499081 diff 0
ts2phc[509863.677]: [ts2phc.0.config] ens7f0 master offset          0 s2 freq      -0
I0117 18:35:16.016597 1633226 stats.go:57] state updated for ts2phc =s2
phc2sys[509863.719]: [ptp4l.0.config] CLOCK_REALTIME phc offset        -6 s2 freq  +15441 delay    510
phc2sys[509863.782]: [ptp4l.0.config] CLOCK_REALTIME phc offset        -7 s2 freq  +15438 delay    502
17.2.5.1. Grandmaster clock PtpConfig configuration reference
The following reference information describes the configuration options for the PtpConfig custom resource (CR) that configures the linuxptp services (ptp4l, phc2sys, ts2phc) as a grandmaster clock.
| PtpConfig CR field | Description |
|---|---|
|
|
Specify an array of
The plugin mechanism allows the PTP Operator to do automated hardware configuration. For the Intel Westport Channel NIC, when |
|
|
Specify system configuration options for the |
|
|
Specify the required configuration to start |
|
| Specify the maximum amount of time to wait for the transmit (TX) timestamp from the sender before discarding the data. |
|
| Specify the JBOD boundary clock time delay value. This value is used to correct the time values that are passed between the network time devices. |
|
|
Specify system config options for the Note
Ensure that the network interface listed here is configured as grandmaster and is referenced as required in the |
|
|
Configure the scheduling policy for |
|
|
Set an integer value from 1-65 to configure FIFO priority for |
|
|
Optional. If |
|
|
Sets the configuration for the
|
|
|
Set options for the |
|
|
Specify an array of one or more |
|
|
Specify the |
|
|
Specify the |
|
|
Specify |
|
|
Set |
|
|
Set |
17.2.5.2. Grandmaster clock class sync state reference
The following table describes the PTP grandmaster clock (T-GM) gm.ClockClass states. Clock class states categorize T-GM clocks based on their accuracy and stability with regard to the Primary Reference Time Clock (PRTC) or other timing source.
Holdover specification is the amount of time a PTP clock can maintain synchronization without receiving updates from the primary time source.
| Clock class state | Description |
|---|---|
|
|
T-GM clock is connected to a PRTC in |
|
|
T-GM clock is in |
|
|
T-GM clock is in |
|
|
T-GM clock is in |
For more information, see "Phase/time traceability information", ITU-T G.8275.1/Y.1369.1 Recommendations.
17.2.5.3. Intel Westport Channel E810 hardware configuration reference
Use this information to understand how to use the Intel E810-XXVDA4T hardware plugin to configure the E810 network interface as PTP grandmaster clock. Hardware pin configuration determines how the network interface interacts with other components and devices in the system. The E810-XXVDA4T NIC has four connectors for external 1PPS signals: SMA1, SMA2, U.FL1, and U.FL2.
| Hardware pin | Recommended setting | Description |
|---|---|---|
|
|
|
Disables the |
|
|
|
Disables the |
|
|
|
Disables the |
|
|
|
Disables the |
SMA1 and U.FL1 connectors share channel one. SMA2 and U.FL2 connectors share channel two.
Set spec.profile.plugins.e810.ublxCmds parameters to configure the GNSS clock in the PtpConfig custom resource (CR).
You must configure an offset value to compensate for T-GM GPS antenna cable signal delay. To configure the optimal T-GM antenna offset value, make precise measurements of the GNSS antenna cable signal delay. Red Hat cannot assist in this measurement or provide any values for the required delay offsets.
Each of these ublxCmds stanzas correspond to a configuration that is applied to the host NIC by using ubxtool commands. For example:
ublxCmds:
  - args:
      - "-P"
      - "29.20"
      - "-z"
      - "CFG-HW-ANT_CFG_VOLTCTRL,1"
      - "-z"
      - "CFG-TP-ANT_CABLEDELAY,<antenna_delay_offset>"
reportOutput: false- 1
- Measured T-GM antenna delay offset in nanoseconds. To get the required delay offset value, you must measure the cable delay using external test equipment.
The following table describes the equivalent ubxtool commands:
| ubxtool command | Description |
|---|---|
|
|
Enables antenna voltage control, allows antenna status to be reported in the |
|
| Enables the antenna to receive GPS signals. |
|
| Configures the antenna to receive signal from the Galileo GPS satellite. |
|
| Disables the antenna from receiving signal from the GLONASS GPS satellite. |
|
| Disables the antenna from receiving signal from the BeiDou GPS satellite. |
|
| Disables the antenna from receiving signal from the SBAS GPS satellite. |
|
| Configures the GNSS receiver survey-in process to improve its initial position estimate. This can take up to 24 hours to achieve an optimal result. |
|
| Runs a single automated scan of the hardware and reports on the NIC state and configuration settings. |
17.2.5.4. Dual E810 Westport Channel NIC configuration reference
Use this information to understand how to use the Intel E810-XXVDA4T hardware plugin to configure a pair of E810 network interfaces as PTP grandmaster clock (T-GM).
Before you configure the dual NIC cluster host, you must connect the two NICs with an SMA1 cable using the 1PPS faceplace connections.
When you configure a dual NIC T-GM, you need to compensate for the 1PPS signal delay that occurs when you connect the NICs using the SMA1 connection ports. Various factors such as cable length, ambient temperature, and component and manufacturing tolerances can affect the signal delay. To compensate for the delay, you must calculate the specific value that you use to offset the signal delay.
| PtpConfig field | Description |
|---|---|
|
| Configure the E810 hardware pins using the PTP Operator E810 hardware plugin.
|
|
|
Use the |
|
|
Set the value of |
17.2.6. Configuring dynamic leap seconds handling for PTP grandmaster clocks
The PTP Operator container image includes the latest leap-seconds.list file that is available at the time of release. You can configure the PTP Operator to automatically update the leap second file by using Global Positioning System (GPS) announcements.
Leap second information is stored in an automatically generated ConfigMap resource named leap-configmap in the openshift-ptp namespace. The PTP Operator mounts the leap-configmap resource as a volume in the linuxptp-daemon pod that is accessible by the ts2phc process.
If the GPS satellite broadcasts new leap second data, the PTP Operator updates the leap-configmap resource with the new data. The ts2phc process picks up the changes automatically.
The following procedure is provided as reference. The 4.14 version of the PTP Operator enables automatic leap second management by default.
Prerequisites
-
You have installed the OpenShift CLI (
oc). -
You have logged in as a user with
cluster-adminprivileges. - You have installed the PTP Operator and configured a PTP grandmaster clock (T-GM) in the cluster.
Procedure
Configure automatic leap second handling in the
phc2sysOptssection of thePtpConfigCR. Set the following options:phc2sysOpts: -r -u 0 -m -N 8 -R 16 -S 2 -s ens2f0 -n 241 NotePreviously, the T-GM required an offset adjustment in the
phc2sysconfiguration (-O -37) to account for historical leap seconds. This is no longer needed.Configure the Intel e810 NIC to enable periodical reporting of
NAV-TIMELSmessages by the GPS receiver in thespec.profile.plugins.e810.ublxCmdssection of thePtpConfigCR. For example:- args: #ubxtool -P 29.20 -p CFG-MSG,1,38,248 - "-P" - "29.20" - "-p" - "CFG-MSG,1,38,248"
Verification
Validate that the configured T-GM is receiving
NAV-TIMELSmessages from the connected GPS. Run the following command:$ oc -n openshift-ptp -c linuxptp-daemon-container exec -it $(oc -n openshift-ptp get pods -o name | grep daemon) -- ubxtool -t -p NAV-TIMELS -P 29.20Example output
1722509534.4417
UBX-NAV-STATUS:
  iTOW 384752000 gpsFix 5 flags 0xdd fixStat 0x0 flags2 0x8
  ttff 18261, msss 1367642864

1722509534.4419
UBX-NAV-TIMELS:
  iTOW 384752000 version 0 reserved2 0 0 0 srcOfCurrLs 2
  currLs 18 srcOfLsChange 2 lsChange 0 timeToLsEvent 70376866
  dateOfLsGpsWn 2441 dateOfLsGpsDn 7 reserved2 0 0 0
  valid x3

1722509534.4421
UBX-NAV-CLOCK:
  iTOW 384752000 clkB 784281 clkD 435 tAcc 3 fAcc 215

1722509535.4477
UBX-NAV-STATUS:
  iTOW 384753000 gpsFix 5 flags 0xdd fixStat 0x0 flags2 0x8
  ttff 18261, msss 1367643864

1722509535.4479
UBX-NAV-CLOCK:
  iTOW 384753000 clkB 784716 clkD 435 tAcc 3 fAcc 218
Validate that the
leap-configmapresource has been successfully generated by the PTP Operator and is up to date with the latest version of the leap-seconds.list. Run the following command:$ oc -n openshift-ptp get configmap leap-configmap -o jsonpath='{.data.<node_name>}'1 Example output
# Do not edit
# This file is generated automatically by linuxptp-daemon
#$  3913697179
#@  4291747200
2272060800     10    # 1 Jan 1972
2287785600     11    # 1 Jul 1972
2303683200     12    # 1 Jan 1973
2335219200     13    # 1 Jan 1974
2366755200     14    # 1 Jan 1975
2398291200     15    # 1 Jan 1976
2429913600     16    # 1 Jan 1977
2461449600     17    # 1 Jan 1978
2492985600     18    # 1 Jan 1979
2524521600     19    # 1 Jan 1980
2571782400     20    # 1 Jul 1981
2603318400     21    # 1 Jul 1982
2634854400     22    # 1 Jul 1983
2698012800     23    # 1 Jul 1985
2776982400     24    # 1 Jan 1988
2840140800     25    # 1 Jan 1990
2871676800     26    # 1 Jan 1991
2918937600     27    # 1 Jul 1992
2950473600     28    # 1 Jul 1993
2982009600     29    # 1 Jul 1994
3029443200     30    # 1 Jan 1996
3076704000     31    # 1 Jul 1997
3124137600     32    # 1 Jan 1999
3345062400     33    # 1 Jan 2006
3439756800     34    # 1 Jan 2009
3550089600     35    # 1 Jul 2012
3644697600     36    # 1 Jul 2015
3692217600     37    # 1 Jan 2017

#h  e65754d4 8f39962b aa854a61 661ef546 d2af0bfa
17.2.7. Configuring linuxptp services as a boundary clock
You can configure the linuxptp services (ptp4l, phc2sys) as boundary clock by creating a PtpConfig custom resource (CR) object.
Use the following example PtpConfig CR as the basis to configure linuxptp services as the boundary clock for your particular hardware and environment. This example CR does not configure PTP fast events. To configure PTP fast events, set appropriate values for ptp4lOpts, ptp4lConf, and ptpClockThreshold. ptpClockThreshold is used only when events are enabled. See "Configuring the PTP fast event notifications publisher" for more information.
Prerequisites
-
Install the OpenShift CLI (
oc). -
Log in as a user with
cluster-adminprivileges. - Install the PTP Operator.
Procedure
Create the following
PtpConfigCR, and then save the YAML in theboundary-clock-ptp-config.yamlfile.Example PTP boundary clock configuration
apiVersion: ptp.openshift.io/v1
kind: PtpConfig
metadata:
  name: boundary-clock
  namespace: openshift-ptp
  annotations: {}
spec:
  profile:
    - name: boundary-clock
      ptp4lOpts: "-2"
      phc2sysOpts: "-a -r -n 24"
      ptpSchedulingPolicy: SCHED_FIFO
      ptpSchedulingPriority: 10
      ptpSettings:
        logReduce: "true"
      ptp4lConf: |
        # The interface name is hardware-specific
        [$iface_slave]
        masterOnly 0
        [$iface_master_1]
        masterOnly 1
        [$iface_master_2]
        masterOnly 1
        [$iface_master_3]
        masterOnly 1
        [global]
        #
        # Default Data Set
        #
        twoStepFlag 1
        slaveOnly 0
        priority1 128
        priority2 128
        domainNumber 24
        #utc_offset 37
        clockClass 248
        clockAccuracy 0xFE
        offsetScaledLogVariance 0xFFFF
        free_running 0
        freq_est_interval 1
        dscp_event 0
        dscp_general 0
        dataset_comparison G.8275.x
        G.8275.defaultDS.localPriority 128
        #
        # Port Data Set
        #
        logAnnounceInterval -3
        logSyncInterval -4
        logMinDelayReqInterval -4
        logMinPdelayReqInterval -4
        announceReceiptTimeout 3
        syncReceiptTimeout 0
        delayAsymmetry 0
        fault_reset_interval -4
        neighborPropDelayThresh 20000000
        masterOnly 0
        G.8275.portDS.localPriority 128
        #
        # Run time options
        #
        assume_two_step 0
        logging_level 6
        path_trace_enabled 0
        follow_up_info 0
        hybrid_e2e 0
        inhibit_multicast_service 0
        net_sync_monitor 0
        tc_spanning_tree 0
        tx_timestamp_timeout 50
        unicast_listen 0
        unicast_master_table 0
        unicast_req_duration 3600
        use_syslog 1
        verbose 0
        summary_interval 0
        kernel_leap 1
        check_fup_sync 0
        clock_class_threshold 135
        #
        # Servo Options
        #
        pi_proportional_const 0.0
        pi_integral_const 0.0
        pi_proportional_scale 0.0
        pi_proportional_exponent -0.3
        pi_proportional_norm_max 0.7
        pi_integral_scale 0.0
        pi_integral_exponent 0.4
        pi_integral_norm_max 0.3
        step_threshold 2.0
        first_step_threshold 0.00002
        max_frequency 900000000
        clock_servo pi
        sanity_freq_limit 200000000
        ntpshm_segment 0
        #
        # Transport options
        #
        transportSpecific 0x0
        ptp_dst_mac 01:1B:19:00:00:00
        p2p_dst_mac 01:80:C2:00:00:0E
        udp_ttl 1
        udp6_scope 0x0E
        uds_address /var/run/ptp4l
        #
        # Default interface options
        #
        clock_type BC
        network_transport L2
        delay_mechanism E2E
        time_stamping hardware
        tsproc_mode filter
        delay_filter moving_median
        delay_filter_length 10
        egressLatency 0
        ingressLatency 0
        boundary_clock_jbod 0
        #
        # Clock description
        #
        productDescription ;;
        revisionData ;;
        manufacturerIdentity 00:00:00
        userDescription ;
        timeSource 0xA0
  recommend:
    - profile: boundary-clock
      priority: 4
      match:
        - nodeLabel: "node-role.kubernetes.io/$mcp"
Expand Table 17.6. PTP boundary clock CR configuration options CR field Description nameThe name of the
PtpConfigCR.profileSpecify an array of one or more
profileobjects.nameSpecify the name of a profile object which uniquely identifies a profile object.
ptp4lOptsSpecify system config options for the
ptp4lservice. The options should not include the network interface name-i <interface>and service config file-f /etc/ptp4l.confbecause the network interface name and the service config file are automatically appended.ptp4lConfSpecify the required configuration to start
ptp4las boundary clock. For example,ens1f0synchronizes from a grandmaster clock andens1f3synchronizes connected devices.<interface_1>The interface that receives the synchronization clock.
<interface_2>The interface that sends the synchronization clock.
tx_timestamp_timeoutFor Intel Columbiaville 800 Series NICs, set
tx_timestamp_timeoutto50.boundary_clock_jbodFor Intel Columbiaville 800 Series NICs, ensure
boundary_clock_jbodis set to0. For Intel Fortville X710 Series NICs, ensureboundary_clock_jbodis set to1.phc2sysOptsSpecify system config options for the
phc2sysservice. If this field is empty, the PTP Operator does not start thephc2sysservice.ptpSchedulingPolicyScheduling policy for ptp4l and phc2sys processes. Default value is
SCHED_OTHER. UseSCHED_FIFOon systems that support FIFO scheduling.ptpSchedulingPriorityInteger value from 1-65 used to set FIFO priority for
ptp4landphc2sysprocesses whenptpSchedulingPolicyis set toSCHED_FIFO. TheptpSchedulingPriorityfield is not used whenptpSchedulingPolicyis set toSCHED_OTHER.ptpClockThresholdOptional. If
ptpClockThresholdis not present, default values are used for theptpClockThresholdfields.ptpClockThresholdconfigures how long after the PTP master clock is disconnected before PTP events are triggered.holdOverTimeoutis the time value in seconds before the PTP clock event state changes toFREERUNwhen the PTP master clock is disconnected. ThemaxOffsetThresholdandminOffsetThresholdsettings configure offset values in nanoseconds that compare against the values forCLOCK_REALTIME(phc2sys) or master offset (ptp4l). When theptp4lorphc2sysoffset value is outside this range, the PTP clock state is set toFREERUN. When the offset value is within this range, the PTP clock state is set toLOCKED.recommendSpecify an array of one or more
recommendobjects that define rules on how theprofileshould be applied to nodes..recommend.profileSpecify the
.recommend.profileobject name defined in theprofilesection..recommend.prioritySpecify the
prioritywith an integer value between0and99. A larger number gets lower priority, so a priority of99is lower than a priority of10. If a node can be matched with multiple profiles according to rules defined in thematchfield, the profile with the higher priority is applied to that node..recommend.matchSpecify
.recommend.matchrules withnodeLabelornodeNamevalues..recommend.match.nodeLabelSet
nodeLabelwith thekeyof thenode.Labelsfield from the node object by using theoc get nodes --show-labelscommand. For example,node-role.kubernetes.io/worker..recommend.match.nodeNameSet
nodeNamewith the value of thenode.Namefield from the node object by using theoc get nodescommand. For example,compute-1.example.com.Create the CR by running the following command:
$ oc create -f boundary-clock-ptp-config.yaml
Verification
Check that the
PtpConfigprofile is applied to the node.Get the list of pods in the
openshift-ptpnamespace by running the following command:$ oc get pods -n openshift-ptp -o wideExample output
NAME                            READY   STATUS    RESTARTS   AGE   IP               NODE
linuxptp-daemon-4xkbb           1/1     Running   0          43m   10.1.196.24      compute-0.example.com
linuxptp-daemon-tdspf           1/1     Running   0          43m   10.1.196.25      compute-1.example.com
ptp-operator-657bbb64c8-2f8sj   1/1     Running   0          43m   10.129.0.61      control-plane-1.example.com
Check that the profile is correct. Examine the logs of the
linuxptpdaemon that corresponds to the node you specified in thePtpConfigprofile. Run the following command:$ oc logs linuxptp-daemon-4xkbb -n openshift-ptp -c linuxptp-daemon-containerExample output
I1115 09:41:17.117596 4143292 daemon.go:107] in applyNodePTPProfile
I1115 09:41:17.117604 4143292 daemon.go:109] updating NodePTPProfile to:
I1115 09:41:17.117607 4143292 daemon.go:110] ------------------------------------
I1115 09:41:17.117612 4143292 daemon.go:102] Profile Name: profile1
I1115 09:41:17.117616 4143292 daemon.go:102] Interface:
I1115 09:41:17.117620 4143292 daemon.go:102] Ptp4lOpts: -2
I1115 09:41:17.117623 4143292 daemon.go:102] Phc2sysOpts: -a -r -n 24
I1115 09:41:17.117626 4143292 daemon.go:116] ------------------------------------
17.2.7.1. Configuring linuxptp services as boundary clocks for dual NIC hardware
You can configure the linuxptp services (ptp4l, phc2sys) as boundary clocks for dual-NIC hardware by creating a PtpConfig custom resource (CR) object for each NIC.
Dual NIC hardware allows you to connect each NIC to the same upstream leader clock with separate ptp4l instances for each NIC feeding the downstream clocks.
Prerequisites
-
Install the OpenShift CLI (
oc). -
Log in as a user with
cluster-adminprivileges. - Install the PTP Operator.
Procedure
Create two separate
PtpConfigCRs, one for each NIC, using the reference CR in "Configuring linuxptp services as a boundary clock" as the basis for each CR. For example:Create
boundary-clock-ptp-config-nic1.yaml, specifying values forphc2sysOpts:apiVersion: ptp.openshift.io/v1 kind: PtpConfig metadata: name: boundary-clock-ptp-config-nic1 namespace: openshift-ptp spec: profile: - name: "profile1" ptp4lOpts: "-2 --summary_interval -4" ptp4lConf: |1 [ens5f1] masterOnly 1 [ens5f0] masterOnly 0 ... phc2sysOpts: "-a -r -m -n 24 -N 8 -R 16"2 - 1
- Specify the required interfaces to start
ptp4las a boundary clock. For example,ens5f0synchronizes from a grandmaster clock andens5f1synchronizes connected devices. - 2
- Required
phc2sysOptsvalues.-mprints messages tostdout. Thelinuxptp-daemonDaemonSetparses the logs and generates Prometheus metrics.
Create
boundary-clock-ptp-config-nic2.yaml, removing thephc2sysOptsfield altogether to disable thephc2sysservice for the second NIC:apiVersion: ptp.openshift.io/v1 kind: PtpConfig metadata: name: boundary-clock-ptp-config-nic2 namespace: openshift-ptp spec: profile: - name: "profile2" ptp4lOpts: "-2 --summary_interval -4" ptp4lConf: |1 [ens7f1] masterOnly 1 [ens7f0] masterOnly 0 ...- 1
- Specify the required interfaces to start
ptp4las a boundary clock on the second NIC.
NoteYou must completely remove the
phc2sysOptsfield from the secondPtpConfigCR to disable thephc2sysservice on the second NIC.
Create the dual NIC
PtpConfigCRs by running the following commands:Create the CR that configures PTP for the first NIC:
$ oc create -f boundary-clock-ptp-config-nic1.yamlCreate the CR that configures PTP for the second NIC:
$ oc create -f boundary-clock-ptp-config-nic2.yaml
Verification
Check that the PTP Operator has applied the
PtpConfigCRs for both NICs. Examine the logs for thelinuxptpdaemon corresponding to the node that has the dual NIC hardware installed. For example, run the following command:$ oc logs linuxptp-daemon-cvgr6 -n openshift-ptp -c linuxptp-daemon-containerExample output
ptp4l[80828.335]: [ptp4l.1.config] master offset          5 s2 freq   -5727 path delay       519
ptp4l[80828.343]: [ptp4l.0.config] master offset         -5 s2 freq  -10607 path delay       533
phc2sys[80828.390]: [ptp4l.0.config] CLOCK_REALTIME phc offset         1 s2 freq  -87239 delay    539
17.2.8. Configuring linuxptp services as an ordinary clock
You can configure linuxptp services (ptp4l, phc2sys) as ordinary clock by creating a PtpConfig custom resource (CR) object.
Use the following example PtpConfig CR as the basis to configure linuxptp services as an ordinary clock for your particular hardware and environment. This example CR does not configure PTP fast events. To configure PTP fast events, set appropriate values for ptp4lOpts, ptp4lConf, and ptpClockThreshold. ptpClockThreshold is required only when events are enabled. See "Configuring the PTP fast event notifications publisher" for more information.
Prerequisites
-
Install the OpenShift CLI (
oc). -
Log in as a user with
cluster-adminprivileges. - Install the PTP Operator.
Procedure
Create the following
PtpConfigCR, and then save the YAML in theordinary-clock-ptp-config.yamlfile.Example PTP ordinary clock configuration
apiVersion: ptp.openshift.io/v1
kind: PtpConfig
metadata:
  name: ordinary-clock
  namespace: openshift-ptp
  annotations: {}
spec:
  profile:
    - name: ordinary-clock
      # The interface name is hardware-specific
      interface: $interface
      ptp4lOpts: "-2 -s"
      phc2sysOpts: "-a -r -n 24"
      ptpSchedulingPolicy: SCHED_FIFO
      ptpSchedulingPriority: 10
      ptpSettings:
        logReduce: "true"
      ptp4lConf: |
        [global]
        #
        # Default Data Set
        #
        twoStepFlag 1
        slaveOnly 1
        priority1 128
        priority2 128
        domainNumber 24
        #utc_offset 37
        clockClass 255
        clockAccuracy 0xFE
        offsetScaledLogVariance 0xFFFF
        free_running 0
        freq_est_interval 1
        dscp_event 0
        dscp_general 0
        dataset_comparison G.8275.x
        G.8275.defaultDS.localPriority 128
        #
        # Port Data Set
        #
        logAnnounceInterval -3
        logSyncInterval -4
        logMinDelayReqInterval -4
        logMinPdelayReqInterval -4
        announceReceiptTimeout 3
        syncReceiptTimeout 0
        delayAsymmetry 0
        fault_reset_interval -4
        neighborPropDelayThresh 20000000
        masterOnly 0
        G.8275.portDS.localPriority 128
        #
        # Run time options
        #
        assume_two_step 0
        logging_level 6
        path_trace_enabled 0
        follow_up_info 0
        hybrid_e2e 0
        inhibit_multicast_service 0
        net_sync_monitor 0
        tc_spanning_tree 0
        tx_timestamp_timeout 50
        unicast_listen 0
        unicast_master_table 0
        unicast_req_duration 3600
        use_syslog 1
        verbose 0
        summary_interval 0
        kernel_leap 1
        check_fup_sync 0
        clock_class_threshold 7
        #
        # Servo Options
        #
        pi_proportional_const 0.0
        pi_integral_const 0.0
        pi_proportional_scale 0.0
        pi_proportional_exponent -0.3
        pi_proportional_norm_max 0.7
        pi_integral_scale 0.0
        pi_integral_exponent 0.4
        pi_integral_norm_max 0.3
        step_threshold 2.0
        first_step_threshold 0.00002
        max_frequency 900000000
        clock_servo pi
        sanity_freq_limit 200000000
        ntpshm_segment 0
        #
        # Transport options
        #
        transportSpecific 0x0
        ptp_dst_mac 01:1B:19:00:00:00
        p2p_dst_mac 01:80:C2:00:00:0E
        udp_ttl 1
        udp6_scope 0x0E
        uds_address /var/run/ptp4l
        #
        # Default interface options
        #
        clock_type OC
        network_transport L2
        delay_mechanism E2E
        time_stamping hardware
        tsproc_mode filter
        delay_filter moving_median
        delay_filter_length 10
        egressLatency 0
        ingressLatency 0
        boundary_clock_jbod 0
        #
        # Clock description
        #
        productDescription ;;
        revisionData ;;
        manufacturerIdentity 00:00:00
        userDescription ;
        timeSource 0xA0
  recommend:
    - profile: ordinary-clock
      priority: 4
      match:
        - nodeLabel: "node-role.kubernetes.io/$mcp"
Expand Table 17.7. PTP ordinary clock CR configuration options CR field Description nameThe name of the
PtpConfigCR.profileSpecify an array of one or more
profileobjects. Each profile must be uniquely named.interfaceSpecify the network interface to be used by the
ptp4lservice, for exampleens787f1.ptp4lOptsSpecify system config options for the
ptp4lservice, for example-2to select the IEEE 802.3 network transport. The options should not include the network interface name-i <interface>and service config file-f /etc/ptp4l.confbecause the network interface name and the service config file are automatically appended. Append--summary_interval -4to use PTP fast events with this interface.phc2sysOptsSpecify system config options for the
phc2sysservice. If this field is empty, the PTP Operator does not start thephc2sysservice. For Intel Columbiaville 800 Series NICs, setphc2sysOptsoptions to-a -r -m -n 24 -N 8 -R 16.-mprints messages tostdout. Thelinuxptp-daemonDaemonSetparses the logs and generates Prometheus metrics.ptp4lConfSpecify a string that contains the configuration to replace the default
/etc/ptp4l.conffile. To use the default configuration, leave the field empty.tx_timestamp_timeoutFor Intel Columbiaville 800 Series NICs, set
tx_timestamp_timeoutto50.boundary_clock_jbodFor Intel Columbiaville 800 Series NICs, set
boundary_clock_jbodto0.ptpSchedulingPolicyScheduling policy for
ptp4landphc2sysprocesses. Default value isSCHED_OTHER. UseSCHED_FIFOon systems that support FIFO scheduling.ptpSchedulingPriorityInteger value from 1-65 used to set FIFO priority for
ptp4landphc2sysprocesses whenptpSchedulingPolicyis set toSCHED_FIFO. TheptpSchedulingPriorityfield is not used whenptpSchedulingPolicyis set toSCHED_OTHER.ptpClockThresholdOptional. If
ptpClockThresholdis not present, default values are used for theptpClockThresholdfields.ptpClockThresholdconfigures how long after the PTP master clock is disconnected before PTP events are triggered.holdOverTimeoutis the time value in seconds before the PTP clock event state changes toFREERUNwhen the PTP master clock is disconnected. ThemaxOffsetThresholdandminOffsetThresholdsettings configure offset values in nanoseconds that compare against the values forCLOCK_REALTIME(phc2sys) or master offset (ptp4l). When theptp4lorphc2sysoffset value is outside this range, the PTP clock state is set toFREERUN. When the offset value is within this range, the PTP clock state is set toLOCKED.recommendSpecify an array of one or more
recommendobjects that define rules on how theprofileshould be applied to nodes..recommend.profileSpecify the
.recommend.profileobject name defined in theprofilesection..recommend.prioritySet
.recommend.priorityto0for ordinary clock..recommend.matchSpecify
.recommend.matchrules withnodeLabelornodeNamevalues..recommend.match.nodeLabelSet
nodeLabelwith thekeyof thenode.Labelsfield from the node object by using theoc get nodes --show-labelscommand. For example,node-role.kubernetes.io/worker..recommend.match.nodeNameSet
nodeNamewith the value of thenode.Namefield from the node object by using theoc get nodescommand. For example,compute-1.example.com.Create the
PtpConfigCR by running the following command:$ oc create -f ordinary-clock-ptp-config.yaml
Verification
Check that the
PtpConfigprofile is applied to the node.Get the list of pods in the
openshift-ptpnamespace by running the following command:$ oc get pods -n openshift-ptp -o wideExample output
NAME                            READY   STATUS    RESTARTS   AGE   IP               NODE
linuxptp-daemon-4xkbb           1/1     Running   0          43m   10.1.196.24      compute-0.example.com
linuxptp-daemon-tdspf           1/1     Running   0          43m   10.1.196.25      compute-1.example.com
ptp-operator-657bbb64c8-2f8sj   1/1     Running   0          43m   10.129.0.61      control-plane-1.example.com
Check that the profile is correct. Examine the logs of the
linuxptpdaemon that corresponds to the node you specified in thePtpConfigprofile. Run the following command:$ oc logs linuxptp-daemon-4xkbb -n openshift-ptp -c linuxptp-daemon-containerExample output
I1115 09:41:17.117596 4143292 daemon.go:107] in applyNodePTPProfile
I1115 09:41:17.117604 4143292 daemon.go:109] updating NodePTPProfile to:
I1115 09:41:17.117607 4143292 daemon.go:110] ------------------------------------
I1115 09:41:17.117612 4143292 daemon.go:102] Profile Name: profile1
I1115 09:41:17.117616 4143292 daemon.go:102] Interface: ens787f1
I1115 09:41:17.117620 4143292 daemon.go:102] Ptp4lOpts: -2 -s
I1115 09:41:17.117623 4143292 daemon.go:102] Phc2sysOpts: -a -r -n 24
I1115 09:41:17.117626 4143292 daemon.go:116] ------------------------------------
17.2.8.1. Intel Columbiaville E800 series NIC as PTP ordinary clock reference
The following table describes the changes that you must make to the reference PTP configuration to use Intel Columbiaville E800 series NICs as ordinary clocks. Make the changes in a PtpConfig custom resource (CR) that you apply to the cluster.
| PTP configuration | Recommended setting |
|---|---|
|
|
|
|
|
|
|
|
|
For phc2sysOpts, -m prints messages to stdout. The linuxptp-daemon DaemonSet parses the logs and generates Prometheus metrics.
17.2.9. Configuring FIFO priority scheduling for PTP hardware
In telco or other deployment types that require low latency performance, PTP daemon threads run in a constrained CPU footprint alongside the rest of the infrastructure components. By default, PTP threads run with the SCHED_OTHER policy. Under high load, these threads might not get the scheduling latency they require for error-free operation.
To mitigate against potential scheduling latency errors, you can configure the PTP Operator linuxptp services to allow threads to run with a SCHED_FIFO policy. If SCHED_FIFO is set for a PtpConfig CR, then ptp4l and phc2sys will run in the parent container under chrt with a priority set by the ptpSchedulingPriority field of the PtpConfig CR.
Setting ptpSchedulingPolicy is optional, and is only required if you are experiencing latency errors.
Procedure
Edit the
PtpConfigCR profile:$ oc edit PtpConfig -n openshift-ptpChange the
ptpSchedulingPolicyandptpSchedulingPriorityfields:apiVersion: ptp.openshift.io/v1 kind: PtpConfig metadata: name: <ptp_config_name> namespace: openshift-ptp ... spec: profile: - name: "profile1" ... ptpSchedulingPolicy: SCHED_FIFO1 ptpSchedulingPriority: 102 -
Save and exit to apply the changes to the
PtpConfigCR.
Verification
Get the name of the
linuxptp-daemonpod and corresponding node where thePtpConfigCR has been applied:$ oc get pods -n openshift-ptp -o wideExample output
NAME                            READY   STATUS    RESTARTS   AGE     IP            NODE
linuxptp-daemon-gmv2n           3/3     Running   0          1d17h   10.1.196.24   compute-0.example.com
linuxptp-daemon-lgm55           3/3     Running   0          1d17h   10.1.196.25   compute-1.example.com
ptp-operator-3r4dcvf7f4-zndk7   1/1     Running   0          1d7h    10.129.0.61   control-plane-1.example.com
Check that the
ptp4lprocess is running with the updatedchrtFIFO priority:$ oc -n openshift-ptp logs linuxptp-daemon-lgm55 -c linuxptp-daemon-container|grep chrtExample output
I1216 19:24:57.091872 1600715 daemon.go:285] /bin/chrt -f 65 /usr/sbin/ptp4l -f /var/run/ptp4l.0.config -2 --summary_interval -4 -m
17.2.10. Configuring log filtering for linuxptp services
The linuxptp daemon generates logs that you can use for debugging purposes. In telco or other deployment types that feature a limited storage capacity, these logs can add to the storage demand.
To reduce the number log messages, you can configure the PtpConfig custom resource (CR) to exclude log messages that report the master offset value. The master offset log message reports the difference between the current node’s clock and the master clock in nanoseconds.
Prerequisites
-
Install the OpenShift CLI (
oc). -
Log in as a user with
cluster-adminprivileges. - Install the PTP Operator.
Procedure
Edit the
PtpConfigCR:$ oc edit PtpConfig -n openshift-ptpIn
spec.profile, add theptpSettings.logReducespecification and set the value totrue:apiVersion: ptp.openshift.io/v1 kind: PtpConfig metadata: name: <ptp_config_name> namespace: openshift-ptp ... spec: profile: - name: "profile1" ... ptpSettings: logReduce: "true"NoteFor debugging purposes, you can revert this specification to
Falseto include the master offset messages.-
Save and exit to apply the changes to the
PtpConfigCR.
Verification
Get the name of the
linuxptp-daemonpod and corresponding node where thePtpConfigCR has been applied:$ oc get pods -n openshift-ptp -o wideExample output
NAME                            READY   STATUS    RESTARTS   AGE     IP            NODE
linuxptp-daemon-gmv2n           3/3     Running   0          1d17h   10.1.196.24   compute-0.example.com
linuxptp-daemon-lgm55           3/3     Running   0          1d17h   10.1.196.25   compute-1.example.com
ptp-operator-3r4dcvf7f4-zndk7   1/1     Running   0          1d7h    10.129.0.61   control-plane-1.example.com
Verify that master offset messages are excluded from the logs by running the following command:
$ oc -n openshift-ptp logs <linux_daemon_container> -c linuxptp-daemon-container | grep "master offset"1 - 1
- <linux_daemon_container> is the name of the
linuxptp-daemonpod, for examplelinuxptp-daemon-gmv2n.
When you configure the
logReducespecification, this command does not report any instances ofmaster offsetin the logs of thelinuxptpdaemon.
17.2.11. Troubleshooting common PTP Operator issues
Troubleshoot common problems with the PTP Operator by performing the following steps.
Prerequisites
-
Install the OpenShift Container Platform CLI (
oc). -
Log in as a user with
cluster-adminprivileges. - Install the PTP Operator on a bare-metal cluster with hosts that support PTP.
Procedure
Check the Operator and operands are successfully deployed in the cluster for the configured nodes.
$ oc get pods -n openshift-ptp -o wideExample output
NAME READY STATUS RESTARTS AGE IP NODE linuxptp-daemon-lmvgn 3/3 Running 0 4d17h 10.1.196.24 compute-0.example.com linuxptp-daemon-qhfg7 3/3 Running 0 4d17h 10.1.196.25 compute-1.example.com ptp-operator-6b8dcbf7f4-zndk7 1/1 Running 0 5d7h 10.129.0.61 control-plane-1.example.comNoteWhen the PTP fast event bus is enabled, the number of ready
linuxptp-daemonpods is3/3. If the PTP fast event bus is not enabled,2/2is displayed.Check that supported hardware is found in the cluster.
$ oc -n openshift-ptp get nodeptpdevices.ptp.openshift.ioExample output
NAME                                  AGE
control-plane-0.example.com           10d
control-plane-1.example.com           10d
compute-0.example.com                 10d
compute-1.example.com                 10d
compute-2.example.com                 10d
Check the available PTP network interfaces for a node:
$ oc -n openshift-ptp get nodeptpdevices.ptp.openshift.io <node_name> -o yamlwhere:
- <node_name>
Specifies the node you want to query, for example,
compute-0.example.com.Example output
apiVersion: ptp.openshift.io/v1
kind: NodePtpDevice
metadata:
  creationTimestamp: "2021-09-14T16:52:33Z"
  generation: 1
  name: compute-0.example.com
  namespace: openshift-ptp
  resourceVersion: "177400"
  uid: 30413db0-4d8d-46da-9bef-737bacd548fd
spec: {}
status:
  devices:
  - name: eno1
  - name: eno2
  - name: eno3
  - name: eno4
  - name: enp5s0f0
  - name: enp5s0f1
Check that the PTP interface is successfully synchronized to the primary clock by accessing the
linuxptp-daemonpod for the corresponding node.Get the name of the
linuxptp-daemonpod and corresponding node you want to troubleshoot by running the following command:$ oc get pods -n openshift-ptp -o wideExample output
NAME                            READY   STATUS    RESTARTS   AGE     IP            NODE
linuxptp-daemon-lmvgn           3/3     Running   0          4d17h   10.1.196.24   compute-0.example.com
linuxptp-daemon-qhfg7           3/3     Running   0          4d17h   10.1.196.25   compute-1.example.com
ptp-operator-6b8dcbf7f4-zndk7   1/1     Running   0          5d7h    10.129.0.61   control-plane-1.example.com
Remote shell into the required
linuxptp-daemoncontainer:$ oc rsh -n openshift-ptp -c linuxptp-daemon-container <linux_daemon_container>where:
- <linux_daemon_container>
-
is the container you want to diagnose, for example
linuxptp-daemon-lmvgn.
In the remote shell connection to the
linuxptp-daemoncontainer, use the PTP Management Client (pmc) tool to diagnose the network interface. Run the followingpmccommand to check the sync status of the PTP device, for exampleptp4l.# pmc -u -f /var/run/ptp4l.0.config -b 0 'GET PORT_DATA_SET'Example output when the node is successfully synced to the primary clock
sending: GET PORT_DATA_SET
    40a6b7.fffe.166ef0-1 seq 0 RESPONSE MANAGEMENT PORT_DATA_SET
        portIdentity            40a6b7.fffe.166ef0-1
        portState               SLAVE
        logMinDelayReqInterval  -4
        peerMeanPathDelay       0
        logAnnounceInterval     -3
        announceReceiptTimeout  3
        logSyncInterval         -4
        delayMechanism          1
        logMinPdelayReqInterval -4
        versionNumber           2
For GNSS-sourced grandmaster clocks, verify that the in-tree NIC ice driver is correct by running the following command, for example:
$ oc rsh -n openshift-ptp -c linuxptp-daemon-container linuxptp-daemon-74m2g ethtool -i ens7f0Example output
driver: ice
version: 5.14.0-356.bz2232515.el9.x86_64
firmware-version: 4.20 0x8001778b 1.3346.0
For GNSS-sourced grandmaster clocks, verify that the
linuxptp-daemoncontainer is receiving signal from the GNSS antenna. If the container is not receiving the GNSS signal, the/dev/gnss0file is not populated. To verify, run the following command:$ oc rsh -n openshift-ptp -c linuxptp-daemon-container linuxptp-daemon-jnz6r cat /dev/gnss0Example output
$GNRMC,125223.00,A,4233.24463,N,07126.64561,W,0.000,,300823,,,A,V*0A
$GNVTG,,T,,M,0.000,N,0.000,K,A*3D
$GNGGA,125223.00,4233.24463,N,07126.64561,W,1,12,99.99,98.6,M,-33.1,M,,*7E
$GNGSA,A,3,25,17,19,11,12,06,05,04,09,20,,,99.99,99.99,99.99,1*37
$GPGSV,3,1,10,04,12,039,41,05,31,222,46,06,50,064,48,09,28,064,42,1*62
17.2.12. Collecting PTP Operator data
You can use the oc adm must-gather command to collect information about your cluster, including features and objects associated with PTP Operator.
Prerequisites
-
You have access to the cluster as a user with the
cluster-adminrole. -
You have installed the OpenShift CLI (
oc). - You have installed the PTP Operator.
Procedure
To collect PTP Operator data with
must-gather, you must specify the PTP Operatormust-gatherimage.$ oc adm must-gather --image=registry.redhat.io/openshift4/ptp-must-gather-rhel8:v4.14
17.3. Using the PTP hardware fast event notifications framework
Cloud native applications such as virtual RAN (vRAN) require access to notifications about hardware timing events that are critical to the functioning of the overall network. Precision Time Protocol (PTP) clock synchronization errors can negatively affect the performance and reliability of your low-latency application, for example, a vRAN application running in a distributed unit (DU).
17.3.1. About PTP and clock synchronization error events
Loss of PTP synchronization is a critical error for a RAN network. If synchronization is lost on a node, the radio might be shut down and the network Over the Air (OTA) traffic might be shifted to another node in the wireless network. Fast event notifications mitigate against workload errors by allowing cluster nodes to communicate PTP clock sync status to the vRAN application running in the DU.
Event notifications are available to vRAN applications running on the same DU node. A publish/subscribe REST API passes events notifications to the messaging bus. Publish/subscribe messaging, or pub-sub messaging, is an asynchronous service-to-service communication architecture where any message published to a topic is immediately received by all of the subscribers to the topic.
The PTP Operator generates fast event notifications for every PTP-capable network interface. You can access the events by using a cloud-event-proxy sidecar container over an HTTP or Advanced Message Queuing Protocol (AMQP) message bus.
PTP fast event notifications are available for network interfaces configured to use PTP ordinary clocks, PTP grandmaster clocks, or PTP boundary clocks.
HTTP transport is the default transport for PTP and bare-metal events. Use HTTP transport instead of AMQP for PTP and bare-metal events where possible. AMQ Interconnect is EOL from 30 June 2024. Extended life cycle support (ELS) for AMQ Interconnect ends 29 November 2029. For more information see, Red Hat AMQ Interconnect support status.
17.3.2. About the PTP fast event notifications framework
Use the Precision Time Protocol (PTP) fast event notifications framework to subscribe cluster applications to PTP events that the bare-metal cluster node generates.
The fast events notifications framework uses a REST API for communication. The REST API is based on the O-RAN O-Cloud Notification API Specification for Event Consumers 3.0 that is available from O-RAN ALLIANCE Specifications.
The framework consists of a publisher, subscriber, and an AMQ or HTTP messaging protocol to handle communications between the publisher and subscriber applications. Applications run the cloud-event-proxy container in a sidecar pattern to subscribe to PTP events. The cloud-event-proxy sidecar container can access the same resources as the primary application container without using any of the resources of the primary application and with no significant latency.
HTTP transport is the default transport for PTP and bare-metal events. Use HTTP transport instead of AMQP for PTP and bare-metal events where possible. AMQ Interconnect is EOL from 30 June 2024. Extended life cycle support (ELS) for AMQ Interconnect ends 29 November 2029. For more information see, Red Hat AMQ Interconnect support status.
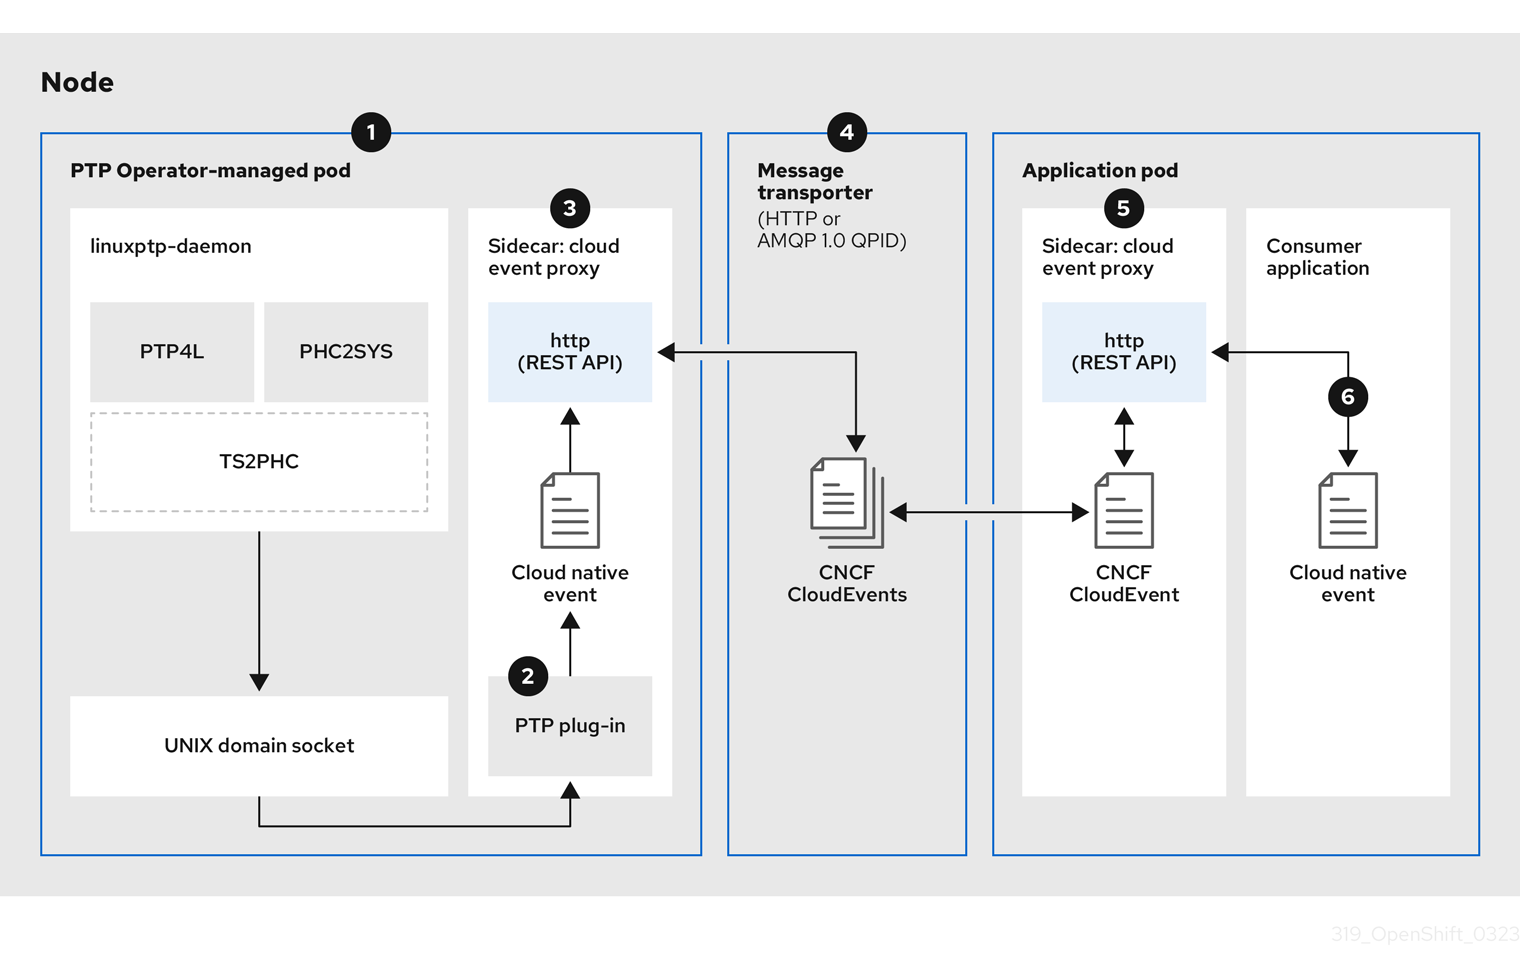
Figure 17.4. Overview of PTP fast events
-
 Event is generated on the cluster host
 -
linuxptp-daemonin the PTP Operator-managed pod runs as a KubernetesDaemonSetand manages the variouslinuxptpprocesses (ptp4l,phc2sys, and optionally for grandmaster clocks,ts2phc). Thelinuxptp-daemonpasses the event to the UNIX domain socket. -
 Event is passed to the cloud-event-proxy sidecar
 -
The PTP plugin reads the event from the UNIX domain socket and passes it to the
cloud-event-proxysidecar in the PTP Operator-managed pod.cloud-event-proxydelivers the event from the Kubernetes infrastructure to Cloud-Native Network Functions (CNFs) with low latency. -
 Event is persisted
 -
The
cloud-event-proxysidecar in the PTP Operator-managed pod processes the event and publishes the cloud-native event by using a REST API. -
 Message is transported
 -
The message transporter transports the event to the
cloud-event-proxysidecar in the application pod over HTTP or AMQP 1.0 QPID. -
 Event is available from the REST API
 -
The
cloud-event-proxysidecar in the Application pod processes the event and makes it available by using the REST API. -
 Consumer application requests a subscription and receives the subscribed event
 -
The consumer application sends an API request to the
cloud-event-proxysidecar in the application pod to create a PTP events subscription. Thecloud-event-proxysidecar creates an AMQ or HTTP messaging listener protocol for the resource specified in the subscription.
The cloud-event-proxy sidecar in the application pod receives the event from the PTP Operator-managed pod, unwraps the cloud events object to retrieve the data, and posts the event to the consumer application. The consumer application listens to the address specified in the resource qualifier and receives and processes the PTP event.
17.3.3. Configuring the PTP fast event notifications publisher
To start using PTP fast event notifications for a network interface in your cluster, you must enable the fast event publisher in the PTP Operator PtpOperatorConfig custom resource (CR) and configure ptpClockThreshold values in a PtpConfig CR that you create.
Prerequisites
-
You have installed the OpenShift Container Platform CLI (
oc). -
You have logged in as a user with
cluster-adminprivileges. - You have installed the PTP Operator.
Procedure
Modify the default PTP Operator config to enable PTP fast events.
Save the following YAML in the
ptp-operatorconfig.yamlfile:apiVersion: ptp.openshift.io/v1 kind: PtpOperatorConfig metadata: name: default namespace: openshift-ptp spec: daemonNodeSelector: node-role.kubernetes.io/worker: "" ptpEventConfig: enableEventPublisher: true1 - 1
- Set
enableEventPublishertotrueto enable PTP fast event notifications.
NoteIn OpenShift Container Platform 4.13 or later, you do not need to set the
spec.ptpEventConfig.transportHostfield in thePtpOperatorConfigresource when you use HTTP transport for PTP events. SettransportHostonly when you use AMQP transport for PTP events.Update the
PtpOperatorConfigCR:$ oc apply -f ptp-operatorconfig.yaml
Create a
PtpConfigcustom resource (CR) for the PTP enabled interface, and set the required values forptpClockThresholdandptp4lOpts. The following YAML illustrates the required values that you must set in thePtpConfigCR:spec: profile: - name: "profile1" interface: "enp5s0f0" ptp4lOpts: "-2 -s --summary_interval -4"1 phc2sysOpts: "-a -r -m -n 24 -N 8 -R 16"2 ptp4lConf: ""3 ptpClockThreshold:4 holdOverTimeout: 5 maxOffsetThreshold: 100 minOffsetThreshold: -100- 1
- Append
--summary_interval -4to use PTP fast events. - 2
- Required
phc2sysOptsvalues.-mprints messages tostdout. Thelinuxptp-daemonDaemonSetparses the logs and generates Prometheus metrics. - 3
- Specify a string that contains the configuration to replace the default
/etc/ptp4l.conffile. To use the default configuration, leave the field empty. - 4
- Optional. If the
ptpClockThresholdstanza is not present, default values are used for theptpClockThresholdfields. The stanza shows defaultptpClockThresholdvalues. TheptpClockThresholdvalues configure how long after the PTP master clock is disconnected before PTP events are triggered.holdOverTimeoutis the time value in seconds before the PTP clock event state changes toFREERUNwhen the PTP master clock is disconnected. ThemaxOffsetThresholdandminOffsetThresholdsettings configure offset values in nanoseconds that compare against the values forCLOCK_REALTIME(phc2sys) or master offset (ptp4l). When theptp4lorphc2sysoffset value is outside this range, the PTP clock state is set toFREERUN. When the offset value is within this range, the PTP clock state is set toLOCKED.
17.3.4. Migrating consumer applications to use HTTP transport for PTP or bare-metal events
If you have previously deployed PTP or bare-metal events consumer applications, you need to update the applications to use HTTP message transport.
Prerequisites
-
You have installed the OpenShift CLI (
oc). -
You have logged in as a user with
cluster-adminprivileges. - You have updated the PTP Operator or Bare Metal Event Relay to version 4.13+ which uses HTTP transport by default.
Procedure
Update your events consumer application to use HTTP transport. Set the
http-event-publishersvariable for the cloud event sidecar deployment.For example, in a cluster with PTP events configured, the following YAML snippet illustrates a cloud event sidecar deployment:
containers:
  - name: cloud-event-sidecar
    image: cloud-event-sidecar
    args:
      - "--metrics-addr=127.0.0.1:9091"
      - "--store-path=/store"
      - "--transport-host=consumer-events-subscription-service.cloud-events.svc.cluster.local:9043"
      - "--http-event-publishers=ptp-event-publisher-service-NODE_NAME.openshift-ptp.svc.cluster.local:9043"
1 - "--api-port=8089"- 1
- The PTP Operator automatically resolves
NODE_NAMEto the host that is generating the PTP events. For example,compute-1.example.com.
In a cluster with bare-metal events configured, set the
http-event-publishersfield tohw-event-publisher-service.openshift-bare-metal-events.svc.cluster.local:9043in the cloud event sidecar deployment CR.Deploy the
consumer-events-subscription-serviceservice alongside the events consumer application. For example:apiVersion: v1 kind: Service metadata: annotations: prometheus.io/scrape: "true" service.alpha.openshift.io/serving-cert-secret-name: sidecar-consumer-secret name: consumer-events-subscription-service namespace: cloud-events labels: app: consumer-service spec: ports: - name: sub-port port: 9043 selector: app: consumer clusterIP: None sessionAffinity: None type: ClusterIP
17.3.5. Installing the AMQ messaging bus
To pass PTP fast event notifications between publisher and subscriber on a node, you can install and configure an AMQ messaging bus to run locally on the node. To use AMQ messaging, you must install the AMQ Interconnect Operator.
HTTP transport is the default transport for PTP and bare-metal events. Use HTTP transport instead of AMQP for PTP and bare-metal events where possible. AMQ Interconnect is EOL from 30 June 2024. Extended life cycle support (ELS) for AMQ Interconnect ends 29 November 2029. For more information see, Red Hat AMQ Interconnect support status.
Prerequisites
-
Install the OpenShift Container Platform CLI (
oc). -
Log in as a user with
cluster-adminprivileges.
Procedure
-
Install the AMQ Interconnect Operator to its own
amq-interconnectnamespace. See Adding the Red Hat Integration - AMQ Interconnect Operator.
Verification
Check that the AMQ Interconnect Operator is available and the required pods are running:
$ oc get pods -n amq-interconnectExample output
NAME READY STATUS RESTARTS AGE amq-interconnect-645db76c76-k8ghs 1/1 Running 0 23h interconnect-operator-5cb5fc7cc-4v7qm 1/1 Running 0 23hCheck that the required
linuxptp-daemonPTP event producer pods are running in theopenshift-ptpnamespace.$ oc get pods -n openshift-ptpExample output
NAME READY STATUS RESTARTS AGE linuxptp-daemon-2t78p 3/3 Running 0 12h linuxptp-daemon-k8n88 3/3 Running 0 12h
17.3.6. Subscribing DU applications to PTP events with the REST API
Subscribe applications to PTP events by using the resource address /cluster/node/<node_name>/ptp, where <node_name> is the cluster node running the DU application.
Deploy your cloud-event-consumer DU application container and cloud-event-proxy sidecar container in a separate DU application pod. The cloud-event-consumer DU application subscribes to the cloud-event-proxy container in the application pod.
Use the following API endpoints to subscribe the cloud-event-consumer DU application to PTP events posted by the cloud-event-proxy container at http://localhost:8089/api/ocloudNotifications/v1/ in the DU application pod:
/api/ocloudNotifications/v1/subscriptions-
POST: Creates a new subscription -
GET: Retrieves a list of subscriptions -
DELETE: Deletes all subscriptions
-
/api/ocloudNotifications/v1/subscriptions/{subscription_id}-
GET: Returns details for the specified subscription ID -
DELETE: Deletes the subscription associated with the specified subscription ID
-
/api/ocloudNotifications/v1/health-
GET: Returns the health status ofocloudNotificationsAPI
-
api/ocloudNotifications/v1/publishers-
GET: Returns an array ofos-clock-sync-state,ptp-clock-class-change,lock-state, andgnss-sync-statusmessages for the cluster node
-
/api/ocloudnotifications/v1/{resource_address}/CurrentState-
GET: Returns the current state of one the following event types:os-clock-sync-state,ptp-clock-class-change,lock-state, orgnss-state-changeevents
-
9089 is the default port for the cloud-event-consumer container deployed in the application pod. You can configure a different port for your DU application as required.
17.3.6.1. PTP events REST API reference
Use the PTP event notifications REST API to subscribe a cluster application to the PTP events that are generated on the parent node.
17.3.6.1.1. api/ocloudNotifications/v1/subscriptions
HTTP method
GET api/ocloudNotifications/v1/subscriptions
Description
Returns a list of subscriptions. If subscriptions exist, a 200 OK status code is returned along with the list of subscriptions.
Example API response
[
{
"id": "75b1ad8f-c807-4c23-acf5-56f4b7ee3826",
"endpointUri": "http://localhost:9089/event",
"uriLocation": "http://localhost:8089/api/ocloudNotifications/v1/subscriptions/75b1ad8f-c807-4c23-acf5-56f4b7ee3826",
"resource": "/cluster/node/compute-1.example.com/ptp"
}
]HTTP method
POST api/ocloudNotifications/v1/subscriptions
Description
Creates a new subscription. If a subscription is successfully created, or if it already exists, a 201 Created status code is returned.
| Parameter | Type |
|---|---|
| subscription | data |
Example payload
{
"endpointUri": "http://localhost:8989/event",
"resource": "/cluster/node/compute-1.example.com/ptp"
}HTTP method
DELETE api/ocloudNotifications/v1/subscriptions
Description
Deletes all subscriptions.
Example API response
{
"status": "deleted all subscriptions"
}17.3.6.1.2. api/ocloudNotifications/v1/subscriptions/{subscription_id}
HTTP method
GET api/ocloudNotifications/v1/subscriptions/{subscription_id}
Description
Returns details for the subscription with ID subscription_id.
| Parameter | Type |
|---|---|
|
| string |
Example API response
{
"id":"48210fb3-45be-4ce0-aa9b-41a0e58730ab",
"endpointUri": "http://localhost:9089/event",
"uriLocation":"http://localhost:8089/api/ocloudNotifications/v1/subscriptions/48210fb3-45be-4ce0-aa9b-41a0e58730ab",
"resource":"/cluster/node/compute-1.example.com/ptp"
}HTTP method
DELETE api/ocloudNotifications/v1/subscriptions/{subscription_id}
Description
Deletes the subscription with ID subscription_id.
| Parameter | Type |
|---|---|
|
| string |
Example API response
{
"status": "OK"
}17.3.6.1.3. api/ocloudNotifications/v1/health
HTTP method
GET api/ocloudNotifications/v1/health/
Description
Returns the health status for the ocloudNotifications REST API.
Example API response
OK17.3.6.1.4. api/ocloudNotifications/v1/publishers
HTTP method
GET api/ocloudNotifications/v1/publishers
Description
Returns an array of os-clock-sync-state, ptp-clock-class-change, lock-state, and gnss-sync-status details for the cluster node. The system generates notifications when the relevant equipment state changes.
-
os-clock-sync-statenotifications describe the host operating system clock synchronization state. Valid states areLOCKEDorFREERUN. -
ptp-clock-class-changenotifications describe the current state of the PTP clock class. -
lock-statenotifications describe the current status of the PTP equipment lock state. Valid states areLOCKED,HOLDOVERorFREERUN. -
gnss-sync-statusnotifications describe the GPS synchronization state with regard to the external GNSS clock signal. Valid states areSYNCHRONIZED,ANTENNA_DISCONNECTED, orACQUIRING_SYNC.
You can use equipment synchronization status subscriptions together to deliver a detailed view of the overall synchronization health of the system.
Example API response
[
{
"id": "0fa415ae-a3cf-4299-876a-589438bacf75",
"endpointUri": "http://localhost:9085/api/ocloudNotifications/v1/dummy",
"uriLocation": "http://localhost:9085/api/ocloudNotifications/v1/publishers/0fa415ae-a3cf-4299-876a-589438bacf75",
"resource": "/cluster/node/compute-1.example.com/sync/sync-status/os-clock-sync-state"
},
{
"id": "28cd82df-8436-4f50-bbd9-7a9742828a71",
"endpointUri": "http://localhost:9085/api/ocloudNotifications/v1/dummy",
"uriLocation": "http://localhost:9085/api/ocloudNotifications/v1/publishers/28cd82df-8436-4f50-bbd9-7a9742828a71",
"resource": "/cluster/node/compute-1.example.com/sync/ptp-status/ptp-clock-class-change"
},
{
"id": "44aa480d-7347-48b0-a5b0-e0af01fa9677",
"endpointUri": "http://localhost:9085/api/ocloudNotifications/v1/dummy",
"uriLocation": "http://localhost:9085/api/ocloudNotifications/v1/publishers/44aa480d-7347-48b0-a5b0-e0af01fa9677",
"resource": "/cluster/node/compute-1.example.com/sync/ptp-status/lock-state"
},
{
"id": "778da345d-4567-67b0-a43f0-rty885a456",
"endpointUri": "http://localhost:9085/api/ocloudNotifications/v1/dummy",
"uriLocation": "http://localhost:9085/api/ocloudNotifications/v1/publishers/778da345d-4567-67b0-a43f0-rty885a456",
"resource": "/cluster/node/compute-1.example.com/sync/gnss-status/gnss-sync-status"
}
]
You can find os-clock-sync-state, ptp-clock-class-change, lock-state, and gnss-sync-status events in the logs for the cloud-event-proxy container. For example:
$ oc logs -f linuxptp-daemon-cvgr6 -n openshift-ptp -c cloud-event-proxyExample os-clock-sync-state event
{
"id":"c8a784d1-5f4a-4c16-9a81-a3b4313affe5",
"type":"event.sync.sync-status.os-clock-sync-state-change",
"source":"/cluster/compute-1.example.com/ptp/CLOCK_REALTIME",
"dataContentType":"application/json",
"time":"2022-05-06T15:31:23.906277159Z",
"data":{
"version":"v1",
"values":[
{
"resource":"/sync/sync-status/os-clock-sync-state",
"dataType":"notification",
"valueType":"enumeration",
"value":"LOCKED"
},
{
"resource":"/sync/sync-status/os-clock-sync-state",
"dataType":"metric",
"valueType":"decimal64.3",
"value":"-53"
}
]
}
}Example ptp-clock-class-change event
{
"id":"69eddb52-1650-4e56-b325-86d44688d02b",
"type":"event.sync.ptp-status.ptp-clock-class-change",
"source":"/cluster/compute-1.example.com/ptp/ens2fx/master",
"dataContentType":"application/json",
"time":"2022-05-06T15:31:23.147100033Z",
"data":{
"version":"v1",
"values":[
{
"resource":"/sync/ptp-status/ptp-clock-class-change",
"dataType":"metric",
"valueType":"decimal64.3",
"value":"135"
}
]
}
}Example lock-state event
{
"id":"305ec18b-1472-47b3-aadd-8f37933249a9",
"type":"event.sync.ptp-status.ptp-state-change",
"source":"/cluster/compute-1.example.com/ptp/ens2fx/master",
"dataContentType":"application/json",
"time":"2022-05-06T15:31:23.467684081Z",
"data":{
"version":"v1",
"values":[
{
"resource":"/sync/ptp-status/lock-state",
"dataType":"notification",
"valueType":"enumeration",
"value":"LOCKED"
},
{
"resource":"/sync/ptp-status/lock-state",
"dataType":"metric",
"valueType":"decimal64.3",
"value":"62"
}
]
}
}Example gnss-sync-status event
{
"id": "435e1f2a-6854-4555-8520-767325c087d7",
"type": "event.sync.gnss-status.gnss-state-change",
"source": "/cluster/node/compute-1.example.com/sync/gnss-status/gnss-sync-status",
"dataContentType": "application/json",
"time": "2023-09-27T19:35:33.42347206Z",
"data": {
"version": "v1",
"values": [
{
"resource": "/cluster/node/compute-1.example.com/ens2fx/master",
"dataType": "notification",
"valueType": "enumeration",
"value": "SYNCHRONIZED"
},
{
"resource": "/cluster/node/compute-1.example.com/ens2fx/master",
"dataType": "metric",
"valueType": "decimal64.3",
"value": "5"
}
]
}
}17.3.6.1.5. api/ocloudNotifications/v1/{resource_address}/CurrentState
HTTP method
GET api/ocloudNotifications/v1/cluster/node/<node_name>/sync/ptp-status/lock-state/CurrentState
GET api/ocloudNotifications/v1/cluster/node/<node_name>/sync/sync-status/os-clock-sync-state/CurrentState
GET api/ocloudNotifications/v1/cluster/node/<node_name>/sync/ptp-status/ptp-clock-class-change/CurrentState
Description
Configure the CurrentState API endpoint to return the current state of the os-clock-sync-state, ptp-clock-class-change, lock-state events for the cluster node.
-
os-clock-sync-statenotifications describe the host operating system clock synchronization state. Can be inLOCKEDorFREERUNstate. -
ptp-clock-class-changenotifications describe the current state of the PTP clock class. -
lock-statenotifications describe the current status of the PTP equipment lock state. Can be inLOCKED,HOLDOVERorFREERUNstate.
| Parameter | Type |
|---|---|
|
| string |
Example lock-state API response
{
"id": "c1ac3aa5-1195-4786-84f8-da0ea4462921",
"type": "event.sync.ptp-status.ptp-state-change",
"source": "/cluster/node/compute-1.example.com/sync/ptp-status/lock-state",
"dataContentType": "application/json",
"time": "2023-01-10T02:41:57.094981478Z",
"data": {
"version": "v1",
"values": [
{
"resource": "/cluster/node/compute-1.example.com/ens5fx/master",
"dataType": "notification",
"valueType": "enumeration",
"value": "LOCKED"
},
{
"resource": "/cluster/node/compute-1.example.com/ens5fx/master",
"dataType": "metric",
"valueType": "decimal64.3",
"value": "29"
}
]
}
}Example os-clock-sync-state API response
{
"specversion": "0.3",
"id": "4f51fe99-feaa-4e66-9112-66c5c9b9afcb",
"source": "/cluster/node/compute-1.example.com/sync/sync-status/os-clock-sync-state",
"type": "event.sync.sync-status.os-clock-sync-state-change",
"subject": "/cluster/node/compute-1.example.com/sync/sync-status/os-clock-sync-state",
"datacontenttype": "application/json",
"time": "2022-11-29T17:44:22.202Z",
"data": {
"version": "v1",
"values": [
{
"resource": "/cluster/node/compute-1.example.com/CLOCK_REALTIME",
"dataType": "notification",
"valueType": "enumeration",
"value": "LOCKED"
},
{
"resource": "/cluster/node/compute-1.example.com/CLOCK_REALTIME",
"dataType": "metric",
"valueType": "decimal64.3",
"value": "27"
}
]
}
}Example ptp-clock-class-change API response
{
"id": "064c9e67-5ad4-4afb-98ff-189c6aa9c205",
"type": "event.sync.ptp-status.ptp-clock-class-change",
"source": "/cluster/node/compute-1.example.com/sync/ptp-status/ptp-clock-class-change",
"dataContentType": "application/json",
"time": "2023-01-10T02:41:56.785673989Z",
"data": {
"version": "v1",
"values": [
{
"resource": "/cluster/node/compute-1.example.com/ens5fx/master",
"dataType": "metric",
"valueType": "decimal64.3",
"value": "165"
}
]
}
}17.3.7. Monitoring PTP fast event metrics
You can monitor PTP fast events metrics from cluster nodes where the linuxptp-daemon is running. You can also monitor PTP fast event metrics in the OpenShift Container Platform web console by using the preconfigured and self-updating Prometheus monitoring stack.
Prerequisites
-
Install the OpenShift Container Platform CLI
oc. -
Log in as a user with
cluster-adminprivileges. - Install and configure the PTP Operator on a node with PTP-capable hardware.
Procedure
Start a debug pod for the node by running the following command:
$ oc debug node/<node_name>Check for PTP metrics exposed by the
linuxptp-daemoncontainer. For example, run the following command:sh-4.4# curl http://localhost:9091/metricsExample output
# HELP cne_api_events_published Metric to get number of events published by the rest api # TYPE cne_api_events_published gauge cne_api_events_published{address="/cluster/node/compute-1.example.com/sync/gnss-status/gnss-sync-status",status="success"} 1 cne_api_events_published{address="/cluster/node/compute-1.example.com/sync/ptp-status/lock-state",status="success"} 94 cne_api_events_published{address="/cluster/node/compute-1.example.com/sync/ptp-status/ptp-clock-class-change",status="success"} 18 cne_api_events_published{address="/cluster/node/compute-1.example.com/sync/sync-status/os-clock-sync-state",status="success"} 27-
To view the PTP event in the OpenShift Container Platform web console, copy the name of the PTP metric you want to query, for example,
openshift_ptp_offset_ns. -
In the OpenShift Container Platform web console, click Observe
Metrics. - Paste the PTP metric name into the Expression field, and click Run queries.
17.3.8. PTP fast event metrics reference
The following table describes the PTP fast events metrics that are available from cluster nodes where the linuxptp-daemon service is running.
| Metric | Description | Example |
|---|---|---|
|
|
Returns the PTP clock class for the interface. Possible values for PTP clock class are 6 ( |
|
|
|
Returns the current PTP clock state for the interface. Possible values for PTP clock state are |
|
|
| Returns the delay in nanoseconds between the primary clock sending the timing packet and the secondary clock receiving the timing packet. |
|
|
|
Returns the current status of the highly available system clock when there are multiple time sources on different NICs. Possible values are 0 ( |
|
|
|
Returns the frequency adjustment in nanoseconds between 2 PTP clocks. For example, between the upstream clock and the NIC, between the system clock and the NIC, or between the PTP hardware clock ( |
|
|
|
Returns the configured PTP clock role for the interface. Possible values are 0 ( |
|
|
|
Returns the maximum offset in nanoseconds between 2 clocks or interfaces. For example, between the upstream GNSS clock and the NIC ( |
|
|
| Returns the offset in nanoseconds between the DPLL clock or the GNSS clock source and the NIC hardware clock. |
|
|
|
Returns a count of the number of times the |
|
|
| Returns a status code that shows whether the PTP processes are running or not. |
|
|
|
Returns values for
|
|
17.3.8.1. PTP fast event metrics only when T-GM is enabled
The following table describes the PTP fast event metrics that are available only when PTP grandmaster clock (T-GM) is enabled.
| Metric | Description | Example |
|---|---|---|
|
|
Returns the current status of the digital phase-locked loop (DPLL) frequency for the NIC. Possible values are -1 ( |
|
|
|
Returns the current status of the NMEA connection. NMEA is the protocol that is used for 1PPS NIC connections. Possible values are 0 ( |
|
|
|
Returns the status of the DPLL phase for the NIC. Possible values are -1 ( |
|
|
|
Returns the current status of the NIC 1PPS connection. You use the 1PPS connection to synchronize timing between connected NICs. Possible values are 0 ( |
|
|
|
Returns the current status of the global navigation satellite system (GNSS) connection. GNSS provides satellite-based positioning, navigation, and timing services globally. Possible values are 0 ( |
|
17.4. Developing Precision Time Protocol events consumer applications
When developing consumer applications that make use of Precision Time Protocol (PTP) events on a bare-metal cluster node, you need to deploy your consumer application and a cloud-event-proxy container in a separate application pod. The cloud-event-proxy container receives the events from the PTP Operator pod and passes it to the consumer application. The consumer application subscribes to the events posted in the cloud-event-proxy container by using a REST API.
For more information about deploying PTP events applications, see About the PTP fast event notifications framework.
The following information provides general guidance for developing consumer applications that use PTP events. A complete events consumer application example is outside the scope of this information.
17.4.1. PTP events consumer application reference
PTP event consumer applications require the following features:
-
A web service running with a
POSThandler to receive the cloud native PTP events JSON payload -
A
createSubscriptionfunction to subscribe to the PTP events producer -
A
getCurrentStatefunction to poll the current state of the PTP events producer
The following example Go snippets illustrate these requirements:
Example PTP events consumer server function in Go
func server() {
http.HandleFunc("/event", getEvent)
http.ListenAndServe("localhost:8989", nil)
}
func getEvent(w http.ResponseWriter, req *http.Request) {
defer req.Body.Close()
bodyBytes, err := io.ReadAll(req.Body)
if err != nil {
log.Errorf("error reading event %v", err)
}
e := string(bodyBytes)
if e != "" {
processEvent(bodyBytes)
log.Infof("received event %s", string(bodyBytes))
} else {
w.WriteHeader(http.StatusNoContent)
}
}Example PTP events createSubscription function in Go
import (
"github.com/redhat-cne/sdk-go/pkg/pubsub"
"github.com/redhat-cne/sdk-go/pkg/types"
v1pubsub "github.com/redhat-cne/sdk-go/v1/pubsub"
)
// Subscribe to PTP events using REST API
s1,_:=createsubscription("/cluster/node/<node_name>/sync/sync-status/os-clock-sync-state")
s2,_:=createsubscription("/cluster/node/<node_name>/sync/ptp-status/ptp-clock-class-change")
s3,_:=createsubscription("/cluster/node/<node_name>/sync/ptp-status/lock-state")
// Create PTP event subscriptions POST
func createSubscription(resourceAddress string) (sub pubsub.PubSub, err error) {
var status int
apiPath:= "/api/ocloudNotifications/v1/"
localAPIAddr:=localhost:8989 // vDU service API address
apiAddr:= "localhost:8089" // event framework API address
subURL := &types.URI{URL: url.URL{Scheme: "http",
Host: apiAddr
Path: fmt.Sprintf("%s%s", apiPath, "subscriptions")}}
endpointURL := &types.URI{URL: url.URL{Scheme: "http",
Host: localAPIAddr,
Path: "event"}}
sub = v1pubsub.NewPubSub(endpointURL, resourceAddress)
var subB []byte
if subB, err = json.Marshal(&sub); err == nil {
rc := restclient.New()
if status, subB = rc.PostWithReturn(subURL, subB); status != http.StatusCreated {
err = fmt.Errorf("error in subscription creation api at %s, returned status %d", subURL, status)
} else {
err = json.Unmarshal(subB, &sub)
}
} else {
err = fmt.Errorf("failed to marshal subscription for %s", resourceAddress)
}
return
}- 1
- Replace
<node_name>with the FQDN of the node that is generating the PTP events. For example,compute-1.example.com.
Example PTP events consumer getCurrentState function in Go
//Get PTP event state for the resource
func getCurrentState(resource string) {
//Create publisher
url := &types.URI{URL: url.URL{Scheme: "http",
Host: localhost:8989,
Path: fmt.SPrintf("/api/ocloudNotifications/v1/%s/CurrentState",resource}}
rc := restclient.New()
status, event := rc.Get(url)
if status != http.StatusOK {
log.Errorf("CurrentState:error %d from url %s, %s", status, url.String(), event)
} else {
log.Debugf("Got CurrentState: %s ", event)
}
}17.4.2. Reference cloud-event-proxy deployment and service CRs
Use the following example cloud-event-proxy deployment and subscriber service CRs as a reference when deploying your PTP events consumer application.
HTTP transport is the default transport for PTP and bare-metal events. Use HTTP transport instead of AMQP for PTP and bare-metal events where possible. AMQ Interconnect is EOL from 30 June 2024. Extended life cycle support (ELS) for AMQ Interconnect ends 29 November 2029. For more information see, Red Hat AMQ Interconnect support status.
Reference cloud-event-proxy deployment with HTTP transport
apiVersion: apps/v1
kind: Deployment
metadata:
name: event-consumer-deployment
namespace: <namespace>
labels:
app: consumer
spec:
replicas: 1
selector:
matchLabels:
app: consumer
template:
metadata:
labels:
app: consumer
spec:
serviceAccountName: sidecar-consumer-sa
containers:
- name: event-subscriber
image: event-subscriber-app
- name: cloud-event-proxy-as-sidecar
image: openshift4/ose-cloud-event-proxy
args:
- "--metrics-addr=127.0.0.1:9091"
- "--store-path=/store"
- "--transport-host=consumer-events-subscription-service.cloud-events.svc.cluster.local:9043"
- "--http-event-publishers=ptp-event-publisher-service-NODE_NAME.openshift-ptp.svc.cluster.local:9043"
- "--api-port=8089"
env:
- name: NODE_NAME
valueFrom:
fieldRef:
fieldPath: spec.nodeName
volumeMounts:
- name: pubsubstore
mountPath: /store
ports:
- name: metrics-port
containerPort: 9091
- name: sub-port
containerPort: 9043
volumes:
- name: pubsubstore
emptyDir: {}Reference cloud-event-proxy deployment with AMQ transport
apiVersion: apps/v1
kind: Deployment
metadata:
name: cloud-event-proxy-sidecar
namespace: cloud-events
labels:
app: cloud-event-proxy
spec:
selector:
matchLabels:
app: cloud-event-proxy
template:
metadata:
labels:
app: cloud-event-proxy
spec:
nodeSelector:
node-role.kubernetes.io/worker: ""
containers:
- name: cloud-event-sidecar
image: openshift4/ose-cloud-event-proxy
args:
- "--metrics-addr=127.0.0.1:9091"
- "--store-path=/store"
- "--transport-host=amqp://router.router.svc.cluster.local"
- "--api-port=8089"
env:
- name: <node_name>
valueFrom:
fieldRef:
fieldPath: spec.nodeName
- name: <node_ip>
valueFrom:
fieldRef:
fieldPath: status.hostIP
volumeMounts:
- name: pubsubstore
mountPath: /store
ports:
- name: metrics-port
containerPort: 9091
- name: sub-port
containerPort: 9043
volumes:
- name: pubsubstore
emptyDir: {}Reference cloud-event-proxy subscriber service
apiVersion: v1
kind: Service
metadata:
  annotations:
    prometheus.io/scrape: "true"
    service.alpha.openshift.io/serving-cert-secret-name: sidecar-consumer-secret
  name: consumer-events-subscription-service
  namespace: cloud-events
  labels:
    app: consumer-service
spec:
  ports:
    - name: sub-port
      port: 9043
  selector:
    app: consumer
  clusterIP: None
  sessionAffinity: None
type: ClusterIP17.4.3. PTP events available from the cloud-event-proxy sidecar REST API
PTP events consumer applications can poll the PTP events producer for the following PTP timing events.
| Resource URI | Description |
|---|---|
|
|
Describes the current status of the PTP equipment lock state. Can be in |
|
|
Describes the host operating system clock synchronization state. Can be in |
|
| Describes the current state of the PTP clock class. |
17.4.4. Subscribing the consumer application to PTP events
Before the PTP events consumer application can poll for events, you need to subscribe the application to the event producer.
17.4.4.1. Subscribing to PTP lock-state events
To create a subscription for PTP lock-state events, send a POST action to the cloud event API at http://localhost:8081/api/ocloudNotifications/v1/subscriptions with the following payload:
{
"endpointUri": "http://localhost:8989/event",
"resource": "/cluster/node/<node_name>/sync/ptp-status/lock-state",
}Example response
{
"id": "e23473d9-ba18-4f78-946e-401a0caeff90",
"endpointUri": "http://localhost:8989/event",
"uriLocation": "http://localhost:8089/api/ocloudNotifications/v1/subscriptions/e23473d9-ba18-4f78-946e-401a0caeff90",
"resource": "/cluster/node/<node_name>/sync/ptp-status/lock-state",
}17.4.4.2. Subscribing to PTP os-clock-sync-state events
To create a subscription for PTP os-clock-sync-state events, send a POST action to the cloud event API at http://localhost:8081/api/ocloudNotifications/v1/subscriptions with the following payload:
{
"endpointUri": "http://localhost:8989/event",
"resource": "/cluster/node/<node_name>/sync/sync-status/os-clock-sync-state",
}Example response
{
"id": "e23473d9-ba18-4f78-946e-401a0caeff90",
"endpointUri": "http://localhost:8989/event",
"uriLocation": "http://localhost:8089/api/ocloudNotifications/v1/subscriptions/e23473d9-ba18-4f78-946e-401a0caeff90",
"resource": "/cluster/node/<node_name>/sync/sync-status/os-clock-sync-state",
}17.4.4.3. Subscribing to PTP ptp-clock-class-change events
To create a subscription for PTP ptp-clock-class-change events, send a POST action to the cloud event API at http://localhost:8081/api/ocloudNotifications/v1/subscriptions with the following payload:
{
"endpointUri": "http://localhost:8989/event",
"resource": "/cluster/node/<node_name>/sync/ptp-status/ptp-clock-class-change",
}Example response
{
"id": "e23473d9-ba18-4f78-946e-401a0caeff90",
"endpointUri": "http://localhost:8989/event",
"uriLocation": "http://localhost:8089/api/ocloudNotifications/v1/subscriptions/e23473d9-ba18-4f78-946e-401a0caeff90",
"resource": "/cluster/node/<node_name>/sync/ptp-status/ptp-clock-class-change",
}17.4.5. Getting the current PTP clock status
To get the current PTP status for the node, send a GET action to one of the following event REST APIs:
-
http://localhost:8081/api/ocloudNotifications/v1/cluster/node/<node_name>/sync/ptp-status/lock-state/CurrentState -
http://localhost:8081/api/ocloudNotifications/v1/cluster/node/<node_name>/sync/sync-status/os-clock-sync-state/CurrentState -
http://localhost:8081/api/ocloudNotifications/v1/cluster/node/<node_name>/sync/ptp-status/ptp-clock-class-change/CurrentState
The response is a cloud native event JSON object. For example:
Example lock-state API response
{
  "id": "c1ac3aa5-1195-4786-84f8-da0ea4462921",
  "type": "event.sync.ptp-status.ptp-state-change",
  "source": "/cluster/node/compute-1.example.com/sync/ptp-status/lock-state",
  "dataContentType": "application/json",
  "time": "2023-01-10T02:41:57.094981478Z",
  "data": {
    "version": "v1",
    "values": [
      {
        "resource": "/cluster/node/compute-1.example.com/ens5fx/master",
        "dataType": "notification",
        "valueType": "enumeration",
        "value": "LOCKED"
      },
      {
        "resource": "/cluster/node/compute-1.example.com/ens5fx/master",
        "dataType": "metric",
        "valueType": "decimal64.3",
        "value": "29"
      }
    ]
  }
}17.4.6. Verifying that the PTP events consumer application is receiving events
Verify that the cloud-event-proxy container in the application pod is receiving PTP events.
Prerequisites
-
You have installed the OpenShift CLI (
oc). -
You have logged in as a user with
cluster-adminprivileges. - You have installed and configured the PTP Operator.
Procedure
Get the list of active
linuxptp-daemonpods. Run the following command:$ oc get pods -n openshift-ptpExample output
NAME                    READY   STATUS    RESTARTS   AGE
linuxptp-daemon-2t78p   3/3     Running   0          8h
linuxptp-daemon-k8n88   3/3     Running   0          8h
Access the metrics for the required consumer-side
cloud-event-proxycontainer by running the following command:$ oc exec -it <linuxptp-daemon> -n openshift-ptp -c cloud-event-proxy -- curl 127.0.0.1:9091/metricswhere:
- <linuxptp-daemon>
Specifies the pod you want to query, for example,
linuxptp-daemon-2t78p.Example output
# HELP cne_transport_connections_resets Metric to get number of connection resets
# TYPE cne_transport_connections_resets gauge
cne_transport_connection_reset 1
# HELP cne_transport_receiver Metric to get number of receiver created
# TYPE cne_transport_receiver gauge
cne_transport_receiver{address="/cluster/node/compute-1.example.com/ptp",status="active"} 2
cne_transport_receiver{address="/cluster/node/compute-1.example.com/redfish/event",status="active"} 2
# HELP cne_transport_sender Metric to get number of sender created
# TYPE cne_transport_sender gauge
cne_transport_sender{address="/cluster/node/compute-1.example.com/ptp",status="active"} 1
cne_transport_sender{address="/cluster/node/compute-1.example.com/redfish/event",status="active"} 1
# HELP cne_events_ack Metric to get number of events produced
# TYPE cne_events_ack gauge
cne_events_ack{status="success",type="/cluster/node/compute-1.example.com/ptp"} 18
cne_events_ack{status="success",type="/cluster/node/compute-1.example.com/redfish/event"} 18
# HELP cne_events_transport_published Metric to get number of events published by the transport
# TYPE cne_events_transport_published gauge
cne_events_transport_published{address="/cluster/node/compute-1.example.com/ptp",status="failed"} 1
cne_events_transport_published{address="/cluster/node/compute-1.example.com/ptp",status="success"} 18
cne_events_transport_published{address="/cluster/node/compute-1.example.com/redfish/event",status="failed"} 1
cne_events_transport_published{address="/cluster/node/compute-1.example.com/redfish/event",status="success"} 18
# HELP cne_events_transport_received Metric to get number of events received  by the transport
# TYPE cne_events_transport_received gauge
cne_events_transport_received{address="/cluster/node/compute-1.example.com/ptp",status="success"} 18
cne_events_transport_received{address="/cluster/node/compute-1.example.com/redfish/event",status="success"} 18
# HELP cne_events_api_published Metric to get number of events published by the rest api
# TYPE cne_events_api_published gauge
cne_events_api_published{address="/cluster/node/compute-1.example.com/ptp",status="success"} 19
cne_events_api_published{address="/cluster/node/compute-1.example.com/redfish/event",status="success"} 19
# HELP cne_events_received Metric to get number of events received
# TYPE cne_events_received gauge
cne_events_received{status="success",type="/cluster/node/compute-1.example.com/ptp"} 18
cne_events_received{status="success",type="/cluster/node/compute-1.example.com/redfish/event"} 18
# HELP promhttp_metric_handler_requests_in_flight Current number of scrapes being served.
# TYPE promhttp_metric_handler_requests_in_flight gauge
promhttp_metric_handler_requests_in_flight 1
# HELP promhttp_metric_handler_requests_total Total number of scrapes by HTTP status code.
# TYPE promhttp_metric_handler_requests_total counter
promhttp_metric_handler_requests_total{code="200"} 4
promhttp_metric_handler_requests_total{code="500"} 0
promhttp_metric_handler_requests_total{code="503"} 0