21.5. Configuring Response Time Metrics for JBoss EAP 6/AS 7
JBoss ON can monitor application performance by testing how responsive deployed applications are to client requests. Specifically, JBoss ON can determine how quickly an application responds to requests. This is called a response time measurement.
To collect response time metrics for a JBoss EAP 6/AS 7 server, first install the servlet JAR for the response time filter and configure the web server to use it. Then, enable the metrics collection for the web resource.
21.5.1. Installing the Response Time Filters
Copy linkLink copied to clipboard!
- Make sure that you have created a management user to access the JBoss EAP 6 instance.For more information, see the JBoss AS 7.1 documentation.
- In the connection properties for the EAP 6 instance, configure the agent to connect using the secure HTTPS management interface.
Note
To collect response time metrics, the EAP 6 agent plug-in must be configured to connect to the secure HTTPS management interface. - Download the response time packages for JBoss from the JBoss ON UI. The response time filters are packaged as AS 7 modules. There are two modules to obtain:
rhq-rtfilter-module.zip
rhq-rtfilter-subsystem-module.zip
Note
This can also be done from the command line usingwget:[root@server ~]# wget http://server.example.com:7080/downloads/connectors/rhq-rtfilter-module.zip [root@server ~]# wget http://server.example.com:7080/downloads/connectors/rhq-rtfilter-subsystem-module.zip- Click the Administration tab in the top menu.
- In the Configuration menu box on the left, select the item.

- Click the rhq-rtfilter-module.zip and
rhq-rtfilter-subsystem-module.ziplinks, and save the files to an accessible directory, like the/tmpdirectory.
- Open the
modules/directory for the JBoss EAP 6 instance. For example:[root@server ~]# cd /opt/jboss-eap-6.0/modules/ - Unzip the
rhq-rtfilter-module.ziparchive to install the response time filter JAR and the associatedmodule.xmlfile.[root@server modules]# unzip /tmp/rhq-rtfilter-module.zip - Open the configuration file for the server,
domain.xmlorstandalone.xml. - Deploy the response time module globally by adding the module to the list of global modules in the <subsystem> element.
<profile... <subsystem xmlns="urn:jboss:domain:ee:1.1"> <global-modules> <module name="org.rhq.helpers.rhq-rtfilter" slot="main"/> </global-modules> </subsystem> </profile> - Save the file.
- Unzip the
rhq-rtfilter-subsystem-module.ziparchive to install the subsystem response time filter JAR and the associatedmodule.xmlfile.[root@server modules]# unzip /tmp/rhq-rtfilter-subsystem-module.zipThis installs the filters as a subsystem for the application server or individual web apps. - After the filters have been installed, the JBoss EAP 6 server needs to be configured to use them.The response time filter can be deployed globally, for all web applications hosted by the EAP/AS instance, or it can be configured for a specific web application.To deploy the filter as a global subsystem:
- Open the configuration file for the server,
domain.xmlorstandalone.xml. - Add the an
<extensions>element for the response time filter.<extension module="org.rhq.helpers.rhq-rtfilter-subsystem"/> - Add a
<subsystem>element beneath the<profileelement.All that is required for response time filtering to work is the default<subsystem>element, without any optional parameters. However, the parameters can be uncommented and set as necessary; the different ones are described in Table 21.1, “Parameters Available for User-Defined <filter> Settings”.The<subsystem>element should be added even if none of the optional parameters are set.<subsystem xmlns="urn:rhq:rtfilter:1.0"> <!-- Optional parameters. <init-param> <param-name>chopQueryString</param-name> <param-value>true</param-value> </init-param> <init-param> <param-name>logDirectory</param-name> <param-value>/tmp</param-value> </init-param> <init-param> <param-name>logFilePrefix</param-name> <param-value>localhost_7080_</param-value> </init-param> <init-param> <param-name>dontLogRegEx</param-name> <param-value></param-value> </init-param> <init-param> <param-name>matchOnUriOnly</param-name> <param-value>true</param-value> </init-param> <init-param> <param-name>timeBetweenFlushesInSec</param-name> <param-value>73</param-value> </init-param> <init-param> <param-name>flushAfterLines</param-name> <param-value>13</param-value> </init-param> <init-param> <param-name>maxLogFileSize</param-name> <param-value>5242880</param-value> </init-param> --> </subsystem>
To configure the response time filters for an individual web application:- Open the web application's
web.xmlfile.[root@server ~]# vim WARHomeDir/WEB-INF/web.xml - Add the filter and, depending on the configuration, filter mapping elements to the file. This activates the response time filtering.All that is required for response time filtering to work is the default
<filter>element, without any optional parameters. However, the parameters can be uncommented and set as necessary; the different ones are described in Table 21.1, “Parameters Available for User-Defined <filter> Settings”.<filter> <filter-name>RhqRtFilter</filter-name> <filter-class>org.rhq.helpers.rtfilter.filter.RtFilter</filter-class> <!-- Optional parameters. <init-param> <param-name>chopQueryString</param-name> <param-value>true</param-value> </init-param> <init-param> <param-name>logDirectory</param-name> <param-value>/tmp</param-value> </init-param> <init-param> <param-name>logFilePrefix</param-name> <param-value>localhost_7080_</param-value> </init-param> <init-param> <param-name>dontLogRegEx</param-name> <param-value></param-value> </init-param> <init-param> <param-name>matchOnUriOnly</param-name> <param-value>true</param-value> </init-param> <init-param> <param-name>timeBetweenFlushesInSec</param-name> <param-value>73</param-value> </init-param> <init-param> <param-name>flushAfterLines</param-name> <param-value>13</param-value> </init-param> <init-param> <param-name>maxLogFileSize</param-name> <param-value>5242880</param-value> </init-param> --> </filter> <!-- Use this only when also enabling the RhqRtFilter in the filter <filter-mapping> <filter-name>RhqRtFilter</filter-name> <url-pattern>/*</url-pattern> </filter-mapping> -->
- Restart the JBoss EAP/AS server to load the new
web.xmlsettings.
|
Parameter
|
Description
|
|---|---|
|
chopQueryString
|
Only the URI part of a query will be logged if this parameter is set to true. Otherwise the whole query line will be logged. Default is true.
|
|
logDirectory
|
The directory where the log files will be written to. Default setting is {
jboss.server.log.dir}/rt/ (usually server/xxx/log/rt). If this property is not defined, the fallback is {java.io.tmpdir}/rt/ (/tmp/ on UNIX®, and ~/Application Data/Local Settings/Temp – check the TEMP environment variable) is used. If you specify this init parameter, no directory rt/ will be created, but the directory you have provided will be taken literally.
|
|
logFilePrefix
|
A prefix that is put in front of the log file names. Default is the empty string.
|
|
dontLogRegEx
|
A regular expression that is applied to query strings. See java.util.regex.Pattern. If the parameter is not given or an empty string, no pattern is applied.
|
|
matchOnUriOnly
|
Should the dontLogRegEx be applied to the URI part of the query (true) or to the whole query string (false). Default is true.
|
|
timeBetweenFlushesInSec
|
Log lines are buffered by default. When the given number of seconds have passed and a new request is received, the buffered lines will be flushed to disk even if the number of lines to flush after (see next point) is not yet reached.. Default value is 60 seconds (1 Minute).
|
|
flushAfterLines
|
Log lines are buffered by default. When the given number of lines have been buffered, they are flushed to disk. Default value is 10 lines.
|
|
maxLogFileSize
|
The maximum allowed size, in bytes, of the log files; if a log file exceeds this limit, the filter will truncate it; the default value is 5242880 (5 MB).
|
|
vHostMappingFile
|
This properties file must exist on the Tomcat process classpath. For example, in the ../conf/vhost-mappings.properties. The file contains mappings from the 'incoming' vhost (server name) to the vhost that should be used as the prefix in the response time log file name. If no mapping is present (no file or no entry response times are set), then the incoming vhost (server name) is used. For example:
The first mapping states that if the incoming vhost is 'host1.users.acme.com', then the log file name should get a vhost of 'host1' as prefix, separated by a _ from the context root portion. The second mapping states that if the 'incoming' vhost is 'host1', then no prefix, and no _, should be used. The third mapping uses a special left-hand-side token, '%HOST%'. This mapping states that if the 'incoming' vhost is a representation of localhost then no prefix, and no _ , should be used.
%HOST% will match the host name, or canonical host name or IP address, as returned by the implementation of InetAddress.getLocalHost().
The second and third mappings are examples of empty right hand side, but could just as well have provided a vhost.
This is a one time replacement. There is no recursion in the form that the result of the first line would then be applied to the second one.
|
21.5.2. Enabling the Call-Time Metric
Copy linkLink copied to clipboard!
Response time metrics are configured on a live application deployment. A deployment resource is a child of either a standalone EAP 6 server or of a server group.

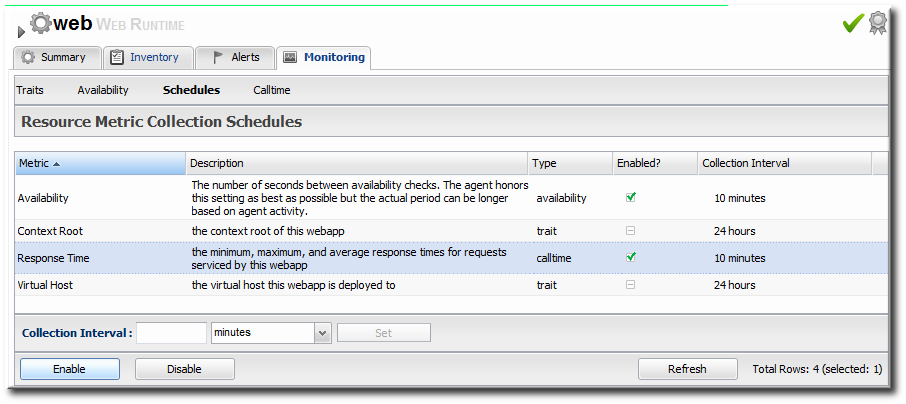
Figure 21.2. Web Runtime Resource
- Click the Inventory tab in the top menu.
- Click the Servers - Top Level Imports item, and select the JBoss EAP 6 resource.
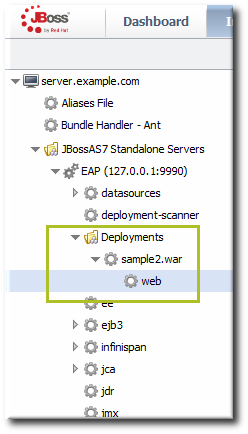
- Navigate to the deployment resource, and expand the application to the web subsystem.
- Click the Monitoring tab on the web resource entry.
- Click the Schedules subtab.
- Select the Response Time metric. This metric is the calltime type.

- Click the at the bottom of the list.
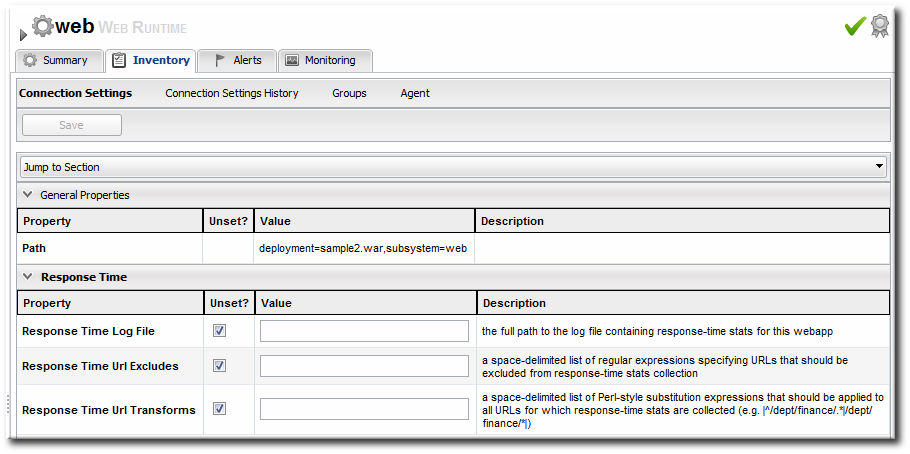
- Click the Inventory tab on the web entry.
- Select the Connection Settings subtab.
- Unset the check boxes for the response time configuration and fill in the appropriate values for the web application.

- The response times log which is used by that specific web application. The log file is a required setting for call-time data collection to work..
- Any files, elements, or pages to exclude from response time measurements. The response times log records times for all resources the web server serves, including support files like CSS files and icons or background images.
- The same page can be accessed with different parameters passed along in the URL. The Response Time Url Transforms field provides a regular expression that can be used to strip or substitute the passed parameters.