Search

21.4. Configuring EJB Call-Time Metrics

download PDF
EJB method call-time measurements are not collected by default.
  1. Click the Inventory tab in the top menu.
  2. Select the Services menu table on the left, and then navigate to the EJB resource.

    Note

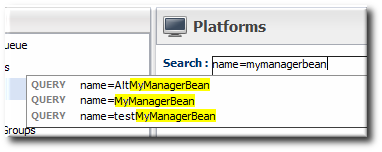
    It is probably easier to search for the session bean by name, if you know it.
  3. Click the Monitoring tab on the EJB resource entry.
  4. Click the Schedules subtab.
  5. Select the Method Invocation Time metric. This metric is the calltime type.
  6. Click the Enable at the bottom of the list.
Red Hat logoGithubRedditYoutubeTwitter

Learn

Try, buy, & sell

Communities

About Red Hat Documentation

We help Red Hat users innovate and achieve their goals with our products and services with content they can trust.

Making open source more inclusive

Red Hat is committed to replacing problematic language in our code, documentation, and web properties. For more details, see the Red Hat Blog.

About Red Hat

We deliver hardened solutions that make it easier for enterprises to work across platforms and environments, from the core datacenter to the network edge.

© 2024 Red Hat, Inc.