The Setup
A significant amount of Example Co.'s business, services, and support is tied to its website. Customers have to be able to access the site to purchase products, schedule training or consulting, and to receive most support and help. If the site is slow or if some resources are inaccessible, customers immediately have a negative experience.
The goal is not to monitor whether the web server is running, but whether the web application are responsive and performing as Example Co.'s customers expect.
What to Do
Tim the IT Guy identifies three different ways that he can capture web application performance information:
Response times for individual URLs
Throughput information like total number of requests and responses
Counts for critical HTTP response codes
Both monitoring and alerting can be configured based solely off response time and throughput metrics. However, bad website performance is indicative of an underlying problem with the web server or its associated database. Therefore, Tim not only wants to be informed when website performance it poor; he wants to correlate some performance metrics with underlying server and database performance and launch operations that can mitigate poor responsiveness.
Tim maps a few common scenarios which cause poor website or web server performance and plans simple, immediate operations that JBoss ON can perform until an IT staffer can analyze the problem. Tim attempts to narrow down potential causes to a performance. Alerts can be issued for a single condition or for a combination of conditions. In Tim's case, he creates a three different alerts based on different combinations of underlying causes for performance problems (
Section 25.1.2, “Basic Procedure for Setting Alerts for a Resource”).
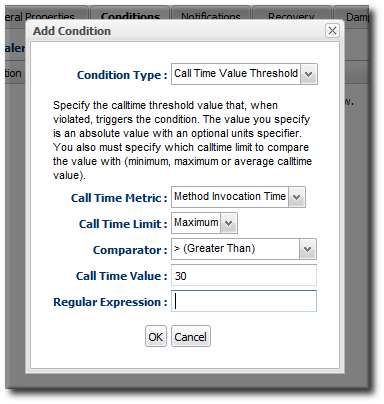
The most critical factor is the response time, which is a factor in every alert. Each alert has one condition based on the call time data, specifically of the call-time data moves past a certain threshold.
Tim picks a reasonable threshold, about 15 seconds, for performance. If performance degrades so that the HTTP Response Time metric returns a value higher than 20 seconds to load pages, JBoss ON issues an alert.
Alternatively, he could alert on simple call-time changes. Call-time changes will trigger an alert for any change from the established baseline, meaning a new minimum, maximum, or average value. A change of any kind can alert in either a decrease in performance or an increase in performance. A threshold alert only alerts on a specific change.
Tim then adds the other condition, with an AND operator, to each alert he configures.
Also, most web app-related metrics are not enabled by default. Tim enables the Total Number of Requests per Minute, Total Number of Responses per Minute, Number of 404 Responses per Minute, and Number of 500 Responses per Minute metrics for each web server (
Section 19.3.4, “Changing Metrics Templates”).
For every alert, Tim also configures an email notification along with the other responses, so that a member of the IT staff can evaluate any website performance problems and take additional actions if necessary.
