Chapter 19. Metrics and Measurements
Every operating system, application, and server has some mechanism for gaging its performance. A database has page hits and misses, servers have open connection counts, platforms have memory and CPU usage. These performance measurements can be monitored by JBoss Operations Network as metrics.
19.1. Direct Information about Resources
Copy linkLink copied to clipboard!
Metrics are a way of measuring a resource's performance or a way of measuring its load. The key word is measurement. A metric is some data point which software exposes, which is relevant to the operations or purpose of that software, that provides insight into the quantifiable behavior of that software.
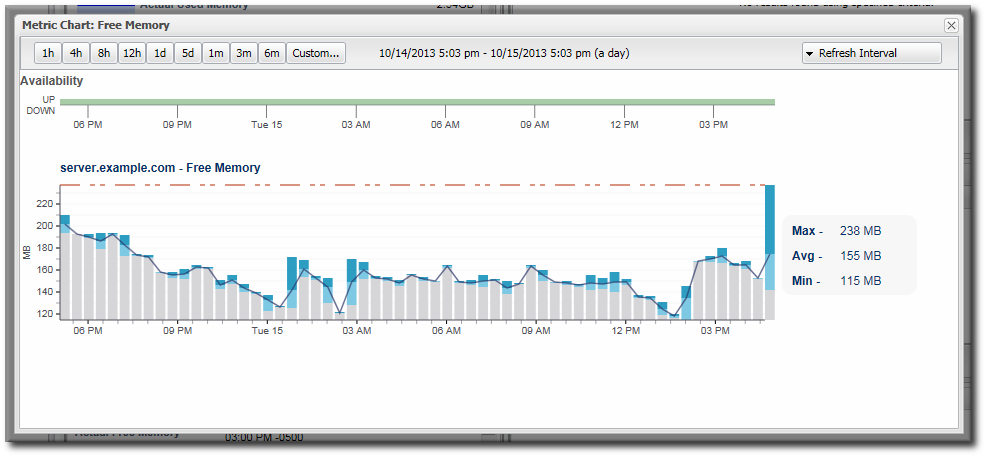
Figure 19.1. Metric Graph
Every type of resource has its own set of metrics, relevant to the resource type. Metrics are defined in the plug-in descriptor for that resource type. The plug-in descriptor lists the types of measurements which are possible and allowed for that resource; that's not necessarily the same thing as the metrics which are actually collected for a resource. Metrics themselves must be enabled (per resource or per metric template) and are then collected on schedule.
19.1.1. Raw Metrics, Displayed Metrics, and Storing Data
Copy linkLink copied to clipboard!
The most recent (and unprocessed) reading of metric information is raw data. This raw data is stored in the backend server, but it is not the information that is displayed in the web UI.
The information displayed in the web UI is aggregated data. In other words, the metrics displayed in JBoss ON and used for monitoring charts are calculated values, not raw data points. Once every hour, a job is run that compresses these metric values into one hour aggregates. These aggregates contain the minimum, maximum, and average value of the measured data for the aggregate period. Aggregates are also made for 6-hour and 24-hour windows.
These aggregates are then used to calculate the data displayed in the UI, according to the range of the graph and the size of the display space. The web UI has a limited display space, segmented into 60 x-axis segments. The JBoss ON server averages the raw data to create the data points for whatever the display time period is. For example, if the display range is 60 hours, each x-axis segment is 1-hour wide, and that data point is an average of all readings collected in that 1-hour segment. This aggregation is dynamic, depending on the monitoring window given in the chart views.
As Section 19.1.4, “Baselines and Out-of-Bounds Metrics” describes, the baseline calculations themselves are aggregates of the raw data, with 1-hour, 6-hour, and 24-hour windows to set minimum, maximum, and average baselines. Unlike the UI aggregates, these aggregated data are calculated and then stored as monitoring data in the server database.
Raw data are only stored for one week, by default, while aggregated values are stored for up to a year. The data storage times are configurable.
19.1.2. Current Values
Copy linkLink copied to clipboard!
As Section 19.1.1, “Raw Metrics, Displayed Metrics, and Storing Data” describes, most of the information displayed in JBoss ON is aggregated data. It is the cumulative result of multiple data points gathered over a monitoring period, and then processed and displayed within the given chart.
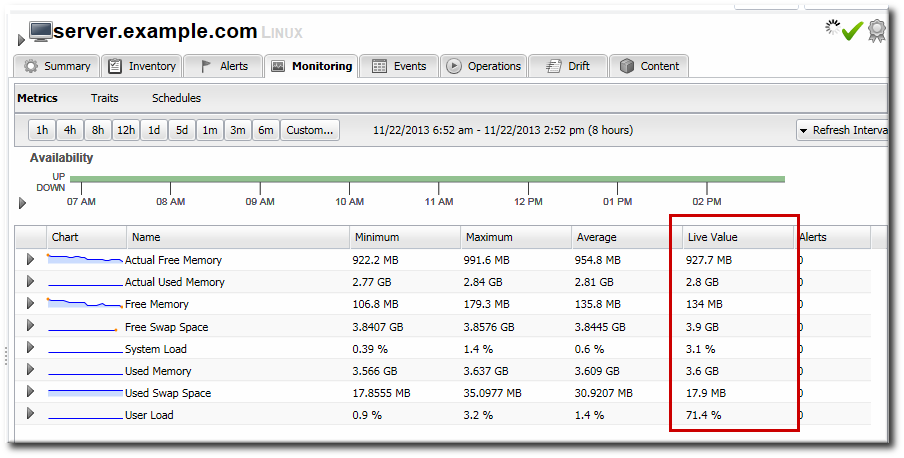
While JBoss ON is not a real-time monitor, it is continually gathering data. The last collected value is displayed on the Monitoring tab of a resource shows the last, raw value for the given metric.
Figure 19.2. Live Values Column
As long as the Monitoring tab is open, the metrics are collected and the live values (and other averaged data) are updated along with the web UI refresh setting, rather than their configured collection schedule. (Availability is checked even more frequently than the refresh schedule, every 15 seconds.) This means that, when viewing the metrics for a resource, the most recent information is always gathered and displayed, and that information is updated as quickly as every minute.
Note
This altered schedule for collecting metrics could impact dampening rules for any alerts for a resource.
For example, if a metric is scheduled to be collected every 10 minutes with dampening set to fire an alert after three (3) occurrances of a certain condition, and the refresh interval of the UI is one minute, then an alert could fire after three minutes if a certain condition is read — even though the intent of the alert is to fire only after half an hour of the condition persisting.
19.1.3. Counting Metrics: Dynamic Values and Trend Values
Copy linkLink copied to clipboard!
It may seem obvious, but understanding metrics data includes understanding how the data are counted. There are two types of counted values:
- Dynamic values show a momentary and changeable value, a current state. This includes things like the current number of connections to an application server or the CPU usage on a platform.
- Trend values are cumulative counts, totals since the resource was started or over its lifetime. These values only progress in a single direction (ususally, but not always, higher)
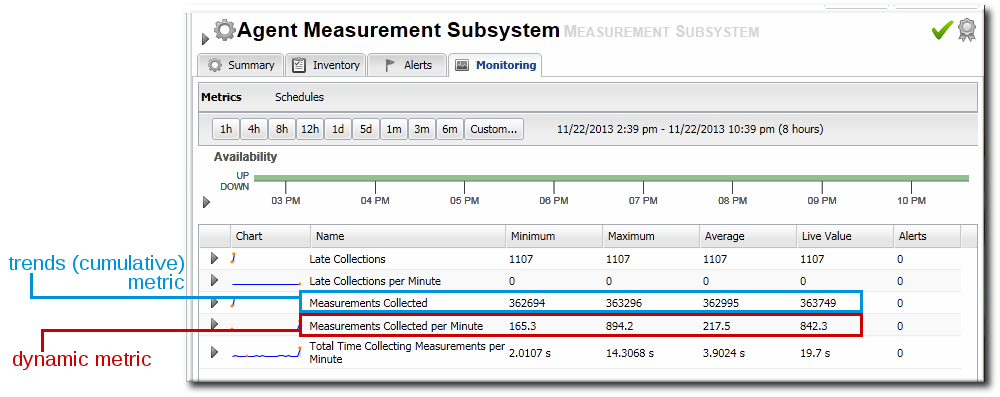
For example, there are two similar metrics for the agent's measurement subsystem: metrics collected and metrics collected per minute. The latter is a dynamic metric, meaning that its value goes up and down depending on whatever number of metrics has actually been collected in the last minute. Metrics collected (the first metric) is a cumulative number; it is the total number of metrics collected by the agent, since it started. So, these two metrics have very different values, despite counting the same data.
Figure 19.3. Dynamic and Trend Values for Metrics
As Figure 19.3, “Dynamic and Trend Values for Metrics” shows, it is possible to calculate an average for trend data, but that value is meaningless. Likewise, the "minimum" for a trend value is the starting value of the selected time period, while the "maximum" is the last value for the selected time period. Other automatic calculations — such as out-of-bound values and baselines — are also meaningless with trend data, but are valuable with dynamic data.
19.1.4. Baselines and Out-of-Bounds Metrics
Copy linkLink copied to clipboard!
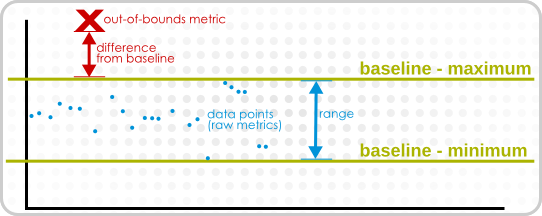
After metrics have been collected for a reliable amount of time, JBoss ON automatically calculates a baseline for the metric. A baseline is the normal operating range for that metric on that resource. The baseline is caluclated, by default, every three days using the aggregated data. The baseline uses a rolling window of seven days' of data.
Baseline metrics compare changes in actual data against a baseline value. Baselines allow effective trending analysis, SLAs management, and overall application health assessments as a form of fault management.
Baselines allow JBoss ON to identify metric values collected that fall outside (out-of-bounds) of the high and low baselines. Out-of-bounds metrics are reported as problem metrics.
Note
When an alert is triggered in response to a metric value, the alerting event is tracked as a problem metric.
If there are no baselines present, because they have not yet been computed or because the metric is a trends metric (meaning it is a cumulative value), no out-of-bounds factors will be calculated.
A baseline has a bandwidth that is the difference between its minimum and maximum values. The difference is the absolute amount that the problem metric is outside the baseline. To be able to compare out-of-bound values, an out-of-bounds-factor is computed by dividing the difference by the bandwidth. This creates a ratio to show comparatively how far out of the normal operation range the problem metric is.
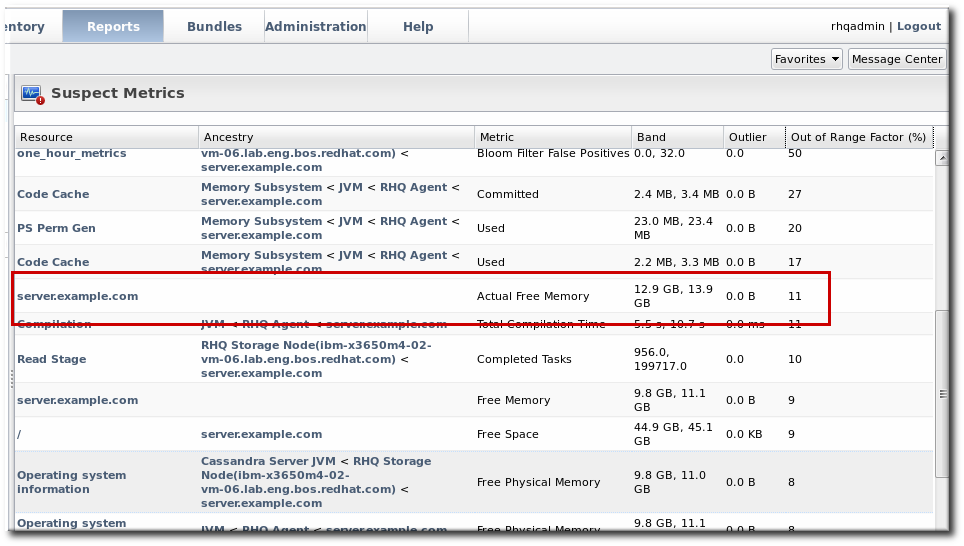
In the Suspect Metrics report, the baselines are reported as minimum,maximum, and then the out-of-bounds metric is listed as the outlier. The difference between the baselines and the outliers is shown as a percentage: the difference of the outlier to its nearest baseline, divided by the baseline bandwidth.
Figure 19.4. Suspect Metrics Reports
Note
Calculating baselines can sometimes output non-intuitive results, as a band of (1,2) and an outlier value of 3 seems to be less than a band of (100, 200 MB) and an outlier value of 250 MB. The former is actually 100% outside the expected band, while the latter is only 50% outside.
Figure 19.5. Out-of-Bound Factors
Out-of-bounds-factors are recalculated each hour during a calculation job. The job assesses the aggregate and determines if there is a more severe outlier than before. The chart always displays the most severe outlier.
When the baselines for a metric change, all recorded out-of-bounds values become invalid and are removed because the out-of-bounds measurement was computed against an old baseline.
19.1.5. Collection Schedules
Copy linkLink copied to clipboard!
The metric collection schedule is defined individually for each metric in the resource type's plug-in descriptor.
There is no rule on how frequently metrics are collected. Default intervals range between 10 minutes and 40 minutes for most metrics. While some metrics are commonly important (like free memory or CPU usage on platforms), the importance of many metrics depends on the general IT and production environments and the resource itself. Set reasonable intervals to collect important metrics with a frequency that adequately reflects the resource's real life performance.
The shortest configurable interval is 30 seconds, although an interval that short should be used sparingly because the volume of metrics reported could impact database performance.
19.1.6. Metric Schedules and Resource Type Templates
Copy linkLink copied to clipboard!
Unlike other types of monitoring data which are unique to an resource (availability, events, traits), metrics can be universal for all resources of that type.
Metric collection schedules define whether an allowed metric for a resource is actually enabled and what its collection interval is. A schedule is set at the resource-level, but administrator-defined default settings can be applied to all resources of a type by using metrics collection templates.
Templates are a server configuration setting. They define what metrics are active and what the collection schedules are for all resources of a specific type. When templates are used, they supplant whatever default metrics settings are given in the plug-in descriptor. (A metric template only defines whether a metric is enabled and what its interval is — the plug-in descriptor alone defines what metrics are available for a resource type.)
These settings can be overridden at the resource-level, as necessary. Still, metrics collection templates provide a simple way to apply metrics settings consistently across resources and machines.
