5.2. 대시보드 UI 플러그인
Cluster Observability Operator는 기술 프리뷰 기능 전용입니다. 기술 프리뷰 기능은 Red Hat 프로덕션 서비스 수준 계약(SLA)에서 지원되지 않으며 기능적으로 완전하지 않을 수 있습니다. 따라서 프로덕션 환경에서 사용하는 것은 권장하지 않습니다. 이러한 기능을 사용하면 향후 제품 기능을 조기에 이용할 수 있어 개발 과정에서 고객이 기능을 테스트하고 피드백을 제공할 수 있습니다.
Red Hat 기술 프리뷰 기능의 지원 범위에 대한 자세한 내용은 기술 프리뷰 기능 지원 범위를 참조하십시오.
대시보드 UI 플러그인은 Observe
플러그인은 console.openshift.io/dashboard-datasource: 'true' 레이블이 있는 openshift-config-managed 네임스페이스의 ConfigMap 리소스에서 데이터 소스를 검색합니다.
5.2.1. Cluster Observability Operator 대시보드 UI 플러그인 설치
사전 요구 사항
-
cluster-admin클러스터 역할의 사용자로 클러스터에 액세스할 수 있습니다. - OpenShift Container Platform 웹 콘솔에 로그인했습니다.
- Cluster Observability Operator가 설치되어 있습니다.
프로세스
-
OpenShift Container Platform 웹 콘솔에서 Operator
설치된 Operator 를 클릭하고 Cluster Observability Operator를 선택합니다. - UI 플러그인 탭(tab 목록의 맨 오른쪽에 있는)을 선택하고 Create UIPlugin 을 누릅니다.
YAML 보기를 선택하고 다음 콘텐츠를 입력한 다음 Create:을 누릅니다.
apiVersion: observability.openshift.io/v1alpha1
kind: UIPlugin
metadata:
  name: dashboards
spec:
  type: Dashboards
5.2.2. 대시보드 구성
대시보드 UI 플러그인은 console.openshift.io/dashboard-datasource: 'true' 레이블이 있는 openshift-config-managed 네임스페이스의 ConfigMap 리소스에서 데이터 소스를 검색합니다. ConfigMap 리소스는 데이터 소스 유형과 데이터를 가져올 수 있는 클러스터 내 서비스를 정의해야 합니다.
다음 섹션의 예제는 https://github.com/openshift/console-dashboards-plugin 에서 가져옵니다.
사전 요구 사항
-
cluster-admin클러스터 역할의 사용자로 클러스터에 액세스할 수 있습니다. - OpenShift Container Platform 웹 콘솔에 로그인했습니다.
- Cluster Observability Operator가 설치되어 있습니다.
- 대시보드 UI 플러그인을 설치했습니다.
프로세스
console.openshift.io/dashboard-datasource: 'true'레이블을 사용하여openshift-config-managed네임스페이스에ConfigMap리소스를 생성합니다. 아래 예제는 prometheus-datasource-example.yaml에서 가져온 것입니다.apiVersion: v1 kind: ConfigMap metadata: name: cluster-prometheus-proxy namespace: openshift-config-managed labels: console.openshift.io/dashboard-datasource: "true" data: "dashboard-datasource.yaml": |- kind: "Datasource" metadata: name: "cluster-prometheus-proxy" project: "openshift-config-managed" spec: plugin: kind: "prometheus" spec: direct_url: "https://prometheus-k8s.openshift-monitoring.svc.cluster.local:9091"데이터 소스에 연결하는 사용자 지정 대시보드를 구성합니다. 샘플 대시보드의 YAML은 prometheus-dashboard-example.yaml 에서 사용할 수 있습니다. 해당 파일에서 발췌한 내용은 설명을 위해 아래에 표시되어 있습니다.
예 5.1. prometheus-dashboard-example.yaml에서 가져온 예제 대시보드에서 추출
apiVersion: v1
kind: ConfigMap
metadata:
  name: dashboard-example
  namespace: openshift-config-managed
  labels:
    console.openshift.io/dashboard: "true"
data:
  k8s-resources-workloads-namespace.json: |-
    {
        "annotations": {
            "list": [

            ]
        },
        "editable": true,
        "gnetId": null,
        "graphTooltip": 0,
        "hideControls": false,
        "links": [

        ],
        "refresh": "10s",
        "rows": [
            {
                "collapse": false,
                "height": "250px",
                "panels": [
                    {
                        "aliasColors": {

                        },
                        "bars": false,
                        "dashLength": 10,
                        "dashes": false,
                        "datasource": {
                            "name": "cluster-prometheus-proxy",
                            "type": "prometheus"
                        },
                        "fill": 10,
                        "id": 1,
                        "interval": "1m",
                        "legend": {
                            "alignAsTable": true,
                            "avg": false,
                            "current": false,
                            "max": false,
                            "min": false,
                            "rightSide": true,
                            "show": true,
                            "total": false,
                            "values": false
                        },
                        "lines": true,
                        "linewidth": 0,
                        "links": [

                        ],
                        "nullPointMode": "null as zero",
                        "percentage": false,
                        "pointradius": 5,
                        "points": false,
                        "renderer": "flot",
                        "seriesOverrides": [
                            {
                                "alias": "quota - requests",
                                "color": "#F2495C",
                                "dashes": true,
                                "fill": 0,
                                "hiddenSeries": true,
                                "hideTooltip": true,
                                "legend": true,
                                "linewidth": 2,
                                "stack": false
                            },
                            {
                                "alias": "quota - limits",
                                "color": "#FF9830",
                                "dashes": true,
                                "fill": 0,
                                "hiddenSeries": true,
                                "hideTooltip": true,
                                "legend": true,
                                "linewidth": 2,
                                "stack": false
                            }
                        ],
                        "spaceLength": 10,
                        "span": 12,
                        "stack": false,
                        "steppedLine": false,
                        "targets": [
                            {
                                "expr": "sum(  node_namespace_pod_container:container_cpu_usage_seconds_total:sum_irate{cluster=\"$cluster\", namespace=\"$namespace\"}* on(namespace,pod)  group_left(workload, workload_type) namespace_workload_pod:kube_pod_owner:relabel{cluster=\"$cluster\", namespace=\"$namespace\", workload_type=\"$type\"}) by (workload, workload_type)",
                                "format": "time_series",
                                "intervalFactor": 2,
                                "legendFormat": "{{workload}} - {{workload_type}}",
                                "legendLink": null,
                                "step": 10
                            },
                            {
                                "expr": "scalar(kube_resourcequota{cluster=\"$cluster\", namespace=\"$namespace\", type=\"hard\",resource=\"requests.cpu\"})",
                                "format": "time_series",
                                "intervalFactor": 2,
                                "legendFormat": "quota - requests",
                                "legendLink": null,
                                "step": 10
                            },
                            {
                                "expr": "scalar(kube_resourcequota{cluster=\"$cluster\", namespace=\"$namespace\", type=\"hard\",resource=\"limits.cpu\"})",
                                "format": "time_series",
                                "intervalFactor": 2,
                                "legendFormat": "quota - limits",
                                "legendLink": null,
                                "step": 10
                            }
                        ],
                        "thresholds": [

                        ],
                        "timeFrom": null,
                        "timeShift": null,
                        "title": "CPU Usage",
                        "tooltip": {
                            "shared": false,
                            "sort": 2,
                            "value_type": "individual"
                        },
                        "type": "graph",
                        "xaxis": {
                            "buckets": null,
                            "mode": "time",
                            "name": null,
                            "show": true,
                            "values": [

                            ]
                        },
...
Observe
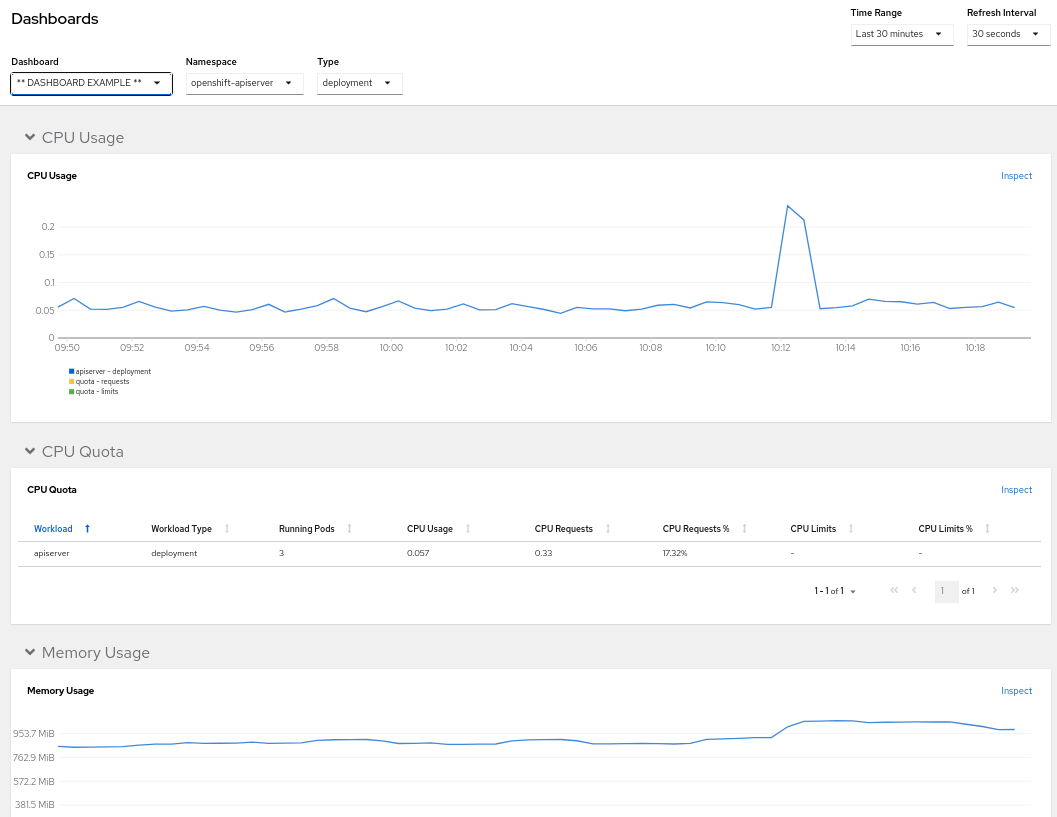
Dashboards 를 클릭하면 prometheus-dashboard-example.yaml의 구성에 따라 ** DASHBOARD EXAMPLE **이라는 제목과 함께 사용자 정의 대시보드를 사용할 수 있습니다.
UI에서 대시보드의 네임스페이스, 시간 범위 및 새로 고침 간격을 설정할 수 있습니다.
5.2.3. 추가 리소스
- console-dashboards-plugin GitHub 리포지토리에 새 데이터 소스를 추가하는 방법을 참조하십시오.