32.6. Monitoring JBoss EAP 6 Resources
32.6.1. Runtime Information and JBoss ON Monitoring
Copy linkLink copied to clipboard!
Metrics are a live-stream of information about how a resource or group of resources are performing. Metrics are vital signs, like the heart rate, blood pressure, and oxygen levels for a hospital patient. For resources, those vital statistics are elements like availability, page hits for database caches, or active connections for datasources or web applications. Those metrics show resource health, observed at a specific moment.
The JBoss EAP 6 console shows that current and immediate snapshot of information for a handful of critical metrics for a few critical resources, like datasources, transactions, and web applications.
This changing information is displayed in the Runtime tab of the EAP 6 console.
Figure 32.18. EAP 6 Runtime Metrics
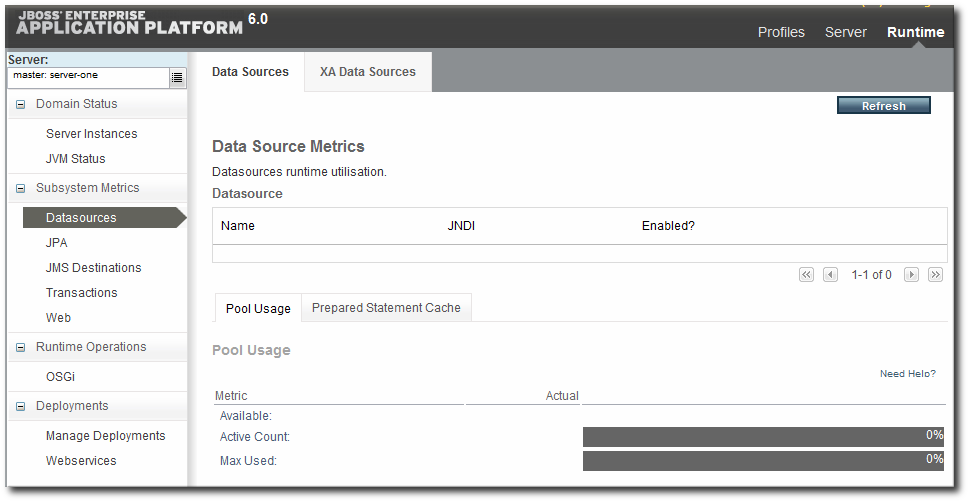
Runtime information shows the health for that exact moment in time.
Looking at the runtime information over time gives a much better perspective of how a resource is performing, generally. Every resource in JBoss ON has areas to view and configure monitoring and to configure alerting based on that monitoring.
JBoss ON automatically processes runtime metrics in a few different ways, to help administrators process performance data:
- Time-based monitoring graphs for each metric
- Operating parameters, or baselines calculated on the real performance of the resource
- Availability uptime percentages, recovery times, and mean down time
Figure 32.19. JBoss ON Baselines for a Single Metric
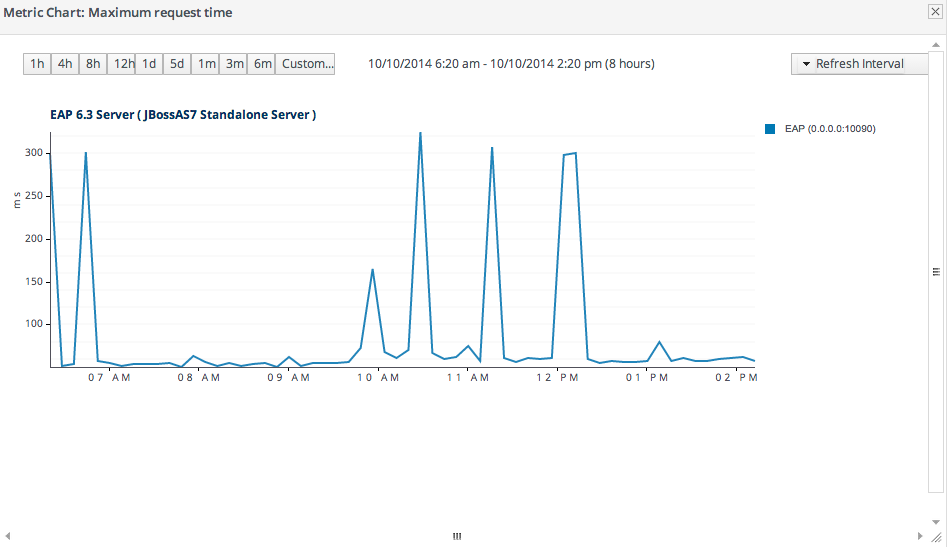
JBoss ON also exposes more monitoring data for individual resources through its GUI:
- More metrics are available for resources. At a minimum, every resource has availability monitoring. Some resources — like datasources and managed servers — have dozens more metrics that can be enabled for routine monitoring.
- Response time monitoring can be configured for specific URLs and pages for web applications. This allows administrators to track usability and customer experience for web applications along with internal metrics like connection counts.
- Event log monitoring can filter important messages from different error logs. This allows JBoss ON to respond (through alerts) to issues that may not have crossed a performance threshold yet, and it also makes it possible for administrators to correlate log events with observed performance metrics.
32.6.2. Setting up Monitoring for EAP 6 Resources
Copy linkLink copied to clipboard!
The Runtime tab in the JBoss EAP 6 management console gives an current snapshot of the state of managed servers and some common subsystems. The emphasis of the EAP 6 console is on quick access to current information. This makes it easy to perform immediate management tasks.
JBoss ON focuses on long-term performance tracking, not just an immediate view. The EAP 6 agent plug-in for JBoss ON allows administrators to monitor additional metrics for resources, to track historical measurements and establish performance baselines, and to view how the resource status has changed (gone up or down) and how long it has been in different states.
Figure 32.20. Monitoring Graph
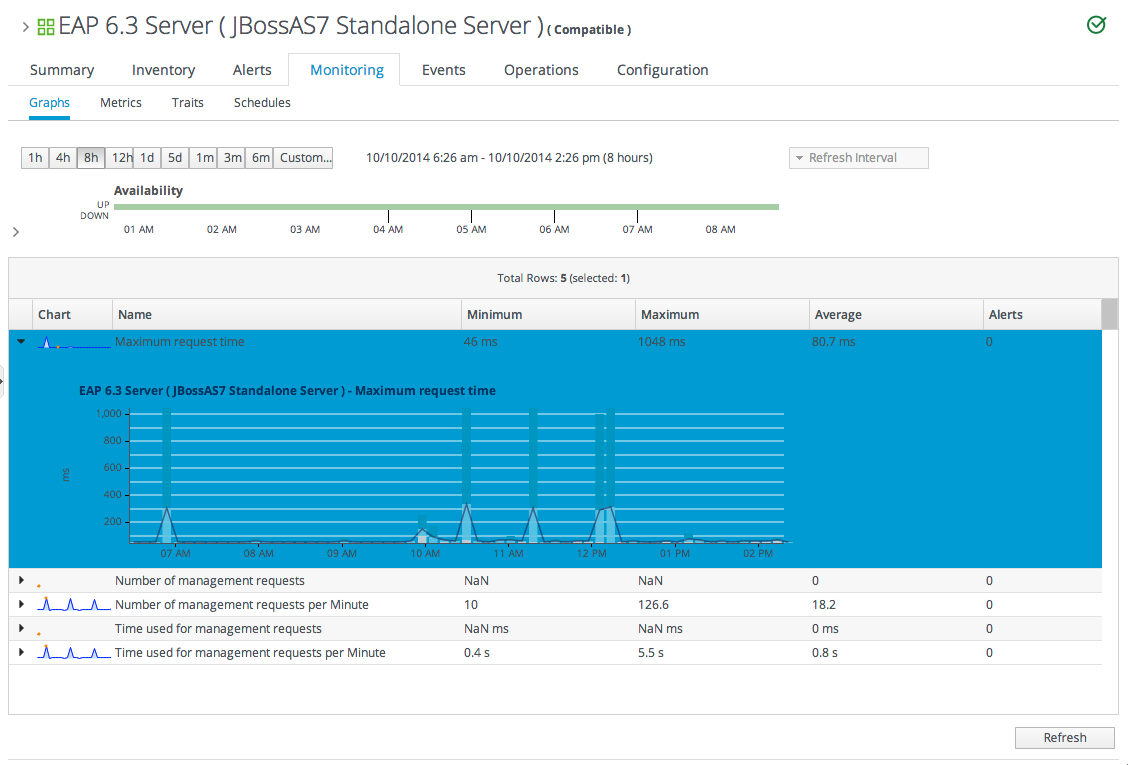
Monitoring information is displayed in graphs and in tables on the Monitoring tab. The Summary tab has visually different line graphs rendered in the monitoring portlet.
Note
For more information on monitoring concepts and configuration, see Part III, “Monitoring”.
32.6.2.1. Enabling Additional Metrics
Copy linkLink copied to clipboard!
JBoss ON supports all of the metrics for JBoss EAP 6 resources that are displayed in the EAP 6 console, along with many additional metrics.
The metrics enabled by default in JBoss ON, however, may not be the same ones that are viewable in the EAP 6 console. For example, for data sources, the EAP 6 console displays the available connections count, active connections count, and max used connections count. In JBoss ON, the default metrics collected are the maximum and minimum pool size settings, the max wait time, and the number of time outs per minute.
Note
A complete list of possible metrics for each resource type is given in the Complete Resource Reference.
Metric collection can be enabled or disabled for a resource. Administrators can also reset how often JBoss ON checks a given metric (the collection interval).
Note
Checking less important metrics less frequently can improve platform and agent performance, while still recording that information for reference or event correlation.
To change the monitoring configuration for a resource:
- Click the Inventory tab in the top menu.
- Select Servers - Top Level Imports in the Resources menu table on the left. Then select the JBoss EAP 6 server and navigate to the resource to edit.
- Click the Monitoring tab on the resource entry.
- Click the Schedules subtab.
- To enable a metric:
- Select the metric row. Multiple metrics can be selected using the Ctrl key.
- Click the Enable button at the bottom of the page.
- To change a collection interval for a metric:
- Select the metric row. Multiple metrics can be selected using the Ctrl key, if they will all be changed to the same frequency.

- Enter the desired collection period in the Collection Interval field, with the appropriate time unit (seconds, minutes, or hours).
- Click Set.
NoteChanging the collection interval for a disabled metric automatically enables the metric.
32.6.2.2. Availability Monitoring
Copy linkLink copied to clipboard!
Availability is a (mostly) straightforward measurement that shows whether a resource is running and minimally responsive. If the agent can connect to the resource, that resource is available.
This is how availability is displayed in the EAP 6 console for a resource: it shows whether a resource is currently running.
Figure 32.21. Availability in the EAP 6 Console
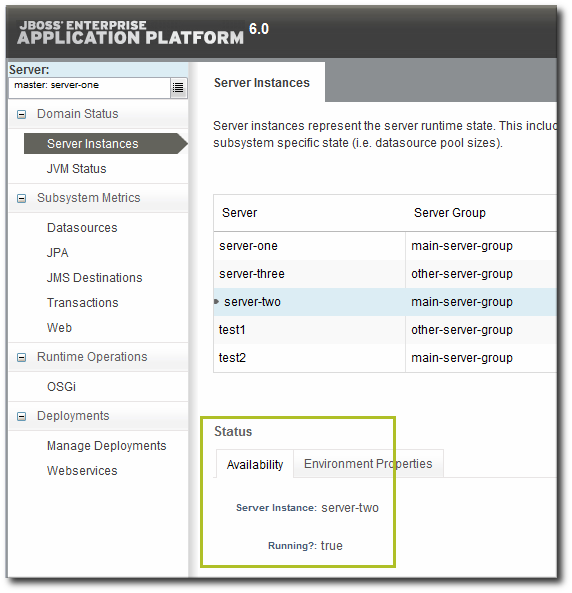
As a measure of performance, availability can acquire more shades of gray than simply is it running. For example, has a resource been cycling off and on repeatedly? Does it stay offline for long periods before it recovers? Is a resource unavailable because of its own failure or is a parent resource (like the platform) unreachable, while the child is running fine? JBoss ON supports four resources states — up, down, disabled, and unknown — to try to differentiate between real states for the resources.
Availability is covered in much more detail in Chapter 18, Availability.
Along with showing the current status of a resource, JBoss ON also shows how long the resource has been in that state and what percentage of time the resource spends in different states. This allows JBoss ON to calculate a few different trends per resource:
- Its overall uptime percentage
- Total time spent in different states (up, down, or disabled)
- The total number of failures (times it has gone down)
- The mean time between failures, which is essentially the mean time that a resource is up and available
- The mean time to recovery, which is the mean amount of time that it takes a resource to come back up after a failure
Figure 32.22. Availability in JBoss ON
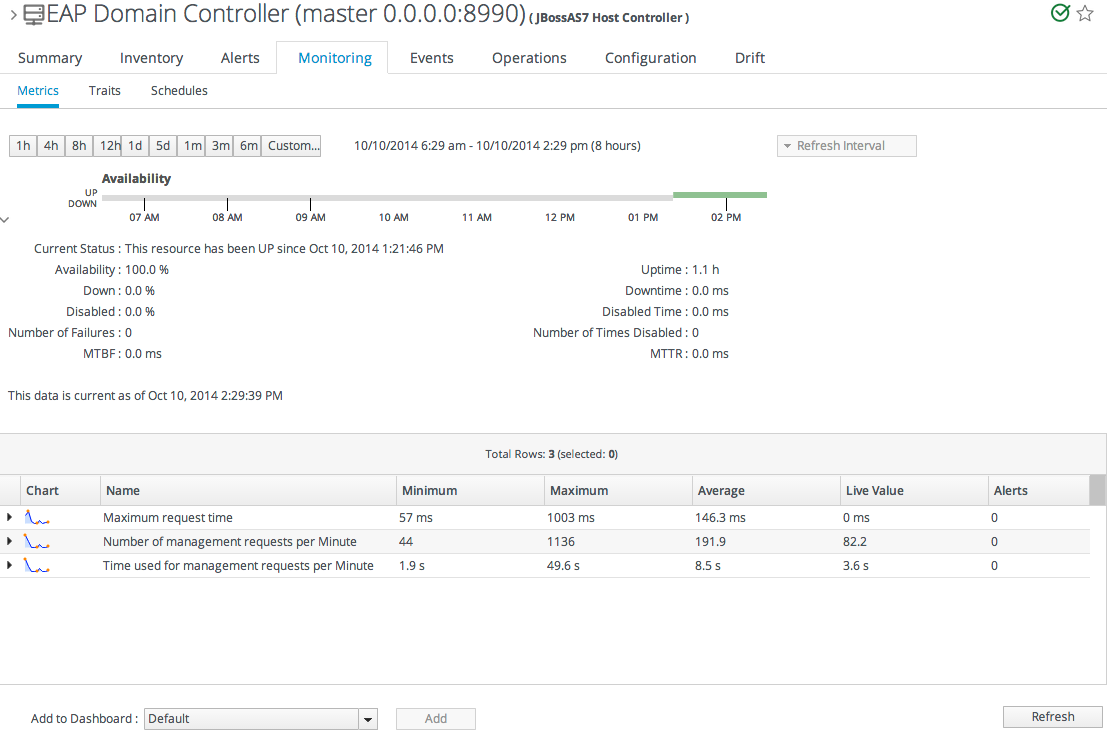
Availability is collected on a schedule, much like a monitoring metric. Controlling the frequency of availability checks can establish a resource priority.
Note
Servers, such as domain controllers and managed servers, have availability checks that run every minute. This can help catch resource cycling in unstable servers. Services, like datasources and JMS queues, are checked for availability every 10 minutes.
The frequency of availability checks can have an impact on agent performance, particularly for servers structured like EAP 6, with a large number of child resources. Every resource is checked for availability, by default. There may be some low-level child resource, like OSGi classes or EJBs, that really do not require an independent availability check. In that case, availability checks can be disabled for the child. The agent automatically applies the parent state to the child; if the parent is running, than the child is assumed to be running. This is called backfilling.
32.6.3. Configuring Events Monitoring
Copy linkLink copied to clipboard!
Event monitoring is essentially a log filter. The resource itself maintains a log file; JBoss ON checks any specified log file for messages or events that occur. JBoss ON can check for messages in a stream or only for messages that match a certain pattern or severity.
JBoss ON can issue alerts based on log messages and even take action automatically in response to events, like creating a new managed resource or restarting a server.
Since events are unpredictable, based on the real operations of the resource rather than a schedule, it is a big advantage to administrators to be able to filter messages and respond dynamically.
Note
Events configuration is described more in Chapter 20, Events.
Three JBoss EAP 6 server types support events, and they are preconfigured with an event log in the standard location:
- Host controllers, in
domain/log/host-controller.log - Managed servers, in
domain/servers/server-three/log/server.log - Standalone servers, in
standalone/log/server.log
While the event log is already configured, it is not enabled by default. The event log must be enabled before events are collected by the JBoss ON agent. Additional settings, such as specific strings to look for in log messages, can also be set.
- Click the Inventory tab in the top menu.
- Click the Servers - Top Level Imports item, and select the JBoss EAP 6 resource.
- Navigate to the appropriate EAP 6 resource.
- Click the Inventory tab on the resource entry.
- Select the Connection Settings subtab.
- Click the plus icon under the Events Log section.

- Enable the event entry.Optionally, set the date format, string filters to include messages, or the severity of the messages to include.

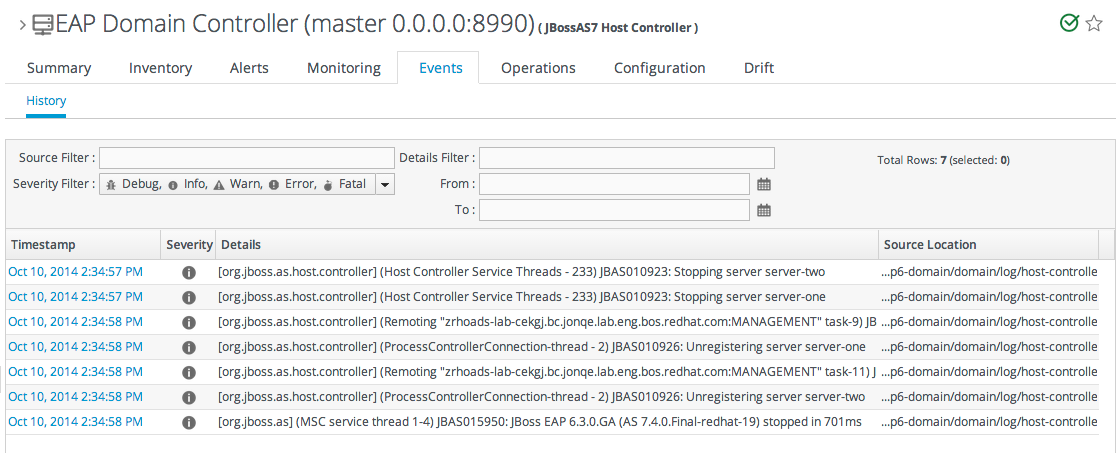
When event monitoring is enabled, the matching log messages are displayed in the Events tab for the resource.
Figure 32.23. JBoss EAP 6 Event Logging
32.6.4. Alerting on JBoss EAP 6 Resources
Copy linkLink copied to clipboard!
Alerting is covered in detail in Chapter 25, Defining Alerts, and that is the best reference for details on planning what alert conditions to set and how to respond.
The key thing in planning alerts is planning automatic responses to whatever condition triggered the alert. For example, within an EAP 6 domain, one managed server may go offline or begin exhibiting extremely slow response times. In that case, JBoss ON can automatically create a new managed server instance, within the same server group, on another platform to take the failing server's place.
Taking an immediate response, without necessarily requiring administrator intervention, is invaluable for customer-facing problems, such as poor response times for a web application.
There are several types of responses that JBoss ON can take:
- Email an administrator
- Run a restart operation on the alerting resource
- Run an operation on the parent of the alerting resource
- Run a shell script
- Run a JBoss ON server-side scriptServer-side scripts are extremely powerful. A script can perform almost any management task in JBoss ON: change resource configuration, deploy updated packages, create new resources, delete existing resources, run an operation, or all of the above. For more information on writing server-side scripts, see "Writing JBoss ON Command-Line Scripts".
32.6.5. Drift Configuration Monitoring on JBoss EAP 6 Resources
Copy linkLink copied to clipboard!
JBoss ON supports drift configuration monitoring using the JBoss Enterprise Application Platform 6 plug-in. Drift Configuration Monitoring enables users to monitor and track configuration file changes made to the server configuration directory in both standalone and host controller resources. This applies to changes made to configuration files by JBoss ON as well as changes made using the JBoss Enterprise Application Platform CLI or JBoss Enterprise Application Platform Administration Console. JBoss ON drift configuration monitoring also tracks and monitors deployments made to JBoss Enterprise Application Platform 6 such as applications and datasources. For more information on managing configuration drift, see Chapter 15, Managing Configuration Drift.
To enable Drift Configuration Monitoring:
- In the top menu, click the Inventory.
- Select Servers - Top Level Imports from the Resources menu table on the left.
- In the inventory tree, select the standalone or host controller to monitor configuration drift.
- Click on the Drift tab.
- Click on the New button at the bottom.
- Choose Template-Configuration Files from the drop down menu and click Next.

- Fill in the configuration options and click finish.
