21.6. Setting up Response Time Monitoring for Apache, EWS/Tomcat, and JBoss EAP 5
Response time monitoring is not available from application or web servers by default; a special module must be installed which allows JBoss ON to collect response time metrics.
After the module is installed, then the HTTP metrics can be enabled for the resource.
21.6.1. Parameters for User-Defined s
Copy linkLink copied to clipboard!
Administrators can set rules for how response time metrics are collected for application and web servers. This are response time filters.
For response time monitoring to work, JBoss, Apache, and EWS/Tomcat all must have response time filters installed. Additional configuration options can be added to those default filters to customize the monitoring for the resource.
|
Parameter
|
Description
|
|---|---|
|
chopQueryString
|
Only the URI part of a query will be logged if this parameter is set to true. Otherwise the whole query line will be logged. Default is true.
|
|
logDirectory
|
The directory where the log files will be written to. Default setting is {
jboss.server.log.dir}/rt/ (usually server/xxx/log/rt). If this property is not defined, the fallback is {java.io.tmpdir}/rt/ (/tmp/ on UNIX®, and ~/Application Data/Local Settings/Temp – check the TEMP environment variable) is used. If you specify this init parameter, no directory rt/ will be created, but the directory you have provided will be taken literally.
|
|
logFilePrefix
|
A prefix that is put in front of the log file names. Default is the empty string.
|
|
dontLogRegEx
|
A regular expression that is applied to query strings. See java.util.regex.Pattern. If the parameter is not given or an empty string, no pattern is applied.
|
|
matchOnUriOnly
|
Should the dontLogRegEx be applied to the URI part of the query (true) or to the whole query string (false). Default is true.
|
|
timeBetweenFlushesInSec
|
Log lines are buffered by default. When the given number of seconds have passed and a new request is received, the buffered lines will be flushed to disk even if the number of lines to flush after (see next point) is not yet reached.. Default value is 60 seconds (1 Minute).
|
|
flushAfterLines
|
Log lines are buffered by default. When the given number of lines have been buffered, they are flushed to disk. Default value is 10 lines.
|
|
maxLogFileSize
|
The maximum allowed size, in bytes, of the log files; if a log file exceeds this limit, the filter will truncate it; the default value is 5242880 (5 MB).
|
|
vHostMappingFile
|
This properties file must exist in the Tomcat process classpath. For example, in the
conf/vhost-mappings.properties file. The file contains mappings from the 'incoming' vhost (server name) to the vhost that should be used as the prefix in the response time log file name. If no mapping is present (no file or no entry response times are set), then the incoming vhost (server name) is used. For example:
The first mapping states that if the incoming vhost is 'host1.users.acme.com', then the log file name should get a vhost of 'host1' as prefix, separated by a _ from the context root portion. The second mapping states that if the 'incoming' vhost is 'host1', then no prefix, and no _, should be used. The third mapping uses a special left-hand-side token, '%HOST%'. This mapping states that if the 'incoming' vhost is a representation of localhost then no prefix, and no _ , should be used.
%HOST% will match the host name, or canonical host name or IP address, as returned by the implementation of InetAddress.getLocalHost().
The second and third mappings are examples of empty right hand side, but could just as well have provided a vhost.
This is a one time replacement. There is no recursion in the form that the result of the first line would then be applied to the second one.
|
21.6.2. Installing Response Time Filters for JBoss EAP/AS 5
Copy linkLink copied to clipboard!
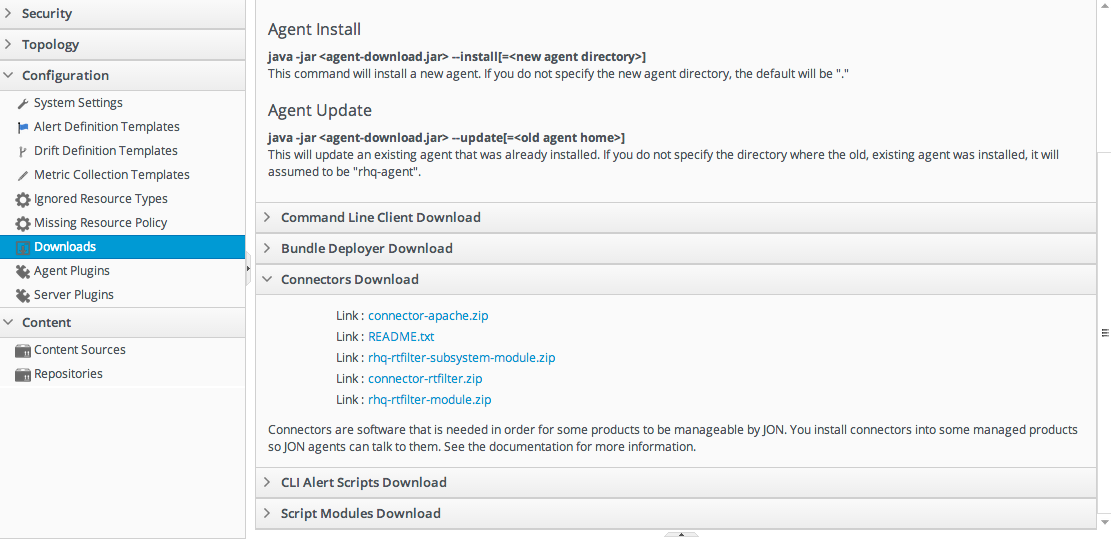
To collect response time metrics for a JBoss EAP/AS 5 server, first install the servlet JAR for the response time filter and configure the web server to use it.
- Download the Response Time packages for JBoss from the JBoss ON UI.NoteThis can also be done from the command line using wget:
[root@server ~]# wget http://server.example.com:7080/downloads/connectors/connector-rtfilter.zip- Click the Administration tab in the top menu.
- In the Configuration menu box on the left, select the Downloads item.

- Click the connector-rtfilter.zip link, and save the file.
- Unzip the connectors.
[root@server ~]# unzip connector-rtfilter.zip - Copy the
rhq-rtfilter-version.jarfile into thelib/directory for the profile.[root@server ~]# cp connector-rtfilter/rhq-rtfilter-version.jar JbossHomeDir/server/profileName/lib/JBoss EAP/AS already includes thecommons-logging.jarfile, which is also required for response time filtering. - Then, configure the
web.xmlfor the EAP/AS instance.The response time filter can be deployed globally, for all web applications hosted by the EAP/AS instance or it can be configured for a specific web application.To configure it globally, edit the globalweb.xmlfile:[root@server ~]# vim JbossHomeDir/server/configName/deployers/jbossweb.deployer/web.xmlTo configure it for a single web app, edit that one web app'sweb.xmlfile:[root@server ~]# vim WARLocation/WEB-INF/web.xml - Add the filter and, depending on the configuration, filter mapping elements to the file. This activates the response time filtering.All that is required for response time filtering to work is the default <filter> element, without any optional parameters. However, the parameters can be uncommented and set as necessary; the different ones are described in Section 21.6.1, “Parameters for User-Defined <filter>s”.
<filter> <filter-name>RhqRtFilter</filter-name> <filter-class>org.rhq.helpers.rtfilter.filter.RtFilter</filter-class> <!-- Optional parameters. <init-param> <param-name>chopQueryString</param-name> <param-value>true</param-value> </init-param> <init-param> <param-name>logDirectory</param-name> <param-value>/tmp</param-value> </init-param> <init-param> <param-name>logFilePrefix</param-name> <param-value>localhost_7080_</param-value> </init-param> <init-param> <param-name>dontLogRegEx</param-name> <param-value></param-value> </init-param> <init-param> <param-name>matchOnUriOnly</param-name> <param-value>true</param-value> </init-param> <init-param> <param-name>timeBetweenFlushesInSec</param-name> <param-value>73</param-value> </init-param> <init-param> <param-name>flushAfterLines</param-name> <param-value>13</param-value> </init-param> <init-param> <param-name>maxLogFileSize</param-name> <param-value>5242880</param-value> </init-param> --> </filter> <!-- Use this only when also enabling the RhqRtFilter in the filter <filter-mapping> <filter-name>RhqRtFilter</filter-name> <url-pattern>/*</url-pattern> </filter-mapping> --> - Restart the JBoss EAP/AS server to load the new
web.xmlsettings. - Enable the HTTP metrics, as described in Section 21.6.5, “Configuring HTTP Response Time Metrics”, so that JBoss ON checks for the response time metrics on the application server.
21.6.3. Configuring Apache Servers for Response Time Metrics
Copy linkLink copied to clipboard!
- To use the Response Time module, the Apache server needs to have been compiled with shared object support. For Red Hat Enterprise Linux systems and EWS servers, this is enabled by default.To verify that the Apache server was compiled with shared object support, use the apachectl -l command to list the compiled modules and look for the
mod_so.cmodule:[root@server ~]# apachectl -l Compiled in modules: core.c prefork.c http_core.c mod_so.cUse the- -enable-module=sooption:[jsmith@server ~]$ ./configure - -enable-module=so [jsmith@server ~]$ make install - Download the Apache binaries from the JBoss ON UI.
- Log into the JBoss ON UI.
https://server.example.com:7080 - Click the Administration tab in the top menu.
- In the Configuration menu box on the left, select the Downloads item.

- Click the connector-apache.zip link, and save the file.
- Extract the Apache connectors.
[root@server ~]# unzip connector-apache.zip - Compile the Response Time module.Noteapxs must be installed, and make must be installed and in the user PATH.
[root@server ~]# cd apacheMOduleRoot/apache-rt/sources [root@server sources]# chmod +x build_apache_module.sh [root@server sources]# ./build_apache_module.sh 2.x apache_install_directory/bin/apxs - Then, install the Response Time module on the Apache server.
[root@server sources]# cp apache2.x/.libs/mod_rt.so apache_install_directory/modules - Open the
httpd.conffile. For example:[root@server ~]# vim apache_install_directory/conf/httpd.conf - Enable the module in the Apache's
httpd.conffile by appending this line to the end of the file:LoadModule rt_module modules/mod_rt.so LogFormat "%S" rt_logWhen setting the log format, the variable %S has a capital S. - To configure response time logging for the main Apache server, add the following line at the top level of the file:
CustomLog logs/myhost.com80_rt.log rt_logTo configure response time logging for a virtual host, add the following line somewhere within the <VirtualHost> block:CustomLog logs/myhost.com8080_rt.log rt_logMake sure the response time log file name is different for the main server and each virtual host. Consider using the host and port from the ServerName directive be used to form the file name, such as host_port_rt.log. - Restart the Apache server:
[root@server ~]# apachectl -k restart - To confirm that the Response Time module was installed successfully, check that the response time log files configured via the CustomLog directive now exist.
- Enable the HTTP metrics, as described in Section 21.6.5, “Configuring HTTP Response Time Metrics”, so that JBoss ON checks for the response time metrics on the application server.
21.6.4. Installing Response Time Filters for Tomcat
Copy linkLink copied to clipboard!
- Download the Response Time packages for Tomcat from the JBoss ON UI.
- Click the Administration tab in the top menu.
- In the Configuration menu box on the left, select the Downloads item.

- Click the connector-rtfilter.zip link, and save the file.
- Unzip the Response Time connectors.
unzip connector-rtfilter.zipThe package contains two JAR files,commons-logging-version.jarandrhq-rtfilter-version.jar. Tomcat 5 servers use only thecommons-logging-version.jarfile, while Tomcat 6 servers require both files. - Copy the appropriate JAR files into the Tomcat configuration directory. The directory location depends on the Tomcat or JBoss instance (for embedded Tomcat) being modified.For example, on a standalone Tomcat 5.5:
cp commons-logging-version.jar /var/lib/tomcat5/server/lib/On Tomcat 6:cp rhq-rtfilter-version.jar /var/lib/tomcat6/lib/ cp commons-logging-version.jar /var/lib/tomcat6/lib/For example, on an embedded Tomcat instance:cp rhq-rtfilter-version.jar JBoss_install_dir/server/default/deploy/jboss-web.deployer/ cp commons-logging-version.jar JBoss_install_dir/server/default/deploy/jboss-web.deployer/ - Open the
web.xmlfile to add the filter definition. The exact location of the file depends on the server instance and whether it is a standalone or embedded server; several common locations are listed in Table 21.4, “web.xml Configuration File Locations”. - Add either a <filter> or a <filter-mapping> entry to configuration the Response Time filter in the Tomcat server. Either a <filter> or a <filter-mapping> entry can be used, but not both.The most basic filter definition references simply the Response Time filter name and class in the <filter> element. This loads the response time filter with all of the default settings.
<filter>
        <filter-name>RhqRtFilter </filter-name>
        <filter-class>org.rhq.helpers.rtfilter.filter.RtFilter </filter-class>
</filter>
The filter definition can be expanded with user-defined configuration values by adding <init-param elements. This loads the response time filter with all of the default settings.<filter> <filter-name>RhqRtFilter </filter-name> <filter-class>org.rhq.helpers.rtfilter.filter.RtFilter </filter-class> <init-param> <description>Name of vhost mapping file. This properties file must be in the Tomcat process classpath.</description> <param-name>vHostMappingFile</param-name> <param-value>vhost-mappings.properties</param-value> </init-param> ... </filter>The available parameters are listed in Section 21.6.1, “Parameters for User-Defined <filter>s”.Alternatively, set a <filter-map> entry which gives the name of the response time filter and pattern to use to match the URL which will be monitored.<filter-mapping> <filter-name>RhqRtFilter </filter-name> <url-pattern>/* </url-pattern> </filter-mapping>NotePut the Response Time filter in front of any other configured filter so that the response time metrics will include all of the other response times, total, in the measurement. - Restart the Tomcat instance to load the new configuration.
- Enable the HTTP metrics, as described in Section 21.6.5, “Configuring HTTP Response Time Metrics”, so that JBoss ON checks for the response time metrics on the application server.
| Tomcat Version | Embedded Server Type | File Location |
|---|---|---|
| Tomcat 6 | Standalone Server | /var/lib/tomcat6/webapps/project/WEB-INF/web.xml |
| Tomcat 5 | Standalone Server | /var/lib/tomcat5/webapps/project/WEB-INF/web.xml |
| Tomcat 6 | EAP 5 | JBOSS_HOME/server/config/deployers/jbossweb.deployer/web.xml |
| Tomcat 6 | JBoss 4.2, JBoss EAP4 | JBOSS_HOME/server/config/deploy/jboss-web.deployer/conf/web.xml |
| Tomcat 5.5 | JBoss 4.0.2 | JBOSS_HOME/server/config/deploy/jbossweb-tomcat55.sar/conf/web.xml |
| Tomcat 5.0 | JBoss 3.2.6 | JBOSS_HOME/server/config/deploy/jbossweb-tomcat50.sar/conf/web.xml |
| Tomcat 4.1 | JBoss 3.2.3 | JBOSS_HOME/server/config/deploy/jbossweb-tomcat41.sar/web.xml |
21.6.5. Configuring HTTP Response Time Metrics
Copy linkLink copied to clipboard!
Configuring response time metrics is in some respects analogous to configuring events. The JBoss ON agent polls certain log files kept by the web server to identify the performance times for different resources served by the web server.
- Install the response time filter for the web server.For Apache, simply install the filters; for Tomcat, there is additional configuration required to set up the filter entry in the
web.xmlfile.If necessary, set up the filter entry in theweb.xmlfile. See Section 21.6, “Setting up Response Time Monitoring for Apache, EWS/Tomcat, and JBoss EAP 5”. - Click the Inventory tab in the top menu.
- Select the Servers menu table on the left, and then navigate to the web application, and select the web application context for which to run the response time monitoring.

- Click the Connection Settings tab on the web application context resource, and scroll to the Response Time configuration section.
- Configure the response time properties for the web server. The agent has to know what log file the web server uses to record response time data.Optionally, the server can perform certain transformations on the collected data.
- The response times log records times for all resources the web server serves, including support files like CSS files and icons or background images. These resources can be excluded from the response time calculations in the Response Time Url Excludes field.
- The same page can be accessed with different parameters passed along in the URL. The Response Time Url Transforms field provides a regular expression that can be used to strip or substitute the passed parameters.

- Click the Save button.
- Click the Monitoring tab on the web server resource entry.
- Click the Schedules subtab.
- Select the HTTP Response Time metric. This metric is the calltime type.

- Click the Enable at the bottom of the list.