Search

21.2. Viewing Call Time Metrics

download PDF
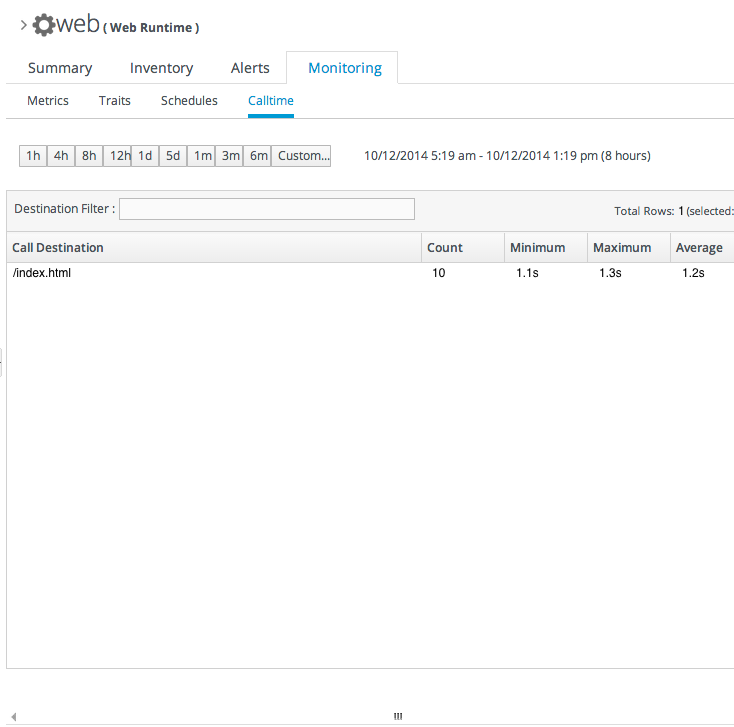
Both session bean resources and web server resources have an additional Monitoring subtab called Calltime. All of the call-time data or response time data ranges (minimum, maximum, and averages) are displayed for each URL resource or method. As new URLs or methods are accessed, they are dynamically added to the results table.

Figure 21.1. URL Metrics for a Web Server

URL Metrics for a Web Server
Red Hat logoGithubRedditYoutubeTwitter

Learn

Try, buy, & sell

Communities

About Red Hat Documentation

We help Red Hat users innovate and achieve their goals with our products and services with content they can trust.

Making open source more inclusive

Red Hat is committed to replacing problematic language in our code, documentation, and web properties. For more details, see the Red Hat Blog.

About Red Hat

We deliver hardened solutions that make it easier for enterprises to work across platforms and environments, from the core datacenter to the network edge.

© 2024 Red Hat, Inc.