5.3. Monitoring your application metrics
After you create applications in your project and deploy them, you can use the Topology view in the Developer perspective to see the metrics for your application.
Procedure
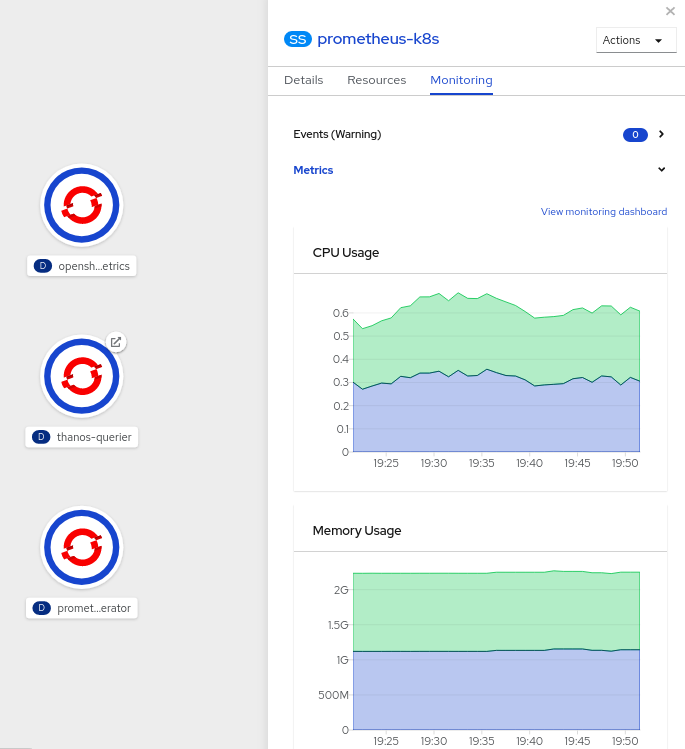
- In the Topology view, click the application to see the application details in the right panel.
Click the Monitoring tab to see the warning events for the application; graphs for CPU, memory, and bandwidth usage; and all the events for the application.
图 5.4. Monitoring application metrics

- Click any of the charts to go to the Metrics tab to see the detailed metrics for the application.
- Click View monitoring dashboard to see the monitoring dashboard for that application.