This documentation is for a release that is no longer maintained
See documentation for the latest supported version 3 or the latest supported version 4.5.2. Monitoring your project metrics
After you create applications in your project and deploy them, you can use the Developer perspective in the web console to see the metrics for your project.
Procedure
On the left navigation panel of the Developer perspective, click Monitoring to see the Dashboard, Metrics, and Events for your project.
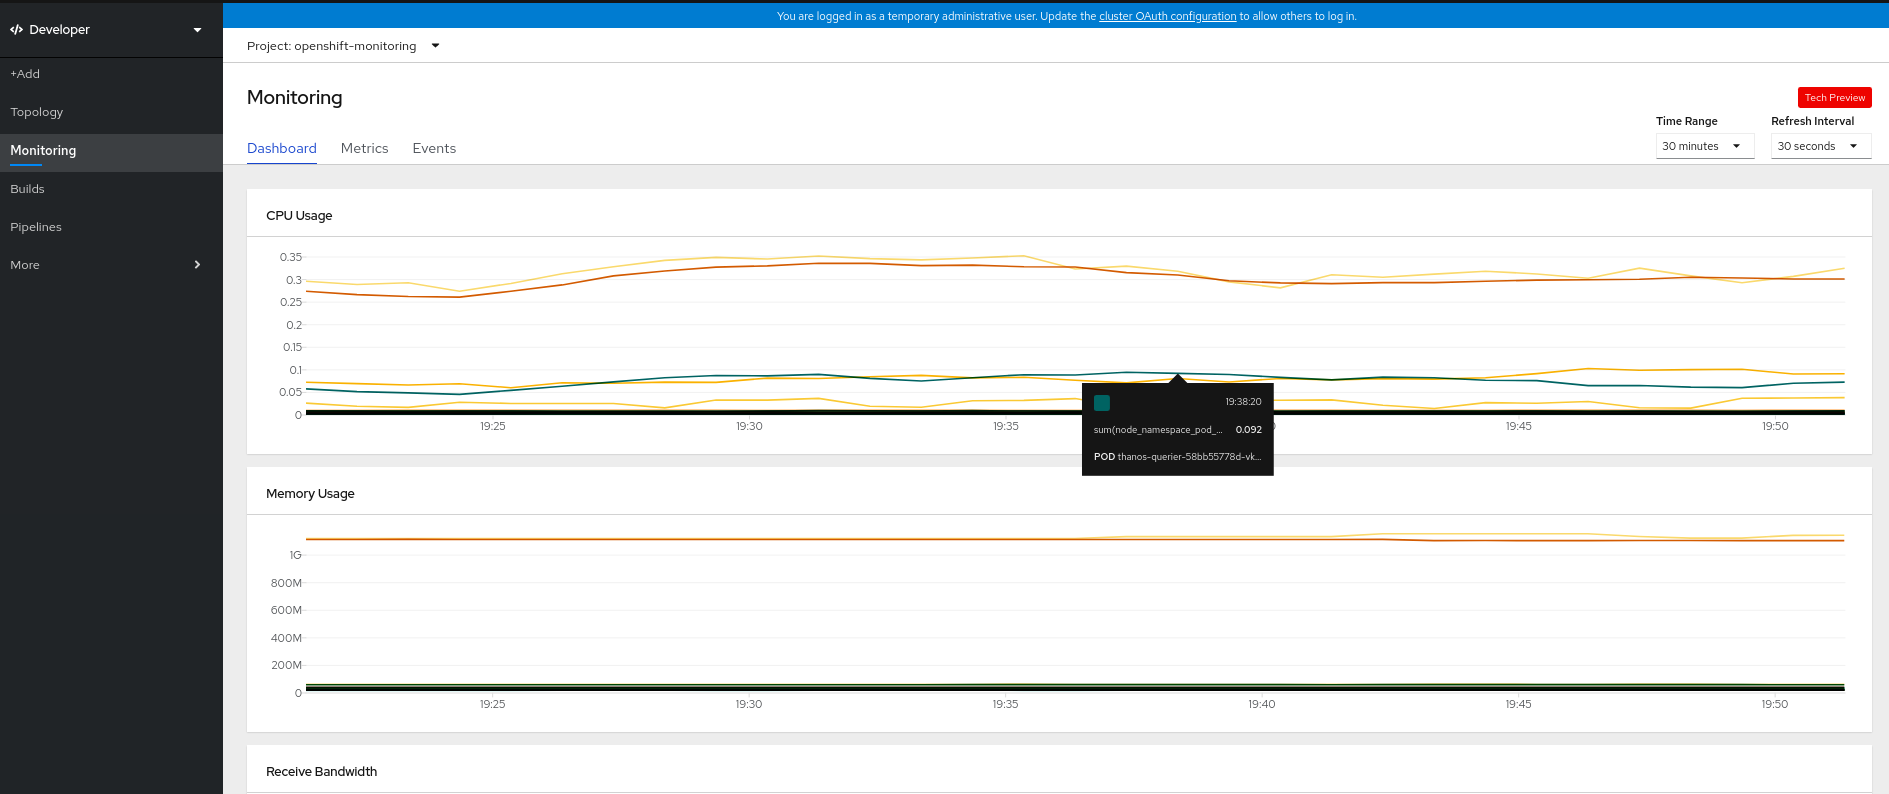
Use the Dashboard tab to see graphs depicting the CPU, memory, and bandwidth consumption and network related information, such as the rate of transmitted and received packets and the rate of dropped packets.
图 5.1. Monitoring dashboard
Use the following options to see further details:
- Select an option from the Time Range list to determine the time frame for the data being captured.
- Select an option from the Refresh Interval list to determine the time period after which the data is refreshed.
- Hover your cursor over the graphs to see specific details for your pod.
- Click on any of the graphs displayed to see the details for that particular metric in the Metrics page.
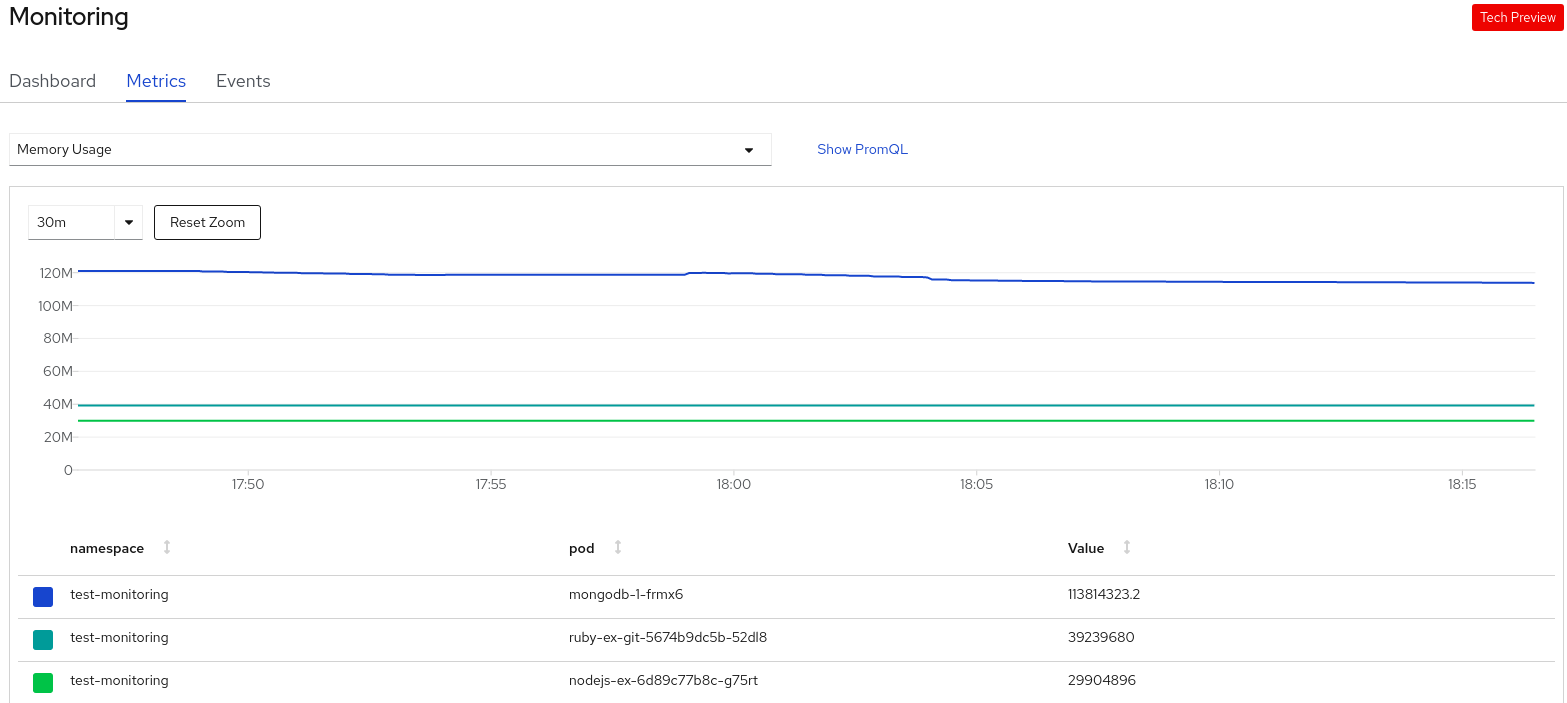
Use the Metrics tab to query for the required project metric.
图 5.2. Monitoring metrics
- In the Select Query list, select an option to filter the required details for your project. The filtered metrics for all the application pods in your project are displayed in the graph. The pods in your project are also listed below.
- From the list of pods, clear the colored square boxes to remove the metrics for specific pods to further filter your query result.
- Click Show PromQL to see the Prometheus query. You can further modify this query with the help of prompts to customize the query and filter the metrics you want to see for that namespace.
- Use the drop-down list to set a time range for the data being displayed. You can click Reset Zoom to reset it to the default time range.
- Optionally, in the Select Query list, select Custom Query to create a custom Prometheus query and filter relevant metrics.
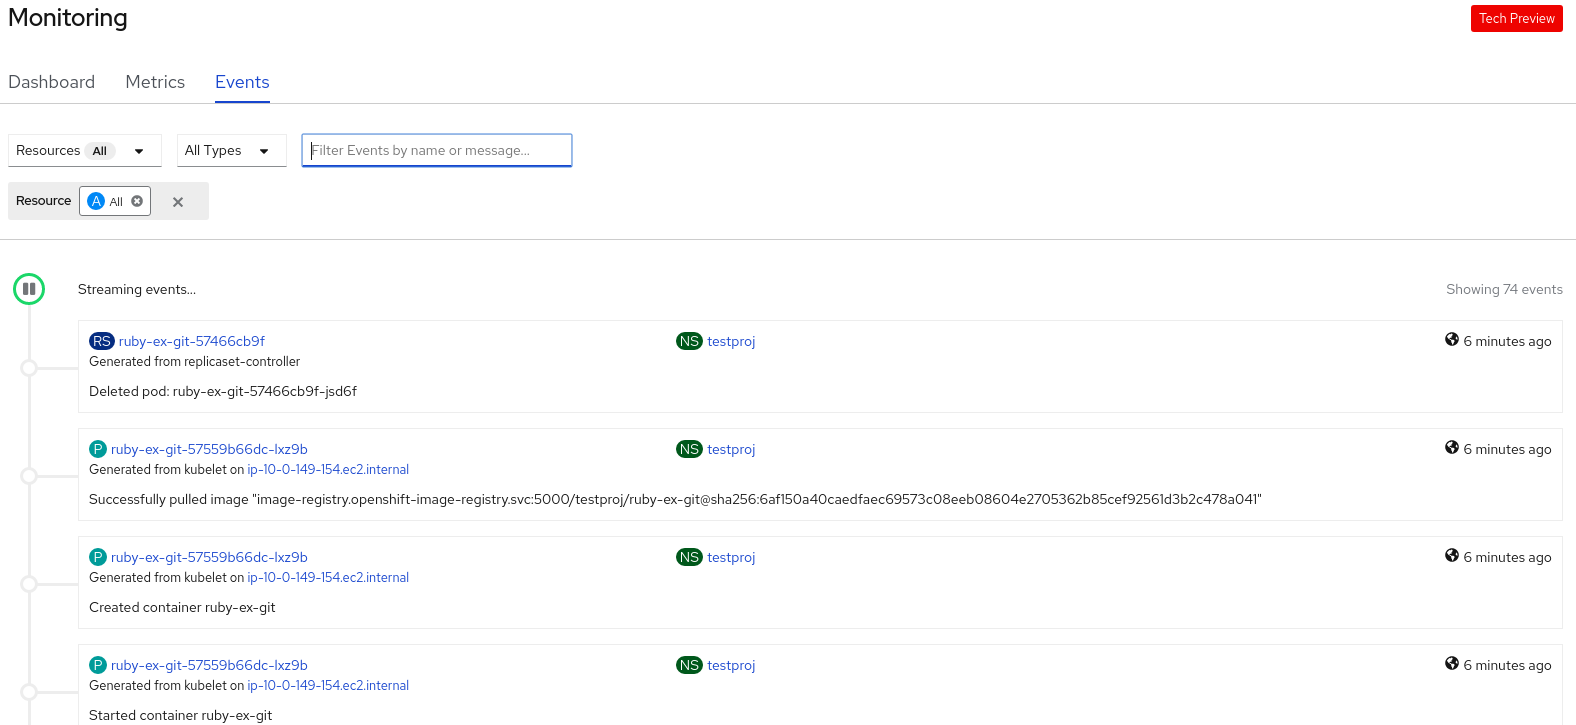
Use the Events tab to see the events for your project.
图 5.3. Monitoring events
You can filter the displayed events using the following options:
- In the Resources list, select a resource to see events for that resource.
- In the All Types list, select a type of event to see events relevant to that type.
- Search for specific events using the Filter events by names or messages field.


