2.4. Viewing application composition using the Topology view
The Topology view in the Developer perspective of the web console provides a visual representation of all the applications within a project, their build status, and the components and services associated with them.
2.4.1. Prerequisites
To view your applications in the Topology view and interact with them, ensure that:
- You have logged in to the web console.
- You are in the Developer perspective.
- You have the appropriate roles and permissions in a project to create applications and other workloads in OpenShift Container Platform.
- You have created and deployed an application on OpenShift Container Platform using the Developer perspective.
2.4.2. Viewing the topology of your application
You can navigate to the Topology view using the left navigation panel in the Developer perspective. After you create an application, you are directed automatically to the Topology view where you can see the status of the application pods, quickly access the application on a public URL, access the source code to modify it, and see the status of your last build. You can zoom in and out to see more details for a particular application.
A serverless application is visually indicated with the Knative symbol (
 ).
).
Serverless applications take some time to load and display on the Topology view. When you create a serverless application, it first creates a service resource and then a revision. After that it is deployed and displayed on the Topology view. If it is the only workload, you might be redirected to the Add page. Once the revision is deployed, the serverless application is displayed on the Topology view.
The status or phase of the Pod is indicated by different colors and tooltips as Running (
 ), Not Ready (
 ), Warning(
 ), Failed(
 ), Pending(
 ), Succeeded(
 ), Terminating(
 ), or Unknown(
 ). For more information about pod status, see the Kubernetes documentation.
After you create an application and an image is deployed, the status is shown as Pending. After the application is built, it is displayed as Running.
图 2.1. Application topology
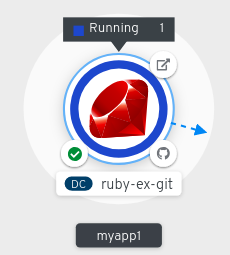
The application resource name is appended with indicators for the different types of resource objects as follows:
-
DC:
DeploymentConfig -
D:
Deployment -
SS:
StatefulSet -
DS:
DaemonSet
2.4.3. Interacting with the application and the components
The Topology view in the Developer perspective of the web console provides the following options to interact with the application and the components:
-
Click Open URL (
 ) to see your application exposed by the route on a public URL.
Click Edit Source code to access your source code and modify it.
注意This feature is available only when you create applications using the From Git, From Catalog, and the From Dockerfile options.
-
Hover your cursor over the lower left icon on the Pod to see the name of the latest build and its status. The status of the application build is indicated as New (
 ), Pending (
 ), Running (
 ), Completed (
 ), Failed (
 ), and Canceled (
 ).
).
- Use the Shortcuts menu listed on the upper-right of the screen to navigate components in the Topology view.
- Use the List View icon to see a list of all your applications and use the Topology View icon to switch back to the Topology view.
- Use the Find by name field to select the components with component names that match the query. Search results may appear outside of the visible area; click Fit to Screen from the lower-left toolbar to resize the Topology view to show all components.
Use the Display Options drop-down list to configure the Topology view of the various application groupings. The options are available depending on the types of components deployed in the project:
- Pod Count: Select to show the number of pods of a component in the component icon.
- Event Sources: Toggle to show or hide the event sources.
- Virtual Machines: Toggle to show or hide the virtual machines.
- Labels: Toggle to show or hide the component labels.
- Application Groupings: Clear to condense the application groups into cards with an overview of an application group and alerts associated with it.
- Helm Releases: Clear to condense the components deployed as Helm Release into cards with an overview of a given release.
- Knative Services: Clear to condense the Knative Service components into cards with an overview of a given component.
- Operator Groupings Clear to condense the components deployed with an Operator into cards with an overview of the given group.
The status or phase of the pod is indicated by different colors and tooltips as:
-
Running (
 ): The pod is bound to a node and all of the containers are created. At least one container is still running or is in the process of starting or restarting.
-
Not Ready (
 ): The pods which are running multiple containers, not all containers are ready.
-
Warning(
 ): Containers in pods are being terminated, however termination did not succeed. Some containers may be other states.
-
Failed(
 ): All containers in the pod terminated but least one container has terminated in failure. That is, the container either exited with non-zero status or was terminated by the system.
-
Pending(
 ): The pod is accepted by the Kubernetes cluster, but one or more of the containers has not been set up and made ready to run. This includes time a pod spends waiting to be scheduled as well as the time spent downloading container images over the network.
-
Succeeded(
 ): All containers in the pod terminated successfully and will not be restarted.
-
Terminating(
 ): When a pod is being deleted, it is shown as Terminating by some kubectl commands. Terminating status is not one of the pod phases. A pod is granted a graceful termination period, which defaults to 30 seconds.
-
Unknown(
 ): The state of the pod could not be obtained. This phase typically occurs due to an error in communicating with the node where the pod should be running.
-
Running (
2.4.4. Scaling application pods and checking builds and routes
The Topology view provides the details of the deployed components in the Overview panel. You can use the Overview and Resources tabs to scale the application pods, check build status, services, and routes as follows:
Click on the component node to see the Overview panel to the right. Use the Overview tab to:
- Scale your pods using the up and down arrows to increase or decrease the number of instances of the application manually. For serverless applications, the pods are automatically scaled down to zero when idle and scaled up depending on the channel traffic.
- Check the Labels, Annotations, and Status of the application.
Click the Resources tab to:
- See the list of all the pods, view their status, access logs, and click on the pod to see the pod details.
- See the builds, their status, access logs, and start a new build if needed.
- See the services and routes used by the component.
For serverless applications, the Resources tab provides information on the revision, routes, and the configurations used for that component.
2.4.5. Grouping multiple components within an application
You can use the Add page to add multiple components or services to your project and use the Topology page to group applications and resources within an application group. The following procedure adds a MongoDB database service to an existing application with a Node.js component.
Prerequisites
- Ensure that you have created and deployed a Node.js application on OpenShift Container Platform using the Developer perspective.
Procedure
Create and deploy the MongoDB service to your project as follows:
- In the Developer perspective, navigate to the Add view and select the Database option to see the Developer Catalog, which has multiple options that you can add as components or services to your application.
- Click on the MongoDB option to see the details for the service.
- Click Instantiate Template to see an automatically populated template with details for the MongoDB service, and click Create to create the service.
- On the left navigation panel, click Topology to see the MongoDB service deployed in your project.
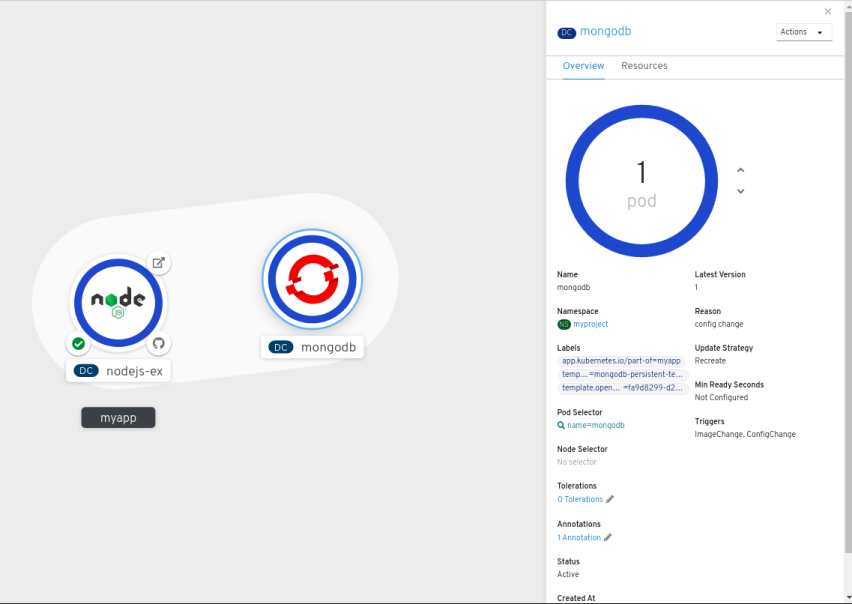
- To add the MongoDB service to the existing application group, select the mongodb pod and drag it to the application; the MongoDB service is added to the existing application group.
Dragging a component and adding it to an application group automatically adds the required labels to the component. Click on the MongoDB service node to see the label
app.kubernetes.io/part-of=myappadded to the Labels section in the Overview Panel.图 2.2. Application grouping
Alternatively, you can also add the component to an application as follows:
- To add the MongoDB service to your application, click on the mongodb pod to see the Overview panel to the right.
- Click the Actions drop-down menu on the upper right of the panel and select Edit Application Grouping.
- In the Edit Application Grouping dialog box, click the Select an Application drop-down list, and select the appropriate application group.
- Click Save to see the MongoDB service added to the application group.
You can remove a component from an application group by selecting the component and using Shift+ drag to drag it out of the application group.
2.4.6. Connecting components within an application and across applications
In addition to grouping multiple components within an application, you can also use the Topology view to connect components with each other. You can either use a binding connector or a visual one to connect components.
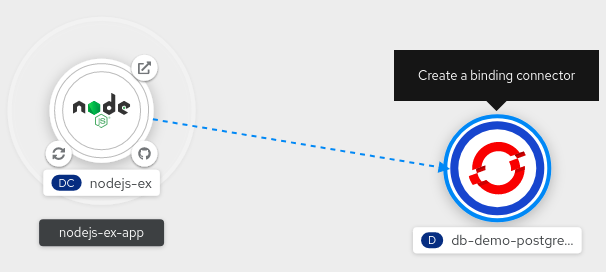
A binding connection between the components can be established only if the target node is an Operator-backed service. This is indicated by the Create a binding connector tool-tip which appears when you drag an arrow to such a target node. When an application is connected to a service using a binding connector a service binding request is created. Then, the Service Binding Operator controller uses an intermediate secret to inject the necessary binding data into the application deployment as environment variables. After the request is successful, the application is redeployed establishing an interaction between the connected components.
A visual connector establishes only a visual connection between the components, depicting an intent to connect. No interaction between the components is established. If the target node is not an Operator-backed service the Create a visual connector tool-tip is displayed when you drag an arrow to a target node.
2.4.6.1. Creating a visual connection between components
You can depict an intent to connect application components using the visual connector.
This procedure walks through an example of creating a visual connection between a MongoDB service and a Node.js application.
Prerequisites
- Ensure that you have created and deployed a Node.js application using the Developer perspective.
- Ensure that you have created and deployed a MongoDB service using the Developer perspective.
Procedure
Hover over the MongoDB service to see a dangling arrow on the node.
图 2.3. Connector
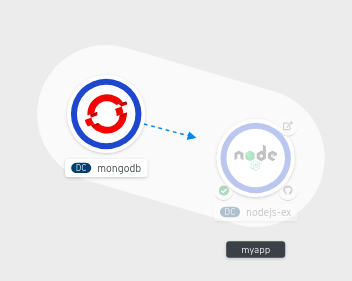
- Click and drag the arrow towards the Node.js component to connect the MongoDB service with it.
-
Click on the MongoDB service to see the Overview Panel. In the Annotations section, click the edit icon to see the Key =
app.openshift.io/connects-toand Value =[{"apiVersion":"apps.openshift.io/v1","kind":"DeploymentConfig","name":"nodejs-ex"}]annotation added to the service.
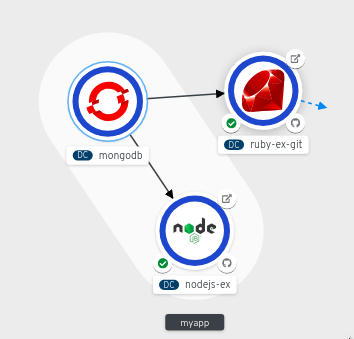
Similarly you can create other applications and components and establish connections between them.
图 2.4. Connecting multiple applications
2.4.6.2. Creating a binding connection between components
Service Binding is a Technology Preview feature only. Technology Preview features are not supported with Red Hat production service level agreements (SLAs) and might not be functionally complete. Red Hat does not recommend using them in production. These features provide early access to upcoming product features, enabling customers to test functionality and provide feedback during the development process.
For more information about the support scope of Red Hat Technology Preview features, see https://access.redhat.com/support/offerings/techpreview/.
Currently, a few specific Operators like the etcd and the PostgresSQL Database Operator’s service instances are bindable.
You can establish a binding connection with Operator-backed components.
This procedure walks through an example of creating a binding connection between a PostgreSQL Database service and a Node.js application. To create a binding connection with a service that is backed by the PostgreSQL Database Operator, you must first add the Red Hat-provided PostgreSQL Database Operator to the OperatorHub using a CatalogSource resource, and then install the Operator. The PostreSQL Database Operator then creates and manages the Database resource, which exposes the binding information in secrets, config maps, status, and spec attributes.
Prerequisites
- Ensure that you have created and deployed a Node.js application using the Developer perspective.
- Ensure that you have installed the Service Binding Operator from OperatorHub.
Procedure
Create a
CatalogSourceresource that adds the PostgresSQL Database Operator provided by Red Hat to the OperatorHub.- In the +Add view, click the YAML option to see the Import YAML screen.
Add the following YAML file to apply the
CatalogSourceresource:apiVersion: operators.coreos.com/v1alpha1 kind: CatalogSource metadata: name: sample-db-operators namespace: openshift-marketplace spec: sourceType: grpc image: quay.io/redhat-developer/sample-db-operators-olm:v1 displayName: Sample DB OLM registry updateStrategy: registryPoll: interval: 30m-
Click Create to create the
CatalogSourceresource in your cluster.
Install the Red Hat-provided PostgreSQL Database Operator:
-
In the Administrator perspective of the console, navigate to Operators
OperatorHub. - In the Database category, select the PostgreSQL Database Operator and install it.
-
In the Administrator perspective of the console, navigate to Operators
Create a database (DB) instance for the application:
-
Switch to the Developer perspective and ensure that you are in the appropriate project, for example,
test-project. - In the +Add view, click the YAML option to see the Import YAML screen.
Add the service instance YAML in the editor and click Create to deploy the service. Following is an example of what the service YAML will look like:
apiVersion: postgresql.baiju.dev/v1alpha1
kind: Database
metadata:
 name: db-demo
spec:
 image: docker.io/postgres
 imageName: postgres
 dbName: db-demo
A DB instance is now deployed in the Topology view.
-
Switch to the Developer perspective and ensure that you are in the appropriate project, for example,
- In the Topology view, hover over the Node.js component to see a dangling arrow on the node.
Click and drag the arrow towards the db-demo-postgresql service to make a binding connection with the Node.js application. A service binding request is created and the Service Binding Operator controller injects the DB connection information into the application deployment as environment variables. After the request is successful, the application is redeployed and the connection is established.
图 2.5. Binding connector
2.4.7. Labels and annotations used for the Topology view
The Topology view uses the following labels and annotations:
- Icon displayed in the node
-
Icons in the node are defined by looking for matching icons using the
app.openshift.io/runtimelabel, followed by theapp.kubernetes.io/namelabel. This matching is done using a predefined set of icons. - Link to the source code editor or the source
-
The
app.openshift.io/vcs-uriannotation is used to create links to the source code editor. - Node Connector
-
The
app.openshift.io/connects-toannotation is used to connect the nodes. - App grouping
-
The
app.kubernetes.io/part-of=<appname>label is used to group the applications, services, and components.
For detailed information on the labels and annotations OpenShift Container Platform applications must use, see Guidelines for labels and annotations for OpenShift applications.