27.7. Checking cluster resource availability and utilization
OpenShift Container Platform provides a comprehensive set of monitoring dashboards that help you understand the state of cluster components.
In the Administrator perspective, you can access dashboards for core OpenShift Container Platform components, including:
- etcd
- Kubernetes compute resources
- Kubernetes network resources
- Prometheus
- Dashboards relating to cluster and node performance
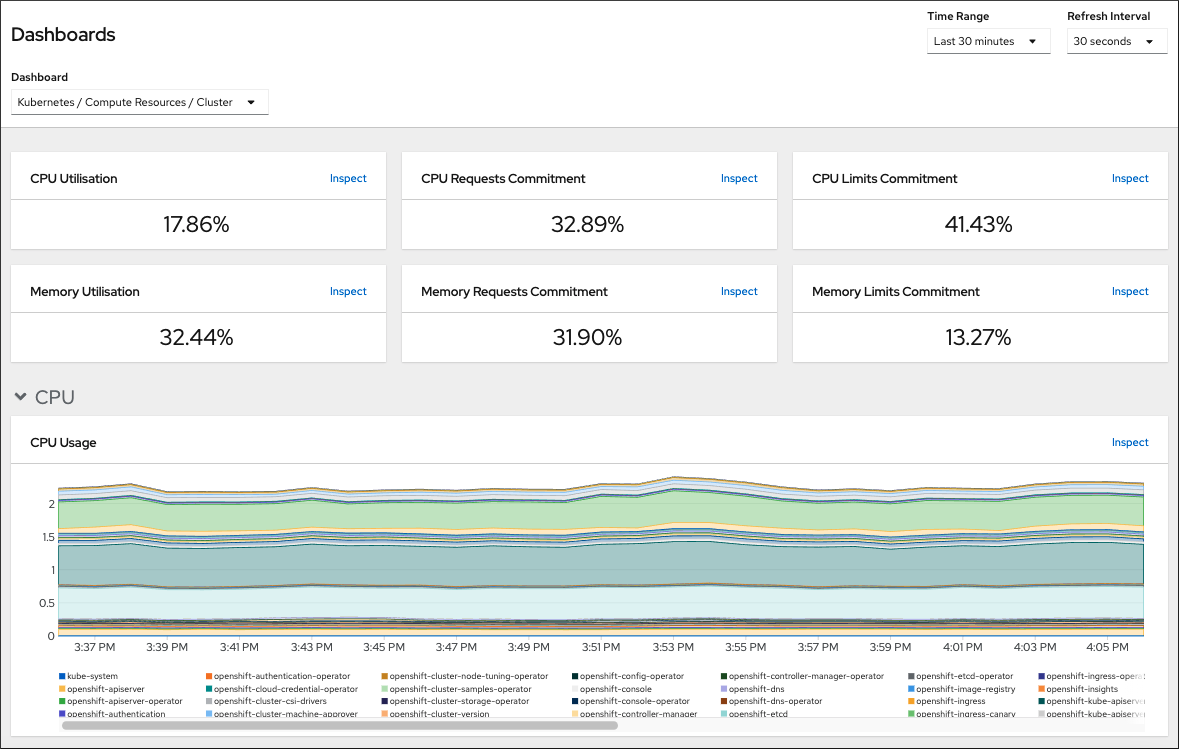
Figure 27.1. Example compute resources dashboard
Conditions préalables
-
Vous avez accès au cluster en tant qu'utilisateur ayant le rôle
cluster-admin.
Procédure
-
In the Administrator perspective in the OpenShift Container Platform web console, navigate to Observe
Dashboards. - Choose a dashboard in the Dashboard list. Some dashboards, such as the etcd dashboard, produce additional sub-menus when selected.
Optional: Select a time range for the graphs in the Time Range list.
- Select a pre-defined time period.
Set a custom time range by selecting Custom time range in the Time Range list.
- Input or select the From and To dates and times.
- Click Save to save the custom time range.
- Optional: Select a Refresh Interval.
- Hover over each of the graphs within a dashboard to display detailed information about specific items.