このコンテンツは選択した言語では利用できません。
Chapter 6. Working with nodes
6.1. Viewing and listing the nodes in your OpenShift Container Platform cluster
You can list all the nodes in your cluster to obtain information such as status, age, memory usage, and details about the nodes.
When you perform node management operations, the CLI interacts with node objects that are representations of actual node hosts. The master uses the information from node objects to validate nodes with health checks.
6.1.1. About listing all the nodes in a cluster
You can get detailed information about the nodes in the cluster, which can help you understand the state of the nodes in your cluster.
The following command lists all nodes:
$ oc get nodesThe following example is a cluster with healthy nodes:
$ oc get nodesExample output
NAME STATUS ROLES AGE VERSION master.example.com Ready master 7h v1.29.4 node1.example.com Ready worker 7h v1.29.4 node2.example.com Ready worker 7h v1.29.4The following example is a cluster with one unhealthy node:
$ oc get nodesExample output
NAME STATUS ROLES AGE VERSION master.example.com Ready master 7h v1.29.4 node1.example.com NotReady,SchedulingDisabled worker 7h v1.29.4 node2.example.com Ready worker 7h v1.29.4The conditions that trigger a
NotReadystatus are shown later in this section.The
-o wideoption provides additional information on nodes.$ oc get nodes -o wideExample output
NAME STATUS ROLES AGE VERSION INTERNAL-IP EXTERNAL-IP OS-IMAGE KERNEL-VERSION CONTAINER-RUNTIME master.example.com Ready master 171m v1.29.4 10.0.129.108 <none> Red Hat Enterprise Linux CoreOS 48.83.202103210901-0 (Ootpa) 4.18.0-240.15.1.el8_3.x86_64 cri-o://1.29.4-30.rhaos4.10.gitf2f339d.el8-dev node1.example.com Ready worker 72m v1.29.4 10.0.129.222 <none> Red Hat Enterprise Linux CoreOS 48.83.202103210901-0 (Ootpa) 4.18.0-240.15.1.el8_3.x86_64 cri-o://1.29.4-30.rhaos4.10.gitf2f339d.el8-dev node2.example.com Ready worker 164m v1.29.4 10.0.142.150 <none> Red Hat Enterprise Linux CoreOS 48.83.202103210901-0 (Ootpa) 4.18.0-240.15.1.el8_3.x86_64 cri-o://1.29.4-30.rhaos4.10.gitf2f339d.el8-devThe following command lists information about a single node:
$ oc get node <node>For example:
$ oc get node node1.example.comExample output
NAME STATUS ROLES AGE VERSION node1.example.com Ready worker 7h v1.29.4The following command provides more detailed information about a specific node, including the reason for the current condition:
$ oc describe node <node>For example:
$ oc describe node node1.example.comNoteThe following example contains some values that are specific to OpenShift Container Platform on AWS.
Example output
Name: node1.example.com Roles: worker Labels: kubernetes.io/os=linux kubernetes.io/hostname=ip-10-0-131-14 kubernetes.io/arch=amd64 node-role.kubernetes.io/worker= node.kubernetes.io/instance-type=m4.large node.openshift.io/os_id=rhcos node.openshift.io/os_version=4.5 region=east topology.kubernetes.io/region=us-east-1 topology.kubernetes.io/zone=us-east-1a Annotations: cluster.k8s.io/machine: openshift-machine-api/ahardin-worker-us-east-2a-q5dzc machineconfiguration.openshift.io/currentConfig: worker-309c228e8b3a92e2235edd544c62fea8 machineconfiguration.openshift.io/desiredConfig: worker-309c228e8b3a92e2235edd544c62fea8 machineconfiguration.openshift.io/state: Done volumes.kubernetes.io/controller-managed-attach-detach: true CreationTimestamp: Wed, 13 Feb 2019 11:05:57 -0500 Taints: <none> Unschedulable: false Conditions: Type Status LastHeartbeatTime LastTransitionTime Reason Message ---- ------ ----------------- ------------------ ------ ------- OutOfDisk False Wed, 13 Feb 2019 15:09:42 -0500 Wed, 13 Feb 2019 11:05:57 -0500 KubeletHasSufficientDisk kubelet has sufficient disk space available MemoryPressure False Wed, 13 Feb 2019 15:09:42 -0500 Wed, 13 Feb 2019 11:05:57 -0500 KubeletHasSufficientMemory kubelet has sufficient memory available DiskPressure False Wed, 13 Feb 2019 15:09:42 -0500 Wed, 13 Feb 2019 11:05:57 -0500 KubeletHasNoDiskPressure kubelet has no disk pressure PIDPressure False Wed, 13 Feb 2019 15:09:42 -0500 Wed, 13 Feb 2019 11:05:57 -0500 KubeletHasSufficientPID kubelet has sufficient PID available Ready True Wed, 13 Feb 2019 15:09:42 -0500 Wed, 13 Feb 2019 11:07:09 -0500 KubeletReady kubelet is posting ready status Addresses: InternalIP: 10.0.140.16 InternalDNS: ip-10-0-140-16.us-east-2.compute.internal Hostname: ip-10-0-140-16.us-east-2.compute.internal Capacity: attachable-volumes-aws-ebs: 39 cpu: 2 hugepages-1Gi: 0 hugepages-2Mi: 0 memory: 8172516Ki pods: 250 Allocatable: attachable-volumes-aws-ebs: 39 cpu: 1500m hugepages-1Gi: 0 hugepages-2Mi: 0 memory: 7558116Ki pods: 250 System Info: Machine ID: 63787c9534c24fde9a0cde35c13f1f66 System UUID: EC22BF97-A006-4A58-6AF8-0A38DEEA122A Boot ID: f24ad37d-2594-46b4-8830-7f7555918325 Kernel Version: 3.10.0-957.5.1.el7.x86_64 OS Image: Red Hat Enterprise Linux CoreOS 410.8.20190520.0 (Ootpa) Operating System: linux Architecture: amd64 Container Runtime Version: cri-o://1.29.4-0.6.dev.rhaos4.3.git9ad059b.el8-rc2 Kubelet Version: v1.29.4 Kube-Proxy Version: v1.29.4 PodCIDR: 10.128.4.0/24 ProviderID: aws:///us-east-2a/i-04e87b31dc6b3e171 Non-terminated Pods: (12 in total) Namespace Name CPU Requests CPU Limits Memory Requests Memory Limits --------- ---- ------------ ---------- --------------- ------------- openshift-cluster-node-tuning-operator tuned-hdl5q 0 (0%) 0 (0%) 0 (0%) 0 (0%) openshift-dns dns-default-l69zr 0 (0%) 0 (0%) 0 (0%) 0 (0%) openshift-image-registry node-ca-9hmcg 0 (0%) 0 (0%) 0 (0%) 0 (0%) openshift-ingress router-default-76455c45c-c5ptv 0 (0%) 0 (0%) 0 (0%) 0 (0%) openshift-machine-config-operator machine-config-daemon-cvqw9 20m (1%) 0 (0%) 50Mi (0%) 0 (0%) openshift-marketplace community-operators-f67fh 0 (0%) 0 (0%) 0 (0%) 0 (0%) openshift-monitoring alertmanager-main-0 50m (3%) 50m (3%) 210Mi (2%) 10Mi (0%) openshift-monitoring node-exporter-l7q8d 10m (0%) 20m (1%) 20Mi (0%) 40Mi (0%) openshift-monitoring prometheus-adapter-75d769c874-hvb85 0 (0%) 0 (0%) 0 (0%) 0 (0%) openshift-multus multus-kw8w5 0 (0%) 0 (0%) 0 (0%) 0 (0%) openshift-sdn ovs-t4dsn 100m (6%) 0 (0%) 300Mi (4%) 0 (0%) openshift-sdn sdn-g79hg 100m (6%) 0 (0%) 200Mi (2%) 0 (0%) Allocated resources: (Total limits may be over 100 percent, i.e., overcommitted.) Resource Requests Limits -------- -------- ------ cpu 380m (25%) 270m (18%) memory 880Mi (11%) 250Mi (3%) attachable-volumes-aws-ebs 0 0 Events: Type Reason Age From Message ---- ------ ---- ---- ------- Normal NodeHasSufficientPID 6d (x5 over 6d) kubelet, m01.example.com Node m01.example.com status is now: NodeHasSufficientPID Normal NodeAllocatableEnforced 6d kubelet, m01.example.com Updated Node Allocatable limit across pods Normal NodeHasSufficientMemory 6d (x6 over 6d) kubelet, m01.example.com Node m01.example.com status is now: NodeHasSufficientMemory Normal NodeHasNoDiskPressure 6d (x6 over 6d) kubelet, m01.example.com Node m01.example.com status is now: NodeHasNoDiskPressure Normal NodeHasSufficientDisk 6d (x6 over 6d) kubelet, m01.example.com Node m01.example.com status is now: NodeHasSufficientDisk Normal NodeHasSufficientPID 6d kubelet, m01.example.com Node m01.example.com status is now: NodeHasSufficientPID Normal Starting 6d kubelet, m01.example.com Starting kubelet. #...where:
Names- Specifies the name of the node.
Roles-
Specifies the role of the node, either
masterorworker. Labels- Specifies the labels applied to the node.
Annotations- Specifies the annotations applied to the node.
Taints- Specifies the taints applied to the node.
Conditions-
Specifies the node conditions and status. The
conditionsstanza lists theReady,PIDPressure,MemoryPressure,DiskPressureandOutOfDiskstatus. These condition are described later in this section. Addresses- Specifies the IP address and hostname of the node.
Capacity- Specifies the pod resources and allocatable resources.
Information- Specifies information about the node host.
Non-terminated Pods- Specifies the pods on the node.
Events- Specifies the events reported by the node.
NoteThe control plane label is not automatically added to newly created or updated master nodes. If you want to use the control plane label for your nodes, you can manually configure the label. For more information, see Understanding how to update labels on nodes in the Additional resources section.
Among the information shown for nodes, the following node conditions appear in the output of the commands shown in this section:
| Condition | Description |
|---|---|
|
|
If |
|
|
If |
|
|
If |
|
|
If |
|
|
If |
|
|
If |
|
|
If |
|
| Pods cannot be scheduled for placement on the node. |
6.1.2. Listing pods on a node in your cluster
You can list all of the pods on a node by using the oc get pods command along with specific flags. This command shows the number of pods on that node, the state of the pods, number of pod restarts, and the age of the pods.
Procedure
To list all or selected pods on selected nodes:
$ oc get pod --selector=<nodeSelector>$ oc get pod --selector=kubernetes.io/osOr:
$ oc get pod -l=<nodeSelector>$ oc get pod -l kubernetes.io/os=linuxTo list all pods on a specific node, including terminated pods:
$ oc get pod --all-namespaces --field-selector=spec.nodeName=<nodename>
6.1.3. Viewing memory and CPU usage statistics on your nodes
You can display usage statistics about nodes, including CPU, memory, and storage consumption. These statistics can help you ensure your cluster is running efficiently.
Prerequisites
-
You must have
cluster-readerpermission to view the usage statistics. - Metrics must be installed to view the usage statistics.
Procedure
To view the usage statistics:
$ oc adm top nodesExample output
NAME CPU(cores) CPU% MEMORY(bytes) MEMORY% ip-10-0-12-143.ec2.compute.internal 1503m 100% 4533Mi 61% ip-10-0-132-16.ec2.compute.internal 76m 5% 1391Mi 18% ip-10-0-140-137.ec2.compute.internal 398m 26% 2473Mi 33% ip-10-0-142-44.ec2.compute.internal 656m 43% 6119Mi 82% ip-10-0-146-165.ec2.compute.internal 188m 12% 3367Mi 45% ip-10-0-19-62.ec2.compute.internal 896m 59% 5754Mi 77% ip-10-0-44-193.ec2.compute.internal 632m 42% 5349Mi 72%To view the usage statistics for nodes with labels:
$ oc adm top node --selector=''You must choose the selector (label query) to filter on. Supports
=,==, and!=.
6.2. Working with nodes
As an administrator, you can perform several tasks to make your clusters more efficient.
6.2.1. Evacuating pods on nodes
You can remove, or evacuate, pods from a given node or nodes. Evacuating pods allows you to migrate all or selected pods to other nodes.
You can evacuate only pods that are backed by a replication controller. The replication controller creates new pods on other nodes and removes the existing pods from the specified node(s).
Bare pods, meaning those not backed by a replication controller, are unaffected by default. You can evacuate a subset of pods by specifying a pod selector. Because pod selectors are based on labels, all of the pods with the specified label are evacuated.
Procedure
Mark the nodes as unschedulable before performing the pod evacuation.
Mark the node as unschedulable by running the following command:
$ oc adm cordon <node1>Example output
node/<node1> cordonedCheck that the node status is
Ready,SchedulingDisabledby running the following command:$ oc get node <node1>Example output
NAME STATUS ROLES AGE VERSION <node1> Ready,SchedulingDisabled worker 1d v1.29.4
Evacuate the pods by using one of the following methods:
Evacuate all or selected pods on one or more nodes by running the
oc adm draincommand:$ oc adm drain <node1> <node2> [--pod-selector=<pod_selector>]Force the deletion of bare pods by using the
--forceoption with theoc adm draincommand. When set totrue, deletion continues even if there are pods not managed by a replication controller, replica set, job, daemon set, or stateful set.$ oc adm drain <node1> <node2> --force=trueSet a period of time in seconds for each pod to terminate gracefully by using the
--grace-periodoption with theoc adm draincommand. If negative, the default value specified in the pod will be used:$ oc adm drain <node1> <node2> --grace-period=-1Ignore pods managed by daemon sets by using the
--ignore-daemonsets=trueoption with theoc adm draincommand:$ oc adm drain <node1> <node2> --ignore-daemonsets=trueSet the length of time to wait before giving up using the
--timeoutoption with theoc adm draincommand. A value of0sets an infinite length of time.$ oc adm drain <node1> <node2> --timeout=5sDelete pods even if there are pods using
emptyDirvolumes by setting the--delete-emptydir-data=trueoption with theoc adm draincommand. Local data is deleted when the node is drained.$ oc adm drain <node1> <node2> --delete-emptydir-data=trueList objects that would be migrated without actually performing the evacuation, by using the
--dry-run=trueoption with theoc adm draincommand:$ oc adm drain <node1> <node2> --dry-run=trueInstead of specifying specific node names (for example,
<node1> <node2>), you can use the--selector=<node_selector>option with theoc adm draincommand to evacuate pods on selected nodes.
Mark the node as schedulable when done by using the following command.
$ oc adm uncordon <node1>
6.2.2. Understanding how to update labels on nodes
You can update any label on a node in order to adapt your cluster to evolving needs.
Node labels are not persisted after a node is deleted even if the node is backed up by a Machine.
Any change to a MachineSet object is not applied to existing machines owned by the compute machine set. For example, labels edited or added to an existing MachineSet object are not propagated to existing machines and nodes associated with the compute machine set.
The following command adds or updates labels on a node:
$ oc label node <node> <key_1>=<value_1> ... <key_n>=<value_n>For example:
$ oc label nodes webconsole-7f7f6 unhealthy=trueTipYou can alternatively apply the following YAML to apply the label:
kind: Node apiVersion: v1 metadata: name: webconsole-7f7f6 labels: unhealthy: 'true' #...The following command updates all pods in the namespace:
$ oc label pods --all <key_1>=<value_1>For example:
$ oc label pods --all status=unhealthy
In OpenShift Container Platform 4.12 and later, newly installed clusters include both the node-role.kubernetes.io/control-plane and node-role.kubernetes.io/master labels on control plane nodes by default.
In OpenShift Container Platform versions earlier than 4.12, the node-role.kubernetes.io/control-plane label is not added by default. Therefore, you must manually add the node-role.kubernetes.io/control-plane label to control plane nodes in clusters upgraded from earlier versions.
6.2.3. Understanding how to mark nodes as unschedulable or schedulable
You can mark a node as unschedulable in order to block any new pods from being scheduled on the node.
When you mark a node as unschedulable, existing pods on the node are not affected.
By default, healthy nodes with a Ready status are marked as schedulable, which means that you can place new pods on the node.
The following command marks a node or nodes as unschedulable:
Example output
$ oc adm cordon <node>For example:
$ oc adm cordon node1.example.comExample output
node/node1.example.com cordoned NAME LABELS STATUS node1.example.com kubernetes.io/hostname=node1.example.com Ready,SchedulingDisabledThe following command marks a currently unschedulable node or nodes as schedulable:
$ oc adm uncordon <node1>Instead of specifying specific node names (for example,
<node>), you can use the--selector=<node_selector>option to mark selected nodes as schedulable or unschedulable.
6.2.4. Handling errors in single-node OpenShift clusters when the node reboots without draining application pods
You can remove failed pods from a node by using the --field-selector status.phase=Failed flag with the oc delete pods command.
In single-node OpenShift clusters and in OpenShift Container Platform clusters in general, a situation can arise where a node reboot occurs without first draining the node. This can occur where an application pod requesting devices fails with the UnexpectedAdmissionError error. Deployment, ReplicaSet, or DaemonSet errors are reported because the application pods that require those devices start before the pod serving those devices. You cannot control the order of pod restarts.
While this behavior is to be expected, it can cause a pod to remain on the cluster even though it has failed to deploy successfully. The pod continues to report UnexpectedAdmissionError. This issue is mitigated by the fact that application pods are typically included in a Deployment, ReplicaSet, or DaemonSet. If a pod is in this error state, it is of little concern because another instance should be running. Belonging to a Deployment, ReplicaSet, or DaemonSet guarantees the successful creation and execution of subsequent pods and ensures the successful deployment of the application.
There is ongoing work upstream to ensure that such pods are gracefully terminated. Until that work is resolved, run the following command for a single-node OpenShift cluster to remove the failed pods:
$ oc delete pods --field-selector status.phase=Failed -n <POD_NAMESPACE>The option to drain the node is unavailable for single-node OpenShift clusters.
6.2.5. Deleting nodes from a cluster
You can delete a node from a OpenShift Container Platform cluster by scaling down the appropriate MachineSet object.
When a cluster is integrated with a cloud provider, you must delete the corresponding machine to delete a node. Do not try to use the oc delete node command for this task.
When you delete a node by using the CLI, the node object is deleted in Kubernetes, but the pods that exist on the node are not deleted. Any bare pods that are not backed by a replication controller become inaccessible to OpenShift Container Platform. Pods backed by replication controllers are rescheduled to other available nodes. You must delete local manifest pods.
If you are running cluster on bare metal, you cannot delete a node by editing MachineSet objects. Compute machine sets are only available when a cluster is integrated with a cloud provider. Instead you must unschedule and drain the node before manually deleting it.
Procedure
View the compute machine sets that are in the cluster by running the following command:
$ oc get machinesets -n openshift-machine-apiThe compute machine sets are listed in the form of
<cluster-id>-worker-<aws-region-az>.Scale down the compute machine set by using one of the following methods:
Specify the number of replicas to scale down to by running the following command:
$ oc scale --replicas=2 machineset <machine-set-name> -n openshift-machine-apiEdit the compute machine set custom resource by running the following command:
$ oc edit machineset <machine-set-name> -n openshift-machine-apiExample output
apiVersion: machine.openshift.io/v1beta1 kind: MachineSet metadata: # ... name: <machine-set-name> namespace: openshift-machine-api # ... spec: replicas: 2 # ...where:
spec.replicas- Specifies the number of replicas to scale down to.
6.2.6. Deleting nodes from a bare metal cluster
You can delete a node from a OpenShift Container Platform cluster that does not use machine sets by using the oc delete node command and decommissioning the node.
When you delete a node using the CLI, the node object is deleted in Kubernetes, but the pods that exist on the node are not deleted. Any bare pods not backed by a replication controller become inaccessible to OpenShift Container Platform. Pods backed by replication controllers are rescheduled to other available nodes. You must delete local manifest pods.
The following procedure deletes a node from an OpenShift Container Platform cluster running on bare metal.
Procedure
Mark the node as unschedulable:
$ oc adm cordon <node_name>Drain all pods on the node:
$ oc adm drain <node_name> --force=trueThis step might fail if the node is offline or unresponsive. Even if the node does not respond, the node might still be running a workload that writes to shared storage. To avoid data corruption, power down the physical hardware before you proceed.
Delete the node from the cluster:
$ oc delete node <node_name>Although the node object is now deleted from the cluster, it can still rejoin the cluster after reboot or if the kubelet service is restarted. To permanently delete the node and all its data, you must decommission the node.
- If you powered down the physical hardware, turn it back on so that the node can rejoin the cluster.
6.3. Managing nodes
OpenShift Container Platform uses a KubeletConfig custom resource (CR) to manage the configuration of nodes. By creating an instance of a KubeletConfig object, a managed machine config is created to override setting on the node.
Logging in to remote machines for the purpose of changing their configuration is not supported.
6.3.1. Modifying nodes
To make configuration changes to a cluster, or machine pool, you must create a custom resource definition (CRD), or kubeletConfig object. OpenShift Container Platform uses the Machine Config Controller to watch for changes introduced through the CRD to apply the changes to the cluster.
Most Kubelet Configuration options can be set by the user. However, you cannot overwrite the following options:
- CgroupDriver
- ClusterDNS
- ClusterDomain
- StaticPodPath
If a single node contains more than 50 images, pod scheduling might be imbalanced across nodes. This is because the list of images on a node is shortened to 50 by default. You can disable the image limit by editing the KubeletConfig object and setting the value of nodeStatusMaxImages to -1.
Because the fields in a kubeletConfig object are passed directly to the kubelet from upstream Kubernetes, the validation of those fields is handled directly by the kubelet itself. Please refer to the relevant Kubernetes documentation for the valid values for these fields. Invalid values in the kubeletConfig object can render cluster nodes unusable.
Procedure
Obtain the label associated with the static CRD, Machine Config Pool, for the type of node you want to configure. Perform one of the following steps:
Check current labels of the desired machine config pool.
For example:
$ oc get machineconfigpool --show-labelsExample output
NAME CONFIG UPDATED UPDATING DEGRADED LABELS master rendered-master-e05b81f5ca4db1d249a1bf32f9ec24fd True False False operator.machineconfiguration.openshift.io/required-for-upgrade= worker rendered-worker-f50e78e1bc06d8e82327763145bfcf62 True False FalseAdd a custom label to the desired machine config pool.
For example:
$ oc label machineconfigpool worker custom-kubelet=enabled
Create a
kubeletconfigcustom resource (CR) for your configuration change, as demonstrated in the following sample configuration for acustom-configCR:apiVersion: machineconfiguration.openshift.io/v1 kind: KubeletConfig metadata: name: custom-config spec: machineConfigPoolSelector: matchLabels: custom-kubelet: enabled kubeletConfig: podsPerCore: 10 maxPods: 250 systemReserved: cpu: 2000m memory: 1Gi #...where:
name- Assign a name to CR.
custom-kubelet- Specify the label to apply the configuration change, this is the label you added to the machine config pool.
kubeletConfig- Specify the new value(s) you want to change.
Create the CR object:
$ oc create -f <file-name>For example:
$ oc create -f master-kube-config.yaml
6.3.2. Updating boot images
The Machine Config Operator (MCO) uses a boot image to bring up a Red Hat Enterprise Linux CoreOS (RHCOS) node. By default, OpenShift Container Platform does not manage the boot image.
This means that the boot image in your cluster is not updated along with your cluster. For example, if your cluster was originally created with OpenShift Container Platform 4.12, the boot image that the cluster uses to create nodes is the same 4.12 version, even if your cluster is at a later version. If the cluster is later upgraded to 4.13 or later, new nodes continue to scale with the same 4.12 image.
This process could cause the following issues:
- Extra time to start up nodes
- Certificate expiration issues
- Version skew issues
To avoid these issues, you can configure your cluster to update the boot image whenever you update your cluster. By modifying the MachineConfiguration object, you can enable this feature. Currently, the ability to update the boot image is available for only Google Cloud clusters as a Technology Preview feature and is not supported for Cluster CAPI Operator managed clusters.
The updating boot image feature on Google Cloud clusters is a Technology Preview feature only. Technology Preview features are not supported with Red Hat production service level agreements (SLAs) and might not be functionally complete. Red Hat does not recommend using them in production. These features provide early access to upcoming product features, enabling customers to test functionality and provide feedback during the development process.
For more information about the support scope of Red Hat Technology Preview features, see Technology Preview Features Support Scope.
To view the current boot image used in your cluster, examine a machine set:
Example machine set with the boot image reference
apiVersion: machine.openshift.io/v1beta1
kind: MachineSet
metadata:
name: ci-ln-hmy310k-72292-5f87z-worker-a
namespace: openshift-machine-api
spec:
# ...
template:
# ...
spec:
# ...
providerSpec:
# ...
value:
disks:
- autoDelete: true
boot: true
image: projects/rhcos-cloud/global/images/rhcos-412-85-202203181601-0-gcp-x86-64
# ...- 1
- This boot image is the same as the originally-installed OpenShift Container Platform version, in this example OpenShift Container Platform 4.12, regardless of the current version of the cluster. The way that the boot image is represented in the machine set depends on the platform, as the structure of the
providerSpecfield differs from platform to platform.
If you configure your cluster to update your boot images, the boot image referenced in your machine sets matches the current version of the cluster.
Prerequisites
-
You have enabled the
TechPreviewNoUpgradefeature set by using the feature gates. For more information, see "Enabling features using feature gates" in the "Additional resources" section.
Procedure
Edit the
MachineConfigurationobject, namedcluster, to enable the updating of boot images by running the following command:$ oc edit MachineConfiguration clusterOptional: Configure the boot image update feature for all the machine sets:
apiVersion: operator.openshift.io/v1 kind: MachineConfiguration metadata: name: cluster namespace: openshift-machine-config-operator spec: # ... managedBootImages:1 machineManagers: - resource: machinesets apiGroup: machine.openshift.io selection: mode: All2 Optional: Configure the boot image update feature for specific machine sets:
apiVersion: operator.openshift.io/v1 kind: MachineConfiguration metadata: name: cluster namespace: openshift-machine-config-operator spec: # ... managedBootImages:1 machineManagers: - resource: machinesets apiGroup: machine.openshift.io selection: mode: Partial partial: machineResourceSelector: matchLabels: update-boot-image: "true"2 TipIf an appropriate label is not present on the machine set, add a key/value pair by running a command similar to following:
$ oc label machineset.machine ci-ln-hmy310k-72292-5f87z-worker-a update-boot-image=true -n openshift-machine-api
Verification
Get the boot image version by running the following command:
$ oc get machinesets <machineset_name> -n openshift-machine-api -o yamlExample machine set with the boot image reference
apiVersion: machine.openshift.io/v1beta1 kind: MachineSet metadata: labels: machine.openshift.io/cluster-api-cluster: ci-ln-77hmkpt-72292-d4pxp update-boot-image: "true" name: ci-ln-77hmkpt-72292-d4pxp-worker-a namespace: openshift-machine-api spec: # ... template: # ... spec: # ... providerSpec: # ... value: disks: - autoDelete: true boot: true image: projects/rhcos-cloud/global/images/rhcos-416-92-202402201450-0-gcp-x86-641 # ...- 1
- This boot image is the same as the current OpenShift Container Platform version.
6.3.2.1. Disabling updated boot images
You can disable the boot image management feature so that the Machine Config Operator (MCO) no longer manages or updates the boot image in the affected machine sets. For example, you could disable this feature for the worker nodes in order to use a custom boot image that you do not want changed.
If you disable this feature after some nodes have been created with the new boot image version, any existing nodes retain their current boot image. Turning off this feature does not rollback the nodes or machine sets to the originally-installed boot image. The machine sets retain the boot image version that was present when the feature was enabled and is not updated again when the cluster is upgraded to a new OpenShift Container Platform version in the future.
Procedure
Disable updated boot images by editing the
MachineConfigurationobject:$ oc edit MachineConfiguration clusterMake the
machineManagersparameter an empty array:apiVersion: operator.openshift.io/v1 kind: MachineConfiguration metadata: name: cluster namespace: openshift-machine-config-operator spec: # ... managedBootImages: machineManagers: []Remove the parameters listed under
machineManagersand add the[]characters to disable boot image updates.
6.3.3. Configuring control plane nodes as schedulable
You can configure control plane nodes to be schedulable, meaning that new pods are allowed for placement on the control plane nodes.
By default, control plane nodes are not schedulable. You can set the control plane nodes to be schedulable, but you must retain the compute nodes.
You can deploy OpenShift Container Platform with no compute nodes on a bare-metal cluster. In this case, the control plane nodes are marked schedulable by default.
You can allow or disallow control plane nodes to be schedulable by configuring the mastersSchedulable field.
When you configure control plane nodes from the default unschedulable to schedulable, additional subscriptions are required. This is because control plane nodes then become compute nodes.
Procedure
Edit the
schedulers.config.openshift.ioresource.$ oc edit schedulers.config.openshift.io clusterConfigure the
mastersSchedulablefield.apiVersion: config.openshift.io/v1 kind: Scheduler metadata: creationTimestamp: "2019-09-10T03:04:05Z" generation: 1 name: cluster resourceVersion: "433" selfLink: /apis/config.openshift.io/v1/schedulers/cluster uid: a636d30a-d377-11e9-88d4-0a60097bee62 spec: mastersSchedulable: false status: {} #...where:
spec.mastersSchedulable-
Specifies whether the control plane nodes are schedulable. Set to
trueto allow control plane nodes to be schedulable, orfalseto disallow control plane nodes from being schedulable.
- Save the file to apply the changes.
6.3.4. Setting SELinux booleans
OpenShift Container Platform allows you to enable and disable an SELinux boolean on a Red Hat Enterprise Linux CoreOS (RHCOS) node. The following procedure explains how to modify SELinux booleans on nodes using the Machine Config Operator (MCO). This procedure uses container_manage_cgroup as the example boolean. You can modify this value to whichever boolean you need.
Prerequisites
-
You have installed the OpenShift CLI (
oc).
Procedure
Create a new YAML file with a
MachineConfigobject, displayed in the following example:apiVersion: machineconfiguration.openshift.io/v1 kind: MachineConfig metadata: labels: machineconfiguration.openshift.io/role: worker name: 99-worker-setsebool spec: config: ignition: version: 3.2.0 systemd: units: - contents: | [Unit] Description=Set SELinux booleans Before=kubelet.service [Service] Type=oneshot ExecStart=/sbin/setsebool container_manage_cgroup=on RemainAfterExit=true [Install] WantedBy=multi-user.target graphical.target enabled: true name: setsebool.service #...Create the new
MachineConfigobject by running the following command:$ oc create -f 99-worker-setsebool.yamlNoteApplying any changes to the
MachineConfigobject causes all affected nodes to gracefully reboot after the change is applied.
6.3.5. Adding kernel arguments to nodes
In some special cases, you can add kernel arguments to a set of nodes in your cluster to customize the kernel behavior to meet specific needs you might have.
You should add kernel arguments with caution and a clear understanding of the implications of the arguments you set.
Improper use of kernel arguments can result in your systems becoming unbootable.
Examples of kernel arguments you could set include:
-
nosmt: Disables symmetric multithreading (SMT) in the kernel. Multithreading allows multiple logical threads for each CPU. You could consider
nosmtin multi-tenant environments to reduce risks from potential cross-thread attacks. By disabling SMT, you essentially choose security over performance. systemd.unified_cgroup_hierarchy: Enables Linux control group version 2 (cgroup v2). cgroup v2 is the next version of the kernel control group and offers multiple improvements.
Importantcgroup v1 is a deprecated feature. Deprecated functionality is still included in OpenShift Container Platform and continues to be supported; however, it will be removed in a future release of this product and is not recommended for new deployments.
For the most recent list of major functionality that has been deprecated or removed within OpenShift Container Platform, refer to the Deprecated and removed features section of the OpenShift Container Platform release notes.
enforcing=0: Configures Security Enhanced Linux (SELinux) to run in permissive mode. In permissive mode, the system acts as if SELinux is enforcing the loaded security policy, including labeling objects and emitting access denial entries in the logs, but it does not actually deny any operations. While not supported for production systems, permissive mode can be helpful for debugging.
WarningDisabling SELinux on RHCOS in production is not supported. After SELinux has been disabled on a node, it must be re-provisioned before re-inclusion in a production cluster.
See Kernel.org kernel parameters for a list and descriptions of kernel arguments.
In the following procedure, you create a MachineConfig object that identifies:
- A set of machines to which you want to add the kernel argument. In this case, machines with a worker role.
- Kernel arguments that are appended to the end of the existing kernel arguments.
- A label that indicates where in the list of machine configs the change is applied.
Prerequisites
-
You have
cluster-adminprivileges. - Your cluster is running.
Procedure
List existing
MachineConfigobjects for your OpenShift Container Platform cluster to determine how to label your machine config:$ oc get MachineConfigExample output
NAME GENERATEDBYCONTROLLER IGNITIONVERSION AGE 00-master 52dd3ba6a9a527fc3ab42afac8d12b693534c8c9 3.4.0 33m 00-worker 52dd3ba6a9a527fc3ab42afac8d12b693534c8c9 3.4.0 33m 01-master-container-runtime 52dd3ba6a9a527fc3ab42afac8d12b693534c8c9 3.4.0 33m 01-master-kubelet 52dd3ba6a9a527fc3ab42afac8d12b693534c8c9 3.4.0 33m 01-worker-container-runtime 52dd3ba6a9a527fc3ab42afac8d12b693534c8c9 3.4.0 33m 01-worker-kubelet 52dd3ba6a9a527fc3ab42afac8d12b693534c8c9 3.4.0 33m 99-master-generated-registries 52dd3ba6a9a527fc3ab42afac8d12b693534c8c9 3.4.0 33m 99-master-ssh 3.2.0 40m 99-worker-generated-registries 52dd3ba6a9a527fc3ab42afac8d12b693534c8c9 3.4.0 33m 99-worker-ssh 3.2.0 40m rendered-master-23e785de7587df95a4b517e0647e5ab7 52dd3ba6a9a527fc3ab42afac8d12b693534c8c9 3.4.0 33m rendered-worker-5d596d9293ca3ea80c896a1191735bb1 52dd3ba6a9a527fc3ab42afac8d12b693534c8c9 3.4.0 33mCreate a
MachineConfigobject file that identifies the kernel argument (for example,05-worker-kernelarg-selinuxpermissive.yaml)apiVersion: machineconfiguration.openshift.io/v1 kind: MachineConfig metadata: labels: machineconfiguration.openshift.io/role: worker name: 05-worker-kernelarg-selinuxpermissive spec: kernelArguments: - enforcing=0where:
machineconfiguration.openshift.io/role- Specifies a label to apply changes to specific nodes.
name- Specifies a name to identify where it fits among the machine configs (05) and what it does (adds a kernel argument to configure SELinux permissive mode).
kernelArguments-
Specifies the exact kernel argument as
enforcing=0.
Create the new machine config:
$ oc create -f 05-worker-kernelarg-selinuxpermissive.yamlCheck the machine configs to see that the new one was added:
$ oc get MachineConfigExample output
NAME GENERATEDBYCONTROLLER IGNITIONVERSION AGE 00-master 52dd3ba6a9a527fc3ab42afac8d12b693534c8c9 3.4.0 33m 00-worker 52dd3ba6a9a527fc3ab42afac8d12b693534c8c9 3.4.0 33m 01-master-container-runtime 52dd3ba6a9a527fc3ab42afac8d12b693534c8c9 3.4.0 33m 01-master-kubelet 52dd3ba6a9a527fc3ab42afac8d12b693534c8c9 3.4.0 33m 01-worker-container-runtime 52dd3ba6a9a527fc3ab42afac8d12b693534c8c9 3.4.0 33m 01-worker-kubelet 52dd3ba6a9a527fc3ab42afac8d12b693534c8c9 3.4.0 33m 05-worker-kernelarg-selinuxpermissive 3.4.0 105s 99-master-generated-registries 52dd3ba6a9a527fc3ab42afac8d12b693534c8c9 3.4.0 33m 99-master-ssh 3.2.0 40m 99-worker-generated-registries 52dd3ba6a9a527fc3ab42afac8d12b693534c8c9 3.4.0 33m 99-worker-ssh 3.2.0 40m rendered-master-23e785de7587df95a4b517e0647e5ab7 52dd3ba6a9a527fc3ab42afac8d12b693534c8c9 3.4.0 33m rendered-worker-5d596d9293ca3ea80c896a1191735bb1 52dd3ba6a9a527fc3ab42afac8d12b693534c8c9 3.4.0 33mCheck the nodes:
$ oc get nodesExample output
NAME STATUS ROLES AGE VERSION ip-10-0-136-161.ec2.internal Ready worker 28m v1.29.4 ip-10-0-136-243.ec2.internal Ready master 34m v1.29.4 ip-10-0-141-105.ec2.internal Ready,SchedulingDisabled worker 28m v1.29.4 ip-10-0-142-249.ec2.internal Ready master 34m v1.29.4 ip-10-0-153-11.ec2.internal Ready worker 28m v1.29.4 ip-10-0-153-150.ec2.internal Ready master 34m v1.29.4You can see that scheduling on each worker node is disabled as the change is being applied.
Check that the kernel argument worked by going to one of the worker nodes and listing the kernel command-line arguments (in
/proc/cmdlineon the host):$ oc debug node/ip-10-0-141-105.ec2.internalExample output
Starting pod/ip-10-0-141-105ec2internal-debug ... To use host binaries, run `chroot /host` sh-4.2# cat /host/proc/cmdline BOOT_IMAGE=/ostree/rhcos-... console=tty0 console=ttyS0,115200n8 rootflags=defaults,prjquota rw root=UUID=fd0... ostree=/ostree/boot.0/rhcos/16... coreos.oem.id=qemu coreos.oem.id=ec2 ignition.platform.id=ec2 enforcing=0 sh-4.2# exitYou should see the
enforcing=0argument added to the other kernel arguments.
6.3.6. Allowing swap memory use on nodes
You can allow workloads on the cluster nodes to use swap memory.
Swap memory support on nodes is a Technology Preview feature only. Technology Preview features are not supported with Red Hat production service level agreements (SLAs) and might not be functionally complete. Red Hat does not recommend using them in production. These features provide early access to upcoming product features, enabling customers to test functionality and provide feedback during the development process.
For more information about the support scope of Red Hat Technology Preview features, see Technology Preview Features Support Scope.
Enabling swap memory is only available for container-native virtualization (CNV) users or use cases.
Enabling swap memory can negatively impact workload performance and out-of-resource handling. Do not enable swap memory on control plane nodes.
To enable swap memory, create a kubeletconfig custom resource (CR) to set the swapbehavior parameter. You can set limited or unlimited swap memory:
Limited: Use the
LimitedSwapvalue to limit how much swap memory workloads can use. Any workloads on the node that are not managed by OpenShift Container Platform can still use swap memory. TheLimitedSwapbehavior depends on whether the node is running with Linux control groups version 1 (cgroups v1) or version 2 (cgroup v2):- cgroup v2: OpenShift Container Platform workloads can use any combination of memory and swap, up to the pod’s memory limit, if set.
- cgroup v1: OpenShift Container Platform workloads cannot use swap memory.
-
Unlimited: Use the
UnlimitedSwapvalue to allow workloads to use as much swap memory as they request, up to the system limit.
Because the kubelet will not start in the presence of swap memory without this configuration, you must enable swap memory in OpenShift Container Platform before enabling swap memory on the nodes. If there is no swap memory present on a node, enabling swap memory in OpenShift Container Platform has no effect.
Prerequisites
- You have a running OpenShift Container Platform cluster that uses version 4.10 or later.
- Your cluster is configured to use cgroup v2. Swap memory is not supported on nodes in clusters that use cgroup v1.
- You are logged in to the cluster as a user with administrative privileges.
You have enabled the
TechPreviewNoUpgradefeature set on the cluster (see NodesWorking with clusters Enabling features using feature gates). NoteEnabling the
TechPreviewNoUpgradefeature set cannot be undone and prevents minor version updates. These feature sets are not recommended on production clusters.-
If cgroup v2 is enabled on a node, you must enable swap accounting on the node, by setting the
swapaccount=1kernel argument.
Procedure
Apply a custom label to the machine config pool where you want to allow swap memory.
$ oc label machineconfigpool worker kubelet-swap=enabledCreate a custom resource (CR) to enable and configure swap settings.
apiVersion: machineconfiguration.openshift.io/v1 kind: KubeletConfig metadata: name: swap-config spec: machineConfigPoolSelector: matchLabels: kubelet-swap: enabled kubeletConfig: failSwapOn: false memorySwap: swapBehavior: LimitedSwap #...where:
failSwapOn-
Set to
falseto enable swap memory use on the associated nodes. Set totrueto disable swap memory use. swapBehavior- Optional: Specify the swap memory behavior for OpenShift Container Platform pods.
- Enable swap memory on the machines.
6.3.7. About configuring parallel container image pulls
To help control bandwidth issues, you can configure the number of workload images that can be pulled at the same time.
By default, the cluster pulls images in parallel, which allows multiple workloads to pull images at the same time. Pulling multiple images in parallel can improve workload start-up time because workloads can pull needed images without waiting for each other. However, pulling too many images at the same time can use excessive network bandwidth and cause latency issues throughout your cluster.
The default setting allows unlimited simultaneous image pulls. But, you can configure the maximum number of images that can be pulled in parallel. You can also force serial image pulling, which means that only one image can be pulled at a time.
To control the number of images that can be pulled simultaneously, use a kubelet configuration to set the maxParallelImagePulls to specify a limit. Additional image pulls above this limit are held until one of the current pulls is complete.
To force serial image pulls, use a kubelet configuration to set serializeImagePulls field to true.
6.3.7.1. Configuring parallel container image pulls
You can control the number of images that can be pulled by your workload simultaneously by using a kubelet configuration. You can set a maximum number of images that can be pulled or force workloads to pull images one at a time.
Prerequisites
- You have a running OpenShift Container Platform cluster.
- You are logged in to the cluster as a user with administrative privileges.
Procedure
Apply a custom label to the machine config pool where you want to configure parallel pulls by running a command similar to the following.
$ oc label machineconfigpool <mcp_name> parallel-pulls=setCreate a custom resource (CR) to configure parallel image pulling.
apiVersion: machineconfiguration.openshift.io/v1 kind: KubeletConfig metadata: name: parallel-image-pulls # ... spec: machineConfigPoolSelector: matchLabels: parallel-pulls: set kubeletConfig: serializeImagePulls: false maxParallelImagePulls: 3 # ...where:
serializeImagePulls-
Specifies whether parallel pulling is enabled for the nodes in the associated machine config pool. Set to
falseto enable parallel image pulls. Set totrueto force serial image pulling. The default isfalse. maxParallelImagePulls-
Specifies the maximum number of images that can be pulled in parallel. Enter a number or set to
nilto specify no limit. This field cannot be set ifSerializeImagePullsistrue. The default isnil.
Create the new machine config by running a command similar to the following:
$ oc create -f <file_name>.yaml
Verification
Check the machine configs to see that a new one was added by running the following command:
$ oc get MachineConfigNAME GENERATEDBYCONTROLLER IGNITIONVERSION AGE 00-master 70025364a114fc3067b2e82ce47fdb0149630e4b 3.5.0 133m 00-worker 70025364a114fc3067b2e82ce47fdb0149630e4b 3.5.0 133m # ... 99-parallel-generated-kubelet 70025364a114fc3067b2e82ce47fdb0149630e4b 3.5.0 15s # ... rendered-parallel-c634a80f644740974ceb40c054c79e50 70025364a114fc3067b2e82ce47fdb0149630e4b 3.5.0 10swhere:
99-parallel-generated-kubelet-
Specifies the new machine config. In this example, the machine config is for the
parallelcustom machine config pool. rendered-parallel-<sha_numnber>-
Specifies the new rendered machine config. In this example, the machine config is for the
parallelcustom machine config pool.
Check to see that the nodes in the
parallelmachine config pool are being updated by running the following command:$ oc get machineconfigpoolNAME CONFIG UPDATED UPDATING DEGRADED MACHINECOUNT READYMACHINECOUNT UPDATEDMACHINECOUNT DEGRADEDMACHINECOUNT AGE parallel rendered-parallel-3904f0e69130d125b3b5ef0e981b1ce1 False True False 1 0 0 0 65m master rendered-master-7536834c197384f3734c348c1d957c18 True False False 3 3 3 0 140m worker rendered-worker-c634a80f644740974ceb40c054c79e50 True False False 2 2 2 0 140mWhen the nodes are updated, verify that the parallel pull maximum was configured:
Open an
oc debugsession to a node by running a command similar to the following:$ oc debug node/<node_name>Set
/hostas the root directory within the debug shell by running the following command:sh-5.1# chroot /hostExamine the
kubelet.conffile by running the following command:sh-5.1# cat /etc/kubernetes/kubelet.conf | grep -i maxParallelImagePullsmaxParallelImagePulls: 3
6.3.8. Migrating control plane nodes from one RHOSP host to another manually
If control plane machine sets are not enabled on your cluster, you can run a script that moves a control plane node from one Red Hat OpenStack Platform (RHOSP) node to another.
Control plane machine sets are not enabled on clusters that run on user-provisioned infrastructure.
For information about control plane machine sets, see "Managing control plane machines with control plane machine sets".
Prerequisites
-
The environment variable
OS_CLOUDrefers to acloudsentry that has administrative credentials in aclouds.yamlfile. -
The environment variable
KUBECONFIGrefers to a configuration that contains administrative OpenShift Container Platform credentials.
Procedure
From a command line, run the following script:
#!/usr/bin/env bash set -Eeuo pipefail if [ $# -lt 1 ]; then echo "Usage: '$0 node_name'" exit 64 fi # Check for admin OpenStack credentials openstack server list --all-projects >/dev/null || { >&2 echo "The script needs OpenStack admin credentials. Exiting"; exit 77; } # Check for admin OpenShift credentials oc adm top node >/dev/null || { >&2 echo "The script needs OpenShift admin credentials. Exiting"; exit 77; } set -x declare -r node_name="$1" declare server_id server_id="$(openstack server list --all-projects -f value -c ID -c Name | grep "$node_name" | cut -d' ' -f1)" readonly server_id # Drain the node oc adm cordon "$node_name" oc adm drain "$node_name" --delete-emptydir-data --ignore-daemonsets --force # Power off the server oc debug "node/${node_name}" -- chroot /host shutdown -h 1 # Verify the server is shut off until openstack server show "$server_id" -f value -c status | grep -q 'SHUTOFF'; do sleep 5; done # Migrate the node openstack server migrate --wait "$server_id" # Resize the VM openstack server resize confirm "$server_id" # Wait for the resize confirm to finish until openstack server show "$server_id" -f value -c status | grep -q 'SHUTOFF'; do sleep 5; done # Restart the VM openstack server start "$server_id" # Wait for the node to show up as Ready: until oc get node "$node_name" | grep -q "^${node_name}[[:space:]]\+Ready"; do sleep 5; done # Uncordon the node oc adm uncordon "$node_name" # Wait for cluster operators to stabilize until oc get co -o go-template='statuses: {{ range .items }}{{ range .status.conditions }}{{ if eq .type "Degraded" }}{{ if ne .status "False" }}DEGRADED{{ end }}{{ else if eq .type "Progressing"}}{{ if ne .status "False" }}PROGRESSING{{ end }}{{ else if eq .type "Available"}}{{ if ne .status "True" }}NOTAVAILABLE{{ end }}{{ end }}{{ end }}{{ end }}' | grep -qv '\(DEGRADED\|PROGRESSING\|NOTAVAILABLE\)'; do sleep 5; doneIf the script completes, the control plane machine is migrated to a new RHOSP node.
6.4. Managing the maximum number of pods per node
In OpenShift Container Platform, you can configure the number of pods that can run on a node based on the number of processor cores on the node, a hard limit, or both. If you use both options, the lower of the two limits the number of pods on a node. Setting a maximum number of pods can prevent a node from running more pods than its underlying hardware can handle.
When both options are in use, the lower of the two values limits the number of pods on a node. Exceeding these values can result in the following conditions:
- Increased CPU utilization.
- Slow pod scheduling.
- Potential out-of-memory scenarios, depending on the amount of memory in the node.
- Exhausting the pool of IP addresses.
- Resource overcommitting, leading to poor user application performance.
In Kubernetes, a pod that is holding a single container actually uses two containers. The second container is used to set up networking prior to the actual container starting. Therefore, a system running 10 pods will actually have 20 containers running.
Disk IOPS throttling from the cloud provider might have an impact on CRI-O and kubelet. They might get overloaded when there are large number of I/O intensive pods running on the nodes. It is recommended that you monitor the disk I/O on the nodes and use volumes with sufficient throughput for the workload.
The podsPerCore parameter sets the number of pods that the node can run based on the number of processor cores on the node. For example, if podsPerCore is set to 10 on a node with 4 processor cores, the maximum number of pods allowed on the node is 40.
kubeletConfig:
podsPerCore: 10
Setting podsPerCore to 0 disables this limit. The default is 0. The value of the podsPerCore parameter cannot exceed the value of the maxPods parameter.
The maxPods parameter sets the number of pods that the node can run to a fixed value, regardless of the properties of the node.
kubeletConfig:
maxPods: 2506.4.1. Configuring the maximum number of pods per node
You can use the podsPerCore and maxPods parameters in a kublet configuration to control the maximum number of pods that can be scheduled to a node. If you use both options, the lower of the two limits the number of pods on a node. Setting an appropriate maximum can help ensure your nodes run efficiently.
For example, if podsPerCore is set to 10 on a node with 4 processor cores, the maximum number of pods allowed on the node will be 40.
Prerequisites
-
You have the label associated with the static
MachineConfigPoolCRD for the type of node you want to configure.
Procedure
Create a custom resource (CR) for your configuration change.
Sample configuration for a
max-podsCRapiVersion: machineconfiguration.openshift.io/v1 kind: KubeletConfig metadata: name: set-max-pods spec: machineConfigPoolSelector: matchLabels: pools.operator.machineconfiguration.openshift.io/worker: "" kubeletConfig: podsPerCore: 10 maxPods: 250 #...where:
metadata.name- Specifies a name for the CR.
spec.machineConfigPoolSelector.matchLabels- Specifies the label from the machine config pool.
spec.kubeletConfig.podsPerCore- Specifies the number of pods the node can run based on the number of processor cores on the node.
spec.kubeletConfig.maxPodsSpecifies the number of pods the node can run to a fixed value, regardless of the properties of the node.
NoteSetting
podsPerCoreto0disables this limit.In the above example, the default value for
podsPerCoreis10and the default value formaxPodsis250. This means that unless the node has 25 cores or more, by default,podsPerCorewill be the limiting factor.
Run the following command to create the CR:
$ oc create -f <file_name>.yaml
Verification
List the
MachineConfigPoolCRDs to check if the change is applied. TheUPDATINGcolumn reportsTrueif the change is picked up by the Machine Config Controller:$ oc get machineconfigpoolsExample output
NAME CONFIG UPDATED UPDATING DEGRADED master master-9cc2c72f205e103bb534 False False False worker worker-8cecd1236b33ee3f8a5e False True FalseAfter the change is complete, the
UPDATEDcolumn reportsTrue.$ oc get machineconfigpoolsExample output
NAME CONFIG UPDATED UPDATING DEGRADED master master-9cc2c72f205e103bb534 False True False worker worker-8cecd1236b33ee3f8a5e True False False
6.5. Using the Node Tuning Operator
The Node Tuning Operator in OpenShift Container Platform helps you manage node-level tuning by orchestrating the TuneD daemon. You can use this unified interface to apply custom tuning specifications and achieve low latency performance for high-performance applications.
The Node Tuning Operator helps you manage node-level tuning by orchestrating the TuneD daemon and achieves low latency performance by using the Performance Profile controller. The majority of high-performance applications require some level of kernel tuning. The Node Tuning Operator provides a unified management interface to users of node-level sysctls and more flexibility to add custom tuning specified by user needs.
The Operator manages the containerized TuneD daemon for OpenShift Container Platform as a Kubernetes daemon set. It ensures the custom tuning specification is passed to all containerized TuneD daemons running in the cluster in the format that the daemons understand. The daemons run on all nodes in the cluster, one per node.
Node-level settings applied by the containerized TuneD daemon are rolled back on an event that triggers a profile change or when the containerized TuneD daemon is terminated gracefully by receiving and handling a termination signal.
The Node Tuning Operator uses the Performance Profile controller to implement automatic tuning to achieve low latency performance for OpenShift Container Platform applications.
The cluster administrator configures a performance profile to define node-level settings such as the following:
- Updating the kernel to kernel-rt.
- Choosing CPUs for housekeeping.
- Choosing CPUs for running workloads.
The Node Tuning Operator is part of a standard OpenShift Container Platform installation in version 4.1 and later.
In earlier versions of OpenShift Container Platform, the Performance Addon Operator was used to implement automatic tuning to achieve low latency performance for OpenShift applications. In OpenShift Container Platform 4.11 and later, this functionality is part of the Node Tuning Operator.
6.5.1. Accessing an example Node Tuning Operator specification
Use this process to access an example Node Tuning Operator specification.
Procedure
Run the following command to access an example Node Tuning Operator specification:
oc get tuned.tuned.openshift.io/default -o yaml -n openshift-cluster-node-tuning-operator
The default CR is meant for delivering standard node-level tuning for the OpenShift Container Platform platform and it can only be modified to set the Operator Management state. Any other custom changes to the default CR will be overwritten by the Operator. For custom tuning, create your own Tuned CRs. Newly created CRs will be combined with the default CR and custom tuning applied to OpenShift Container Platform nodes based on node or pod labels and profile priorities.
While in certain situations the support for pod labels can be a convenient way of automatically delivering required tuning, this practice is discouraged and strongly advised against, especially in large-scale clusters. The default Tuned CR ships without pod label matching. If a custom profile is created with pod label matching, then the functionality will be enabled at that time. The pod label functionality will be deprecated in future versions of the Node Tuning Operator.
6.5.2. Custom tuning specification
The custom resource (CR) for the Operator has two major sections. The first section, profile:, is a list of TuneD profiles and their names. The second, recommend:, defines the profile selection logic.
Multiple custom tuning specifications can co-exist as multiple CRs in the Operator’s namespace. The existence of new CRs or the deletion of old CRs is detected by the Operator. All existing custom tuning specifications are merged and appropriate objects for the containerized TuneD daemons are updated.
Management state
The Operator Management state is set by adjusting the default Tuned CR. By default, the Operator is in the Managed state and the spec.managementState field is not present in the default Tuned CR. Valid values for the Operator Management state are as follows:
- Managed: the Operator will update its operands as configuration resources are updated
- Unmanaged: the Operator will ignore changes to the configuration resources
- Removed: the Operator will remove its operands and resources the Operator provisioned
Profile data
The profile: section lists TuneD profiles and their names.
profile:
- name: tuned_profile_1
data: |
# TuneD profile specification
[main]
summary=Description of tuned_profile_1 profile
[sysctl]
net.ipv4.ip_forward=1
# ... other sysctl's or other TuneD daemon plugins supported by the containerized TuneD
# ...
- name: tuned_profile_n
data: |
# TuneD profile specification
[main]
summary=Description of tuned_profile_n profile
# tuned_profile_n profile settingsRecommended profiles
The profile: selection logic is defined by the recommend: section of the CR. The recommend: section is a list of items to recommend the profiles based on a selection criteria.
recommend:
<recommend-item-1>
# ...
<recommend-item-n>The individual items of the list:
- machineConfigLabels:
<mcLabels>
match:
<match>
priority: <priority>
profile: <tuned_profile_name>
operand:
debug: <bool>
tunedConfig:
reapply_sysctl: <bool> - 1
- Optional.
- 2
- A dictionary of key/value
MachineConfiglabels. The keys must be unique. - 3
- If omitted, profile match is assumed unless a profile with a higher priority matches first or
machineConfigLabelsis set. - 4
- An optional list.
- 5
- Profile ordering priority. Lower numbers mean higher priority (
0is the highest priority). - 6
- A TuneD profile to apply on a match. For example
tuned_profile_1. - 7
- Optional operand configuration.
- 8
- Turn debugging on or off for the TuneD daemon. Options are
truefor on orfalsefor off. The default isfalse. - 9
- Turn
reapply_sysctlfunctionality on or off for the TuneD daemon. Options aretruefor on andfalsefor off.
<match> is an optional list recursively defined as follows:
- label: <label_name>
value: <label_value>
type: <label_type>
<match>
If <match> is not omitted, all nested <match> sections must also evaluate to true. Otherwise, false is assumed and the profile with the respective <match> section will not be applied or recommended. Therefore, the nesting (child <match> sections) works as logical AND operator. Conversely, if any item of the <match> list matches, the entire <match> list evaluates to true. Therefore, the list acts as logical OR operator.
If machineConfigLabels is defined, machine config pool based matching is turned on for the given recommend: list item. <mcLabels> specifies the labels for a machine config. The machine config is created automatically to apply host settings, such as kernel boot parameters, for the profile <tuned_profile_name>. This involves finding all machine config pools with machine config selector matching <mcLabels> and setting the profile <tuned_profile_name> on all nodes that are assigned the found machine config pools. To target nodes that have both master and worker roles, you must use the master role.
The list items match and machineConfigLabels are connected by the logical OR operator. The match item is evaluated first in a short-circuit manner. Therefore, if it evaluates to true, the machineConfigLabels item is not considered.
When using machine config pool based matching, it is advised to group nodes with the same hardware configuration into the same machine config pool. Not following this practice might result in TuneD operands calculating conflicting kernel parameters for two or more nodes sharing the same machine config pool.
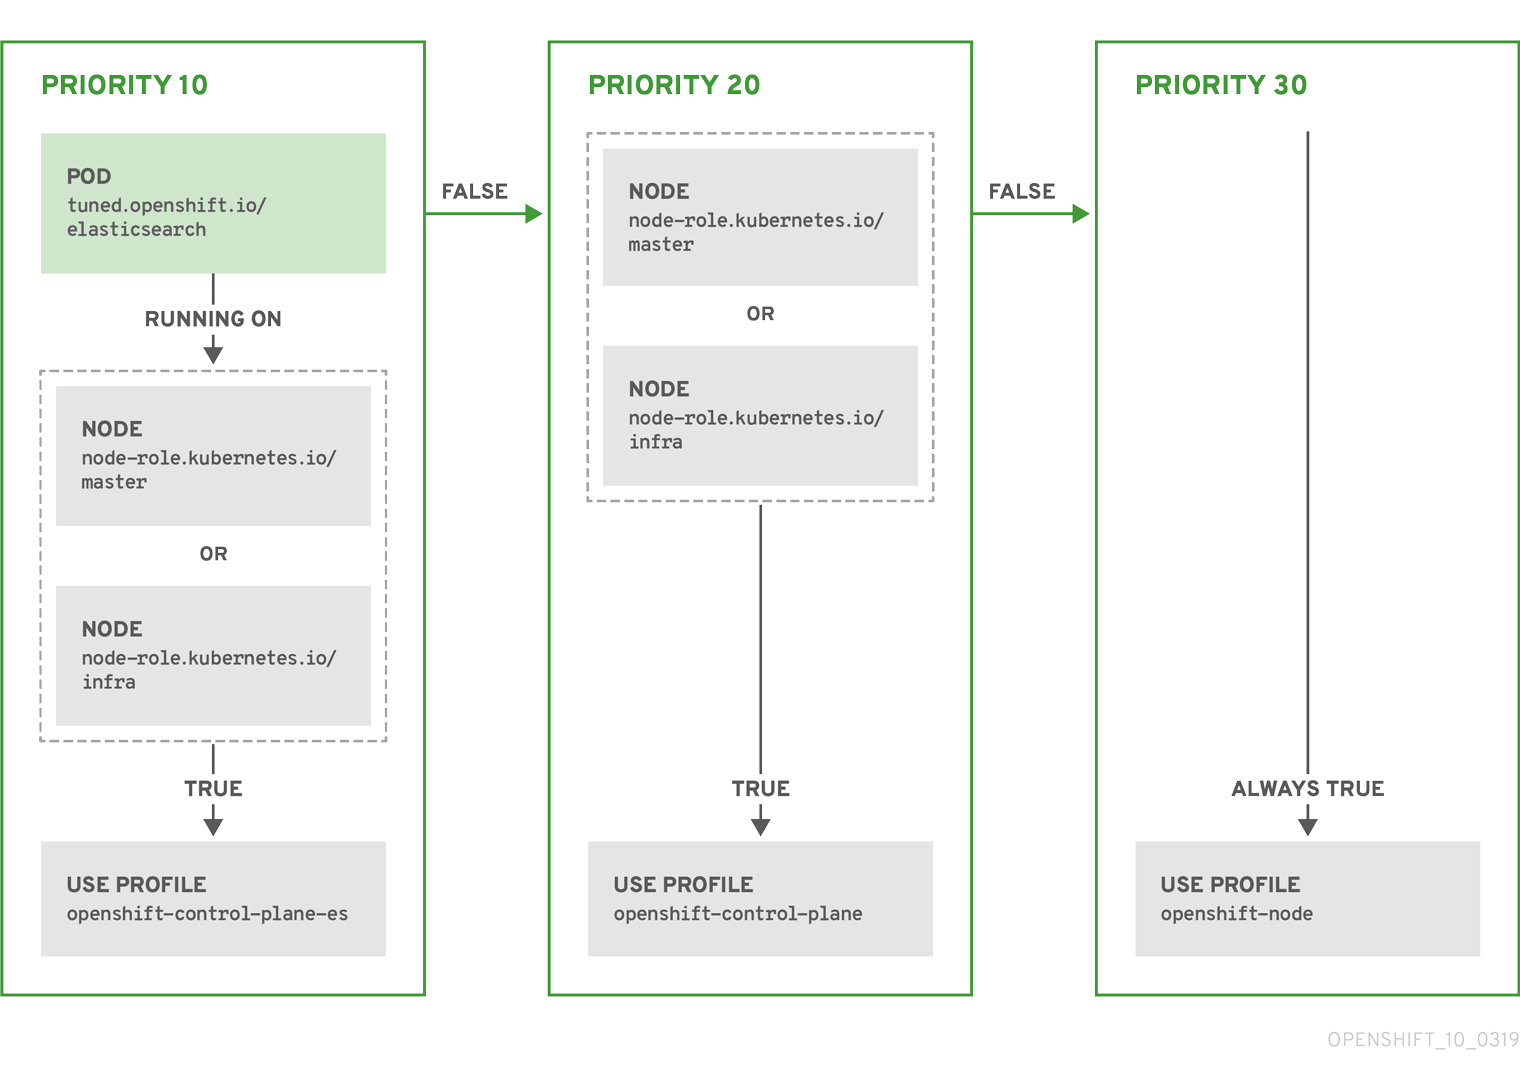
Example: Node or pod label based matching
- match:
- label: tuned.openshift.io/elasticsearch
match:
- label: node-role.kubernetes.io/master
- label: node-role.kubernetes.io/infra
type: pod
priority: 10
profile: openshift-control-plane-es
- match:
- label: node-role.kubernetes.io/master
- label: node-role.kubernetes.io/infra
priority: 20
profile: openshift-control-plane
- priority: 30
profile: openshift-node
The CR above is translated for the containerized TuneD daemon into its recommend.conf file based on the profile priorities. The profile with the highest priority (10) is openshift-control-plane-es and, therefore, it is considered first. The containerized TuneD daemon running on a given node looks to see if there is a pod running on the same node with the tuned.openshift.io/elasticsearch label set. If not, the entire <match> section evaluates as false. If there is such a pod with the label, in order for the <match> section to evaluate to true, the node label also needs to be node-role.kubernetes.io/master or node-role.kubernetes.io/infra.
If the labels for the profile with priority 10 matched, openshift-control-plane-es profile is applied and no other profile is considered. If the node/pod label combination did not match, the second highest priority profile (openshift-control-plane) is considered. This profile is applied if the containerized TuneD pod runs on a node with labels node-role.kubernetes.io/master or node-role.kubernetes.io/infra.
Finally, the profile openshift-node has the lowest priority of 30. It lacks the <match> section and, therefore, will always match. It acts as a profile catch-all to set openshift-node profile, if no other profile with higher priority matches on a given node.
Example: Machine config pool based matching
apiVersion: tuned.openshift.io/v1
kind: Tuned
metadata:
name: openshift-node-custom
namespace: openshift-cluster-node-tuning-operator
spec:
profile:
- data: |
[main]
summary=Custom OpenShift node profile with an additional kernel parameter
include=openshift-node
[bootloader]
cmdline_openshift_node_custom=+skew_tick=1
name: openshift-node-custom
recommend:
- machineConfigLabels:
machineconfiguration.openshift.io/role: "worker-custom"
priority: 20
profile: openshift-node-customTo minimize node reboots, label the target nodes with a label the machine config pool’s node selector will match, then create the Tuned CR above and finally create the custom machine config pool itself.
Cloud provider-specific TuneD profiles
With this functionality, all Cloud provider-specific nodes can conveniently be assigned a TuneD profile specifically tailored to a given Cloud provider on a OpenShift Container Platform cluster. This can be accomplished without adding additional node labels or grouping nodes into machine config pools.
This functionality takes advantage of spec.providerID node object values in the form of <cloud-provider>://<cloud-provider-specific-id> and writes the file /var/lib/ocp-tuned/provider with the value <cloud-provider> in NTO operand containers. The content of this file is then used by TuneD to load provider-<cloud-provider> profile if such profile exists.
The openshift profile that both openshift-control-plane and openshift-node profiles inherit settings from is now updated to use this functionality through the use of conditional profile loading. Neither NTO nor TuneD currently include any Cloud provider-specific profiles. However, it is possible to create a custom profile provider-<cloud-provider> that will be applied to all Cloud provider-specific cluster nodes.
Example GCE Cloud provider profile
apiVersion: tuned.openshift.io/v1
kind: Tuned
metadata:
name: provider-gce
namespace: openshift-cluster-node-tuning-operator
spec:
profile:
- data: |
[main]
summary=GCE Cloud provider-specific profile
# Your tuning for GCE Cloud provider goes here.
name: provider-gce
Due to profile inheritance, any setting specified in the provider-<cloud-provider> profile will be overwritten by the openshift profile and its child profiles.
6.5.3. Default profiles set on a cluster
The following are the default profiles set on a cluster.
apiVersion: tuned.openshift.io/v1
kind: Tuned
metadata:
name: default
namespace: openshift-cluster-node-tuning-operator
spec:
profile:
- data: |
[main]
summary=Optimize systems running OpenShift (provider specific parent profile)
include=-provider-${f:exec:cat:/var/lib/ocp-tuned/provider},openshift
name: openshift
recommend:
- profile: openshift-control-plane
priority: 30
match:
- label: node-role.kubernetes.io/master
- label: node-role.kubernetes.io/infra
- profile: openshift-node
priority: 40
Starting with OpenShift Container Platform 4.9, all OpenShift TuneD profiles are shipped with the TuneD package. You can use the oc exec command to view the contents of these profiles:
$ oc exec $tuned_pod -n openshift-cluster-node-tuning-operator -- find /usr/lib/tuned/openshift{,-control-plane,-node} -name tuned.conf -exec grep -H ^ {} \;6.5.4. Supported TuneD daemon plugins
Excluding the [main] section, the following TuneD plugins are supported when using custom profiles defined in the profile: section of the Tuned CR:
- audio
- cpu
- disk
- eeepc_she
- modules
- mounts
- net
- scheduler
- scsi_host
- selinux
- sysctl
- sysfs
- usb
- video
- vm
- bootloader
There is some dynamic tuning functionality provided by some of these plugins that is not supported. The following TuneD plugins are currently not supported:
- script
- systemd
The TuneD bootloader plugin only supports Red Hat Enterprise Linux CoreOS (RHCOS) worker nodes.
Additional resources
6.6. Remediating, fencing, and maintaining nodes
When node-level failures occur, due to issues such as kernel hangs or network issues, it is important to isolate the node, known as fencing, before initiating recovery of the workload, known as remediation, and then you can attempt to recover the node.
During node failures, the work required from the cluster does not decrease and workloads from affected nodes need to be restarted somewhere. Failures affecting these workloads risk data loss, corruption, or both.
For more information on remediation, fencing, and maintaining nodes, see the Workload Availability for Red Hat OpenShift documentation.
6.7. Understanding node rebooting
Review the following information to learn about rebooting a node without causing an outage for applications running on the platform by first evacuating the pods on the node.
For pods that are made highly available by the routing tier, nothing else needs to be done. For other pods needing storage, typically databases, it is critical to ensure that they can remain in operation with one pod temporarily going offline. While implementing resiliency for stateful pods is different for each application, in all cases it is important to configure the scheduler to use node anti-affinity to ensure that the pods are properly spread across available nodes.
Another challenge is how to handle nodes that are running critical infrastructure such as the router or the registry. The same node evacuation process applies, though it is important to understand certain edge cases.
6.7.1. About rebooting nodes running critical infrastructure
When rebooting nodes that host critical OpenShift Container Platform infrastructure components, such as router pods, registry pods, and monitoring pods, ensure that there are at least three nodes available to run these components.
The following scenario demonstrates how service interruptions can occur with applications running on OpenShift Container Platform when only two nodes are available:
- Node A is marked unschedulable and all pods are evacuated.
- The registry pod running on that node is now redeployed on node B. Node B is now running both registry pods.
- Node B is now marked unschedulable and is evacuated.
- The service exposing the two pod endpoints on node B loses all endpoints, for a brief period of time, until they are redeployed to node A.
When using three nodes for infrastructure components, this process does not result in a service disruption. However, due to pod scheduling, the last node that is evacuated and brought back into rotation does not have a registry pod. One of the other nodes has two registry pods. To schedule the third registry pod on the last node, use pod anti-affinity to prevent the scheduler from locating two registry pods on the same node.
6.7.2. Rebooting a node using pod anti-affinity
You can use pod anti-affinity to spread the workloads on a node to other nodes before performing a graceful node restart.
Pod anti-affinity is slightly different from node anti-affinity. Node anti-affinity can be violated if there are no other suitable locations to deploy a pod. Pod anti-affinity can be set to either required or preferred.
With this in place, if only two infrastructure nodes are available and one is rebooted, the container image registry pod is prevented from running on the other node. oc get pods reports the pod as unready until a suitable node is available. Once a node is available and all pods are back in ready state, the next node can be restarted.
The following procedure demonstrates how to reboot a node by using pod anti-affinity.
Procedure
Edit the node specification to configure pod anti-affinity:
apiVersion: v1 kind: Pod metadata: name: with-pod-antiaffinity spec: affinity: podAntiAffinity: preferredDuringSchedulingIgnoredDuringExecution: - weight: 100 podAffinityTerm: labelSelector: matchExpressions: - key: registry operator: In values: - default topologyKey: kubernetes.io/hostname #...where:
spec.affinity.podAntiAffinity- Specifies the stanza to configure pod anti-affinity.
spec.affinity.podAntiAffinity.preferredDuringSchedulingIgnoredDuringExecution- Specifies a preferred rule.
spec.affinity.podAntiAffinity.preferredDuringSchedulingIgnoredDuringExecution.weight- Specifies a weight for a preferred rule. The node with the highest weight is preferred.
spec.affinity.podAntiAffinity.preferredDuringSchedulingIgnoredDuringExecution.podAffinityTerm.labelSelector.matchExpressions.key- Specifies a pod label that determines when the anti-affinity rule applies. Define a key and value for the label.
spec.affinity.podAntiAffinity.preferredDuringSchedulingIgnoredDuringExecution.podAffinityTerm.labelSelector.matchExpressions.operatorSpecifies the relationship between the label on the existing pod and the set of values in the
matchExpressionparameters in the specification for the new pod. Can beIn,NotIn,Exists, orDoesNotExist.This example assumes the container image registry pod has a label of
registry=default. Pod anti-affinity can use any Kubernetes match expression.
-
Enable the
MatchInterPodAffinityscheduler predicate in the scheduling policy file. - Perform a graceful restart of the node.
6.7.3. Understanding how to reboot nodes running routers
Review the following information to learn how to reboot a node that hosts a router pod.
In most cases, a pod running an OpenShift Container Platform router exposes a host port.
The PodFitsPorts scheduler predicate ensures that no router pods using the same port can run on the same node, and pod anti-affinity is achieved. If the routers are relying on IP failover for high availability, there is nothing else that is needed.
For router pods relying on an external service such as AWS Elastic Load Balancing for high availability, it is that service’s responsibility to react to router pod restarts.
In rare cases, a router pod may not have a host port configured. In those cases, it is important to follow the recommended restart process for infrastructure nodes.
6.7.4. Rebooting a node gracefully
You can perform a graceful restart of a node, where all workloads are moved to other nodes, without data loss or service disruption.
Before rebooting a node, it is recommended to backup etcd data to avoid any data loss on the node.
For single-node OpenShift clusters that require users to perform the oc login command rather than having the certificates in kubeconfig file to manage the cluster, the oc adm commands might not be available after cordoning and draining the node. This is because the openshift-oauth-apiserver pod is not running due to the cordon. You can use SSH to access the nodes as indicated in the following procedure.
In a single-node OpenShift cluster, pods cannot be rescheduled when cordoning and draining. However, doing so gives the pods, especially your workload pods, time to properly stop and release associated resources.
The following procedure demonstrates how to perform a graceful restart of a node.
Procedure
Mark the node as unschedulable:
$ oc adm cordon <node1>Drain the node to remove all the running pods:
$ oc adm drain <node1> --ignore-daemonsets --delete-emptydir-data --forceYou might receive errors that pods associated with custom pod disruption budgets (PDB) cannot be evicted.
Example error
error when evicting pods/"rails-postgresql-example-1-72v2w" -n "rails" (will retry after 5s): Cannot evict pod as it would violate the pod's disruption budget.In this case, run the drain command again, adding the
disable-evictionflag, which bypasses the PDB checks:$ oc adm drain <node1> --ignore-daemonsets --delete-emptydir-data --force --disable-evictionAccess the node in debug mode:
$ oc debug node/<node1>Change your root directory to
/host:$ chroot /hostRestart the node:
$ systemctl rebootIn a moment, the node enters the
NotReadystate.NoteWith some single-node OpenShift clusters, the
occommands might not be available after you cordon and drain the node because theopenshift-oauth-apiserverpod is not running. You can use SSH to connect to the node and perform the reboot.$ ssh core@<master-node>.<cluster_name>.<base_domain>$ sudo systemctl rebootAfter the reboot is complete, mark the node as schedulable by running the following command:
$ oc adm uncordon <node1>NoteWith some single-node OpenShift clusters, the
occommands might not be available after you cordon and drain the node because theopenshift-oauth-apiserverpod is not running. You can use SSH to connect to the node and uncordon it.$ ssh core@<target_node>$ sudo oc adm uncordon <node> --kubeconfig /etc/kubernetes/static-pod-resources/kube-apiserver-certs/secrets/node-kubeconfigs/localhost.kubeconfigVerify that the node is ready:
$ oc get node <node1>Example output
NAME STATUS ROLES AGE VERSION <node1> Ready worker 6d22h v1.18.3+b0068a8
6.8. Freeing node resources using garbage collection
As an administrator, you can use OpenShift Container Platform to ensure that your nodes are running efficiently by freeing up resources through garbage collection.
The OpenShift Container Platform node performs two types of garbage collection:
- Container garbage collection: Removes terminated containers.
- Image garbage collection: Removes images not referenced by any running pods.
6.8.1. Understanding how terminated containers are removed through garbage collection
You can help ensure that your nodes are running efficiently by using container garbage collection to remove terminated containers.
When eviction thresholds are set for garbage collection, the node tries to keep any container for any pod accessible from the API. If the pod has been deleted, the containers will be as well. Containers are preserved as long the pod is not deleted and the eviction threshold is not reached. If the node is under disk pressure, it will remove containers and their logs will no longer be accessible using oc logs.
- eviction-soft - A soft eviction threshold pairs an eviction threshold with a required administrator-specified grace period.
- eviction-hard - A hard eviction threshold has no grace period, and if observed, OpenShift Container Platform takes immediate action.
The following table lists the eviction thresholds:
| Node condition | Eviction signal | Description |
|---|---|---|
| MemoryPressure |
| The available memory on the node. |
| DiskPressure |
|
The available disk space or inodes on the node root file system, |
For evictionHard you must specify all of these parameters. If you do not specify all parameters, only the specified parameters are applied and the garbage collection will not function properly.
If a node is oscillating above and below a soft eviction threshold, but not exceeding its associated grace period, the corresponding node would constantly oscillate between true and false. As a consequence, the scheduler could make poor scheduling decisions.
To protect against this oscillation, use the evictionpressure-transition-period flag to control how long OpenShift Container Platform must wait before transitioning out of a pressure condition. OpenShift Container Platform will not set an eviction threshold as being met for the specified pressure condition for the period specified before toggling the condition back to false.
Setting the evictionPressureTransitionPeriod parameter to 0 configures the default value of 5 minutes. You cannot set an eviction pressure transition period to zero seconds.
6.8.2. Understanding how images are removed through garbage collection
You can help ensure that your nodes are running efficiently by using image garbage collection to removes images that are not referenced by any running pods.
OpenShift Container Platform determines which images to remove from a node based on the disk usage that is reported by cAdvisor.
The policy for image garbage collection is based on two conditions:
- The percent of disk usage (expressed as an integer) which triggers image garbage collection. The default is 85.
- The percent of disk usage (expressed as an integer) to which image garbage collection attempts to free. Default is 80.
For image garbage collection, you can modify any of the following variables using a custom resource.
| Setting | Description |
|---|---|
|
| The minimum age for an unused image before the image is removed by garbage collection. The default is 2m. |
|
|
The percent of disk usage, expressed as an integer, which triggers image garbage collection. The default is 85. This value must be greater than the |
|
|
The percent of disk usage, expressed as an integer, to which image garbage collection attempts to free. The default is 80. This value must be less than the |
Two lists of images are retrieved in each garbage collector run:
- A list of images currently running in at least one pod.
- A list of images available on a host.
As new containers are run, new images appear. All images are marked with a time stamp. If the image is running (the first list above) or is newly detected (the second list above), it is marked with the current time. The remaining images are already marked from the previous spins. All images are then sorted by the time stamp.
Once the collection starts, the oldest images get deleted first until the stopping criterion is met.
6.8.3. Configuring garbage collection for containers and images
As an administrator, you can configure how OpenShift Container Platform performs garbage collection by creating a kubeletConfig object for each machine config pool. Performing garbage collection helps ensure that your nodes are running efficiently.
OpenShift Container Platform supports only one kubeletConfig object for each machine config pool.
You can configure any combination of the following:
- Soft eviction for containers
- Hard eviction for containers
- Eviction for images
Container garbage collection removes terminated containers. Image garbage collection removes images that are not referenced by any running pods.
Prerequisites
Obtain the label associated with the static
MachineConfigPoolCRD for the type of node you want to configure by entering the following command:$ oc edit machineconfigpool <name>For example:
$ oc edit machineconfigpool workerExample output
apiVersion: machineconfiguration.openshift.io/v1 kind: MachineConfigPool metadata: creationTimestamp: "2022-11-16T15:34:25Z" generation: 4 labels: pools.operator.machineconfiguration.openshift.io/worker: "" name: worker #...where:
metadata.labelsSpecifies a label to use with the kubelet configuration.
TipIf the label is not present, add a key/value pair such as:
$ oc label machineconfigpool worker custom-kubelet=small-pods
Procedure
Create a custom resource (CR) for your configuration change.
ImportantIf there is one file system, or if
/var/lib/kubeletand/var/lib/containers/are in the same file system, the settings with the highest values trigger evictions, as those are met first. The file system triggers the eviction.Sample configuration for a container garbage collection CR
apiVersion: machineconfiguration.openshift.io/v1 kind: KubeletConfig metadata: name: worker-kubeconfig spec: machineConfigPoolSelector: matchLabels: pools.operator.machineconfiguration.openshift.io/worker: "" kubeletConfig: evictionSoft: memory.available: "500Mi" nodefs.available: "10%" nodefs.inodesFree: "5%" imagefs.available: "15%" imagefs.inodesFree: "10%" evictionSoftGracePeriod: memory.available: "1m30s" nodefs.available: "1m30s" nodefs.inodesFree: "1m30s" imagefs.available: "1m30s" imagefs.inodesFree: "1m30s" evictionHard: memory.available: "200Mi" nodefs.available: "5%" nodefs.inodesFree: "4%" imagefs.available: "10%" imagefs.inodesFree: "5%" evictionPressureTransitionPeriod: 3m imageMinimumGCAge: 5m imageGCHighThresholdPercent: 80 imageGCLowThresholdPercent: 75 #...where:
metadata.name- Specifies a name for the object.
spec.machineConfigPoolSelector.matchLabels- Specifies the label from the machine config pool.
spec.kubeletConfig.evictionSoft- Specifies a soft eviction and eviction thresholds for container garbage collection.
spec.kubeletConfig.evictionSoftGracePeriod-
Specifies a grace period for the soft eviction of containers. This parameter does not apply to
eviction-hard. spec.kubeletConfig.evictionHard-
Specifies a soft eviction and eviction thresholds for container garbage collection. For
evictionHardyou must specify all of these parameters. If you do not specify all parameters, only the specified parameters are applied and the garbage collection will not function properly. spec.kubeletConfig.evictionPressureTransitionPeriod-
Specifies the duration to wait before transitioning out of an eviction pressure condition for container garbage collection. Setting the
evictionPressureTransitionPeriodparameter to0configures the default value of 5 minutes. spec.kubeletConfig.imageMinimumGCAge- Specifies the minimum age for an unused image before the image is removed by garbage collection.
spec.kubeletConfig.imageGCHighThresholdPercent-
Specifies the percent of disk usage, expressed as an integer, that triggers image garbage collection. This value must be greater than the
imageGCLowThresholdPercentvalue. spec.kubeletConfig.imageGCHighThresholdPercent-
Specifies the percent of disk usage, expressed as an integer, to which image garbage collection attempts to free. This value must be less than the
imageGCHighThresholdPercentvalue.
Run the following command to create the CR:
$ oc create -f <file_name>.yamlFor example:
$ oc create -f gc-container.yamlExample output
kubeletconfig.machineconfiguration.openshift.io/gc-container created
Verification
Verify that garbage collection is active by entering the following command. The Machine Config Pool you specified in the custom resource appears with
UPDATINGas 'true` until the change is fully implemented:$ oc get machineconfigpoolExample output
NAME CONFIG UPDATED UPDATING master rendered-master-546383f80705bd5aeaba93 True False worker rendered-worker-b4c51bb33ccaae6fc4a6a5 False True
6.9. Allocating resources for nodes in an OpenShift Container Platform cluster
To provide more reliable scheduling and minimize node resource overcommitment, reserve a portion of the CPU and memory resources for use by the underlying node components, such as kubelet and kube-proxy, and the remaining system components, such as sshd and NetworkManager. By specifying the resources to reserve, you provide the scheduler with more information about the remaining CPU and memory resources that a node has available for use by pods. You can allow OpenShift Container Platform to automatically determine the optimal system-reserved CPU and memory resources for your nodes or you can manually determine and set the best resources for your nodes.
To manually set resource values, you must use a kubelet config CR. You cannot use a machine config CR.
6.9.1. Understanding how to allocate resources for nodes
You can manually reserve optimal CPU and memory resources for the node and system components on your nodes. Ensuring proper resources for these services can help ensure that your cluster is operating efficiently.
The system-reserved setting in the KubeletConfig custom resource (CR) identifies the resources to reserve for the node components and system components, such as CRI-O and Kubelet. The default settings depend on the OpenShift Container Platform and Machine Config Operator versions. Confirm the default systemReserved parameter on the machine-config-operator repository.
The Kubernetes kubeReserved parameter is not supported in OpenShift Container Platform.
6.9.1.1. How OpenShift Container Platform computes allocated resources
An allocated amount of a resource is computed based on the following formula:
[Allocatable] = [Node Capacity] - [system-reserved] - [Hard-Eviction-Thresholds]
The withholding of Hard-Eviction-Thresholds from Allocatable improves system reliability because the value for Allocatable is enforced for pods at the node level.
If Allocatable is negative, it is set to 0.
Each node reports the system resources that are used by the container runtime and kubelet. To simplify configuring the system-reserved parameter, view the resource use for the node by using the node summary API. The node summary is available at /api/v1/nodes/<node>/proxy/stats/summary.
6.9.1.2. How nodes enforce resource constraints
The node is able to limit the total amount of resources that pods can consume based on the configured allocatable value. This feature significantly improves the reliability of the node by preventing pods from using CPU and memory resources that are needed by system services such as the container runtime and node agent. To improve node reliability, administrators should reserve resources based on a target for resource use.
The node enforces resource constraints by using a new cgroup hierarchy that enforces quality of service. All pods are launched in a dedicated cgroup hierarchy that is separate from system daemons.
Administrators should treat system daemons similar to pods that have a guaranteed quality of service. System daemons can burst within their bounding control groups and this behavior must be managed as part of cluster deployments. Reserve CPU and memory resources for system daemons by specifying the amount of CPU and memory resources in system-reserved.
Enforcing system-reserved limits can prevent critical system services from receiving CPU and memory resources. As a result, a critical system service can be ended by the out-of-memory killer. The recommendation is to enforce system-reserved only if you have profiled the nodes exhaustively to determine precise estimates and you are confident that critical system services can recover if any process in that group is ended by the out-of-memory killer.
6.9.1.3. Understanding Eviction Thresholds
If a node is under memory pressure, it can impact the entire node and all pods running on the node. For example, a system daemon that uses more than its reserved amount of memory can trigger an out-of-memory event. To avoid or reduce the probability of system out-of-memory events, the node provides out-of-resource handling.
You can reserve some memory using the --eviction-hard flag. The node attempts to evict pods whenever memory availability on the node drops below the absolute value or percentage. If system daemons do not exist on a node, pods are limited to the memory capacity - eviction-hard. For this reason, resources set aside as a buffer for eviction before reaching out of memory conditions are not available for pods.
The following is an example to illustrate the impact of node allocatable for memory:
-
Node capacity is
32Gi -
--system-reserved is
3Gi -
--eviction-hard is set to
100Mi.
For this node, the effective node allocatable value is 28.9Gi. If the node and system components use all their reservation, the memory available for pods is 28.9Gi, and kubelet evicts pods when it exceeds this threshold.
If you enforce node allocatable, 28.9Gi, with top-level cgroups, then pods can never exceed 28.9Gi. Evictions are not performed unless system daemons consume more than 3.1Gi of memory.
If system daemons do not use up all their reservation, with the above example, pods would face memcg OOM kills from their bounding cgroup before node evictions kick in. To better enforce QoS under this situation, the node applies the hard eviction thresholds to the top-level cgroup for all pods to be Node Allocatable + Eviction Hard Thresholds.
If system daemons do not use up all their reservation, the node will evict pods whenever they consume more than 28.9Gi of memory. If eviction does not occur in time, a pod will be OOM killed if pods consume 29Gi of memory.
6.9.1.4. How the scheduler determines resource availability
The scheduler uses the value of node.Status.Allocatable instead of node.Status.Capacity to decide if a node will become a candidate for pod scheduling.
By default, the node will report its machine capacity as fully schedulable by the cluster.
6.9.2. Understanding process ID limits
You can review the following information to learn how to limit the number of processes running on your nodes. Configuring an appropriate number of processes can help keep the nodes in your cluster running efficiently.
A process identifier (PID) is a unique identifier assigned by the Linux kernel to each process or thread currently running on a system. The number of processes that can run simultaneously on a system is limited to 4,194,304 by the Linux kernel. This number might also be affected by limited access to other system resources such as memory, CPU, and disk space.
In OpenShift Container Platform, consider these two supported limits for process ID (PID) usage before you schedule work on your cluster:
Maximum number of PIDs per pod.
The default value is 4,096 in OpenShift Container Platform 4.11 and later. This value is controlled by the
podPidsLimitparameter set on the node.You can view the current PID limit on a node by running the following command in a
chrootenvironment:sh-5.1# cat /etc/kubernetes/kubelet.conf | grep -i pidsExample output
"podPidsLimit": 4096,You can change the
podPidsLimitby using aKubeletConfigobject. See "Creating a KubeletConfig CR to edit kubelet parameters".Containers inherit the
podPidsLimitvalue from the parent pod, so the kernel enforces the lower of the two limits. For example, if the container PID limit is set to the maximum, but the pod PID limit is4096, the PID limit of each container in the pod is confined to 4096.Maximum number of PIDs per node.
The default value depends on node resources. In OpenShift Container Platform, this value is controlled by the
systemReservedparameter in a kubelet configuration, which reserves PIDs on each node based on the total resources of the node. For more information, see "Allocating resources for nodes in an OpenShift Container Platform cluster".
When a pod exceeds the allowed maximum number of PIDs per pod, the pod might stop functioning correctly and might be evicted from the node. See the Kubernetes documentation for eviction signals and thresholds for more information.
When a node exceeds the allowed maximum number of PIDs per node, the node can become unstable because new processes cannot have PIDs assigned. If existing processes cannot complete without creating additional processes, the entire node can become unusable and require reboot. This situation can result in data loss, depending on the processes and applications being run. Customer administrators and Red Hat Site Reliability Engineering are notified when this threshold is reached, and a Worker node is experiencing PIDPressure warning will appear in the cluster logs.
6.9.2.1. Risks of setting higher process ID limits for OpenShift Container Platform pods
You can review the following information to learn about some considerations about allowing a high maximum number of processes to run on your nodes. Configuring an appropriate number of processes can help keep the nodes in your cluster running efficiently.
You can increase the value for podPidsLimit from the default of 4,096 to a maximum of 16,384. Changing this value might incur downtime for applications, because changing the podPidsLimit requires rebooting the affected node.
If you are running a large number of pods per node, and you have a high podPidsLimit value on your nodes, you risk exceeding the PID maximum for the node.
To find the maximum number of pods that you can run simultaneously on a single node without exceeding the PID maximum for the node, divide 3,650,000 by your podPidsLimit value. For example, if your podPidsLimit value is 16,384, and you expect the pods to use close to that number of process IDs, you can safely run 222 pods on a single node.
Memory, CPU, and available storage can also limit the maximum number of pods that can run simultaneously, even when the podPidsLimit value is set appropriately.
6.9.3. Automatically allocating resources for nodes
You can configure OpenShift Container Platform to automatically determine the optimal system-reserved CPU and memory resources for nodes associated with a specific machine config pool. OpenShift Container Platform then updates the nodes with those values when the nodes start.
To automatically determine and allocate the system-reserved resources on nodes, create a KubeletConfig custom resource (CR) to set the autoSizingReserved: true parameter. A script on each node calculates the optimal values for the respective reserved resources based on the installed CPU and memory capacity on each node. The script takes into account that increased capacity requires a corresponding increase in the reserved resources.
Automatically determining the optimal system-reserved settings ensures that your cluster is running efficiently and prevents node failure due to resource starvation of system components, such as CRI-O and kubelet, without your needing to manually calculate and update the values. By default, the system-reserved CPU is 500m and system-reserved memory is 1Gi.
This feature is disabled by default.
Prerequisites
-
You have the label associated with the static
MachineConfigPoolobject for the type of node you want to configure.
Procedure
Create a custom resource (CR) for your configuration change:
Sample configuration for a resource allocation CR
apiVersion: machineconfiguration.openshift.io/v1 kind: KubeletConfig metadata: name: dynamic-node spec: autoSizingReserved: true machineConfigPoolSelector: matchLabels: pools.operator.machineconfiguration.openshift.io/worker: "" #...where:
metadata.name- Specifies a name for the CR.
spec.autoSizingReserved-
Specifies whether OpenShift Container Platform determines and allocates the
system-reservedresources on the nodes associated with the specified label. Set totrueto allow automatic allocation on those nodes. Set tofalseto disable automatic allocation on those nodes. spec.machineConfigPoolSelector.matchLabels- Specifies the label from the machine config pool where you want to enable or disable automatic resource allocation.
The previous example enables automatic resource allocation on all worker nodes. OpenShift Container Platform drains the nodes, applies the kubelet config, and restarts the nodes.
Create the CR by entering the following command:
$ oc create -f <file_name>.yaml
Verification
Log in to a node you configured by entering the following command:
$ oc debug node/<node_name>Set
/hostas the root directory within the debug shell:# chroot /hostView the
/etc/node-sizing.envfile:Example output
SYSTEM_RESERVED_MEMORY=3Gi SYSTEM_RESERVED_CPU=0.08The kubelet uses the
system-reservedvalues in the/etc/node-sizing.envfile. In the previous example, the worker nodes are allocated0.08CPU and 3 Gi of memory. It can take several minutes for the optimal values to appear.
6.9.4. Manually allocating resources for nodes
OpenShift Container Platform supports the CPU and memory resource types for allocation. The ephemeral-resource resource type is also supported. For the cpu type, you specify the resource quantity in units of cores, such as 200m, 0.5, or 1. For memory and ephemeral-storage, you specify the resource quantity in units of bytes, such as 200Ki, 50Mi, or 5Gi. By default, the system-reserved CPU is 500m and system-reserved memory is 1Gi.
As an administrator, you can set these values by using a kubelet config custom resource (CR) through a set of <resource_type>=<resource_quantity> pairs (e.g., cpu=200m,memory=512Mi).
-
For details on the recommended
system-reservedvalues, refer to the recommended system-reserved values. - You must use a kubelet config CR to manually set resource values. You cannot use a machine config CR.
Prerequisites
Obtain the label associated with the static
MachineConfigPoolCRD for the type of node you want to configure by entering the following command:$ oc edit machineconfigpool <name>For example:
$ oc edit machineconfigpool workerExample output
apiVersion: machineconfiguration.openshift.io/v1 kind: MachineConfigPool metadata: creationTimestamp: "2022-11-16T15:34:25Z" generation: 4 labels: pools.operator.machineconfiguration.openshift.io/worker: ""1 name: worker #...- 1
- The label appears under Labels.
TipIf the label is not present, add a key/value pair such as:
$ oc label machineconfigpool worker custom-kubelet=small-pods
Procedure
Create a custom resource (CR) for your configuration change.
Sample configuration for a resource allocation CR
apiVersion: machineconfiguration.openshift.io/v1 kind: KubeletConfig metadata: name: set-allocatable1 spec: machineConfigPoolSelector: matchLabels: pools.operator.machineconfiguration.openshift.io/worker: ""2 kubeletConfig: systemReserved:3 cpu: 1000m memory: 1Gi #...Run the following command to create the CR:
$ oc create -f <file_name>.yaml
6.10. Allocating specific CPUs for nodes in a cluster
When using the static CPU Manager policy, you can explicitly define a list of CPUs that are reserved for critical system processes on specific nodes. Reserving CPUs for critical system processes can help ensure cluster stability.
For example, on a system with 24 CPUs, you could reserve CPUs numbered 0 - 3 for the control plane allowing the compute nodes to use CPUs 4 - 23.
6.10.1. Reserving CPUs for nodes
You can explicitly define a list of CPUs that are reserved for critical system processes on specific nodes by creating a KubeletConfig custom resource (CR) to define the reservedSystemCPUs parameter. Reserving CPUs for critical system processes can help ensure cluster stability.
This list supersedes the CPUs that might be reserved by using the systemReserved parameter.
For more information on the systemReserved parameter, see "Allocating resources for nodes in an OpenShift Container Platform cluster".
Prerequisites
- You have the label associated with the machine config pool (MCP) for the type of node you want to configure:
Procedure
Create a YAML file for the
KubeletConfigCR:apiVersion: machineconfiguration.openshift.io/v1 kind: KubeletConfig metadata: name: set-reserved-cpus spec: kubeletConfig: reservedSystemCPUs: "0,1,2,3" machineConfigPoolSelector: matchLabels: pools.operator.machineconfiguration.openshift.io/worker: "" #...where:
metadata.name- Specifies a name for the CR.
spec.kubeletConfig.reservedSystemCPUs- Specifies the core IDs of the CPUs you want to reserve for the nodes associated with the MCP.
spec.machineConfigPoolSelector.matchLabels- Specifies the label from the MCP.
Create the CR object:
$ oc create -f <file_name>.yaml
6.11. Enabling TLS security profiles for the kubelet
You can use a TLS (Transport Layer Security) security profile to define which TLS ciphers are required by the kubelet when it is acting as an HTTP server. The kubelet uses its HTTP/GRPC server to communicate with the Kubernetes API server, which sends commands to pods, gathers logs, and run exec commands on pods through the kubelet.
A TLS security profile defines the TLS ciphers that the Kubernetes API server must use when connecting with the kubelet to protect communication between the kubelet and the Kubernetes API server.
By default, when the kubelet acts as a client with the Kubernetes API server, it automatically negotiates the TLS parameters with the API server.
6.11.1. Understanding TLS security profiles
You can use a TLS (Transport Layer Security) security profile, as described in this section, to define which TLS ciphers are required by various OpenShift Container Platform components.
The OpenShift Container Platform TLS security profiles are based on Mozilla recommended configurations.
You can specify one of the following TLS security profiles for each component:
| Profile | Description |
|---|---|
|
| This profile is intended for use with legacy clients or libraries. The profile is based on the Old backward compatibility recommended configuration.
The Note For the Ingress Controller, the minimum TLS version is converted from 1.0 to 1.1. |
|
| This profile is the default TLS security profile for the Ingress Controller, kubelet, and control plane. The profile is based on the Intermediate compatibility recommended configuration.
The Note This profile is the recommended configuration for the majority of clients. |
|
| This profile is intended for use with modern clients that have no need for backwards compatibility. This profile is based on the Modern compatibility recommended configuration.
The |
|
| This profile allows you to define the TLS version and ciphers to use. Warning
Use caution when using a |
When using one of the predefined profile types, the effective profile configuration is subject to change between releases. For example, given a specification to use the Intermediate profile deployed on release X.Y.Z, an upgrade to release X.Y.Z+1 might cause a new profile configuration to be applied, resulting in a rollout.
6.11.2. Configuring the TLS security profile for the kubelet
You can configure a TLS security profile for the kubelet when it is acting as an HTTP server by creating a KubeletConfig custom resource (CR) to specify a predefined or custom TLS security profile for specific nodes.
If a TLS security profile is not configured, the default TLS security profile, Intermediate, is used.
Sample KubeletConfig CR that configures the Old TLS security profile on worker nodes
apiVersion: machineconfiguration.openshift.io/v1
kind: KubeletConfig
# ...
spec:
tlsSecurityProfile:
old: {}
type: Old
machineConfigPoolSelector:
matchLabels:
pools.operator.machineconfiguration.openshift.io/worker: ""
# ...
You can see the ciphers and the minimum TLS version of the configured TLS security profile in the kubelet.conf file on a configured node.
Prerequisites
-
You are logged in to OpenShift Container Platform as a user with the
cluster-adminrole.
Procedure
Create a
KubeletConfigCR to configure the TLS security profile:Sample
KubeletConfigCR for aCustomprofileapiVersion: machineconfiguration.openshift.io/v1 kind: KubeletConfig metadata: name: set-kubelet-tls-security-profile spec: tlsSecurityProfile: type: Custom custom: ciphers: - ECDHE-ECDSA-CHACHA20-POLY1305 - ECDHE-RSA-CHACHA20-POLY1305 - ECDHE-RSA-AES128-GCM-SHA256 - ECDHE-ECDSA-AES128-GCM-SHA256 minTLSVersion: VersionTLS11 machineConfigPoolSelector: matchLabels: pools.operator.machineconfiguration.openshift.io/worker: "" #...where:
spec.tlsSecurityProfile.type-
Specifies the TLS security profile type (
Old,Intermediate, orCustom). The default isIntermediate. spec.tlsSecurityProfile.type.customSpecifies the appropriate field for the selected type:
-
old: {} -
intermediate: {} -
custom:
-
spec.tlsSecurityProfile.type.custom-
For the
customtype, specifies a list of TLS ciphers and the minimum accepted TLS version. spec.machineConfigPoolSelector.matchLabels.custom- Specifies the machine config pool label for the nodes you want to apply the TLS security profile. This parameter is optional.
Create the
KubeletConfigobject:$ oc create -f <filename>Depending on the number of worker nodes in the cluster, wait for the configured nodes to be rebooted one by one.
Verification
To verify that the profile is set, perform the following steps after the nodes are in the Ready state:
Start a debug session for a configured node:
$ oc debug node/<node_name>Set
/hostas the root directory within the debug shell:sh-4.4# chroot /hostView the
kubelet.conffile:sh-4.4# cat /etc/kubernetes/kubelet.confExample output
"kind": "KubeletConfiguration", "apiVersion": "kubelet.config.k8s.io/v1beta1", #... "tlsCipherSuites": [ "TLS_ECDHE_ECDSA_WITH_AES_128_GCM_SHA256", "TLS_ECDHE_RSA_WITH_AES_128_GCM_SHA256", "TLS_ECDHE_ECDSA_WITH_AES_256_GCM_SHA384", "TLS_ECDHE_RSA_WITH_AES_256_GCM_SHA384", "TLS_ECDHE_ECDSA_WITH_CHACHA20_POLY1305_SHA256", "TLS_ECDHE_RSA_WITH_CHACHA20_POLY1305_SHA256" ], "tlsMinVersion": "VersionTLS12", #...
6.12. Creating infrastructure nodes
You can use the advanced machine management and scaling capabilities only in clusters where the Machine API is operational. Clusters with user-provisioned infrastructure require additional validation and configuration to use the Machine API.
Clusters with the infrastructure platform type none cannot use the Machine API. This limitation applies even if the compute machines that are attached to the cluster are installed on a platform that supports the feature. This parameter cannot be changed after installation.
To view the platform type for your cluster, run the following command:
$ oc get infrastructure cluster -o jsonpath='{.status.platform}'You can use infrastructure machine sets to create machines that host only infrastructure components, such as the default router, the integrated container image registry, and the components for cluster metrics and monitoring. These infrastructure machines are not counted toward the total number of subscriptions that are required to run the environment.
After adding the NoSchedule taint on the infrastructure node, existing DNS pods running on that node are marked as misscheduled. You must either delete or add toleration on misscheduled DNS pods.
6.12.1. OpenShift Container Platform infrastructure components
You can review the following information to understand which components you can move to an infrastructure node. Components that you move to an infrastructure node do not need to be accounted for during sizing.
Each self-managed Red Hat OpenShift subscription includes entitlements for OpenShift Container Platform and other OpenShift-related components. These entitlements are included for running OpenShift Container Platform control plane and infrastructure workloads and do not need to be accounted for during sizing.
To qualify as an infrastructure node and use the included entitlement, only components that are supporting the cluster, and not part of an end-user application, can run on those instances. Examples include the following components:
- Kubernetes and OpenShift Container Platform control plane services
- The default router
- The integrated container image registry
- The HAProxy-based Ingress Controller
- The cluster metrics collection, or monitoring service, including components for monitoring user-defined projects
- Cluster aggregated logging
- Red Hat Quay
- Red Hat OpenShift Data Foundation
- Red Hat Advanced Cluster Management for Kubernetes
- Red Hat Advanced Cluster Security for Kubernetes
- Red Hat OpenShift GitOps
- Red Hat OpenShift Pipelines
- Red Hat OpenShift Service Mesh
Any node that runs any other container, pod, or component is a worker node that your subscription must cover.
For information about infrastructure nodes and which components can run on infrastructure nodes, see the "Red Hat OpenShift control plane and infrastructure nodes" section in the OpenShift sizing and subscription guide for enterprise Kubernetes document.
6.12.1.1. Creating an infrastructure node
See "Creating infrastructure machine sets" for installer-provisioned infrastructure environments or for any cluster where the control plane nodes are managed by the machine API.
You can use labels to configure worker nodes as infrastructure nodes, where you can move infrastructure resources.
After you create the infrastructure nodes, you can move appropriate workloads to those nodes by using taints and tolerations.
You can optionally create a default cluster-wide node selector. The default node selector is applied to pods created in all namespaces and creates an intersection with any existing node selectors on a pod, which additionally constrains the pod’s selector.
If the default node selector key conflicts with the key of a pod’s label, then the default node selector is not applied.
However, do not set a default node selector that might cause a pod to become unschedulable. For example, setting the default node selector to a specific node role, such as node-role.kubernetes.io/infra="", when a pod’s label is set to a different node role, such as node-role.kubernetes.io/master="", can cause the pod to become unschedulable. For this reason, use caution when setting the default node selector to specific node roles.
You can alternatively use a project node selector to avoid cluster-wide node selector key conflicts.
Procedure
Add a label to the worker nodes that you want to act as infrastructure nodes:
$ oc label node <node-name> node-role.kubernetes.io/infra=""Check to see if applicable nodes now have the
infrarole:$ oc get nodesOptional: Create a default cluster-wide node selector:
Edit the
Schedulerobject:$ oc edit scheduler clusterAdd the
defaultNodeSelectorfield with the appropriate node selector:apiVersion: config.openshift.io/v1 kind: Scheduler metadata: name: cluster spec: defaultNodeSelector: node-role.kubernetes.io/infra="" # ...This example node selector deploys pods on infrastructure nodes by default.
- Save the file to apply the changes.
You can now move infrastructure resources to the new infrastructure nodes. Also, remove any workloads that you do not want, or that do not belong, on the new infrastructure node. See the list of workloads supported for use on infrastructure nodes in "OpenShift Container Platform infrastructure components".