5.2. ダッシュボード UI プラグイン
Cluster Observability Operator はテクノロジープレビュー機能としてのみ使用できます。テクノロジープレビュー機能は、Red Hat 製品のサービスレベルアグリーメント (SLA) の対象外であり、機能的に完全ではないことがあります。Red Hat は、実稼働環境でこれらを使用することを推奨していません。テクノロジープレビューの機能は、最新の製品機能をいち早く提供して、開発段階で機能のテストを行いフィードバックを提供していただくことを目的としています。
Red Hat のテクノロジープレビュー機能のサポート範囲に関する詳細は、テクノロジープレビュー機能のサポート範囲 を参照してください。
ダッシュボード UI プラグインは、OpenShift Web コンソールの Observe
このプラグインは、openshift-config-managed namespace 内の ConfigMap リソースから、ラベル console.openshift.io/dashboard-datasource: 'true' を持つデータソースを検索します。
5.2.1. Cluster Observability Operator ダッシュボード UI プラグインのインストール
前提条件
-
cluster-adminクラスターロールを持つユーザーとしてクラスターにアクセスできる。 - OpenShift Container Platform Web コンソールにログインしている。
- Cluster Observability Operator がインストールされている。
手順
-
OpenShift Container Platform Web コンソールで、Operator
Installed Operator をクリックし、Cluster Observability Operator を選択します。 - UI Plugin タブ (タブリストの右端) を選択し、Create UIPlugin を押します。
YAML view を選択し、次の内容を入力して、Create を押します。
apiVersion: observability.openshift.io/v1alpha1 kind: UIPlugin metadata: name: dashboards spec: type: Dashboards
5.2.2. ダッシュボードの設定
ダッシュボード UI プラグインは、openshift-config-managed namespace 内の ConfigMap リソースから、ラベル console.openshift.io/dashboard-datasource: 'true' を持つデータソースを検索します。ConfigMap リソースでは、データソースタイプと、データを取得できるクラスター内サービスを定義する必要があります。
次のセクションの例は、https://github.com/openshift/console-dashboards-plugin から取得したものです。
前提条件
-
cluster-adminクラスターロールを持つユーザーとしてクラスターにアクセスできる。 - OpenShift Container Platform Web コンソールにログインしている。
- Cluster Observability Operator がインストールされている。
- ダッシュボード UI プラグインがインストールされている。
手順
ラベル
console.openshift.io/dashboard-datasource: 'true'を使用して、openshift-config-managednamespace にConfigMapリソースを作成します。以下の例は prometheus-datasource-example.yaml からのものです。apiVersion: v1 kind: ConfigMap metadata: name: cluster-prometheus-proxy namespace: openshift-config-managed labels: console.openshift.io/dashboard-datasource: "true" data: "dashboard-datasource.yaml": |- kind: "Datasource" metadata: name: "cluster-prometheus-proxy" project: "openshift-config-managed" spec: plugin: kind: "prometheus" spec: direct_url: "https://prometheus-k8s.openshift-monitoring.svc.cluster.local:9091"データソースに接続するカスタムダッシュボードを設定します。サンプルダッシュボードの YAML は、prometheus-dashboard-example.yaml で入手できます。そのファイルからの抜粋を例として以下に示します。
例5.1 prometheus-dashboard-example.yaml から取得したサンプルダッシュボードの抜粋
apiVersion: v1 kind: ConfigMap metadata: name: dashboard-example namespace: openshift-config-managed labels: console.openshift.io/dashboard: "true" data: k8s-resources-workloads-namespace.json: |- { "annotations": { "list": [ ] }, "editable": true, "gnetId": null, "graphTooltip": 0, "hideControls": false, "links": [ ], "refresh": "10s", "rows": [ { "collapse": false, "height": "250px", "panels": [ { "aliasColors": { }, "bars": false, "dashLength": 10, "dashes": false, "datasource": { "name": "cluster-prometheus-proxy", "type": "prometheus" }, "fill": 10, "id": 1, "interval": "1m", "legend": { "alignAsTable": true, "avg": false, "current": false, "max": false, "min": false, "rightSide": true, "show": true, "total": false, "values": false }, "lines": true, "linewidth": 0, "links": [ ], "nullPointMode": "null as zero", "percentage": false, "pointradius": 5, "points": false, "renderer": "flot", "seriesOverrides": [ { "alias": "quota - requests", "color": "#F2495C", "dashes": true, "fill": 0, "hiddenSeries": true, "hideTooltip": true, "legend": true, "linewidth": 2, "stack": false }, { "alias": "quota - limits", "color": "#FF9830", "dashes": true, "fill": 0, "hiddenSeries": true, "hideTooltip": true, "legend": true, "linewidth": 2, "stack": false } ], "spaceLength": 10, "span": 12, "stack": false, "steppedLine": false, "targets": [ { "expr": "sum( node_namespace_pod_container:container_cpu_usage_seconds_total:sum_irate{cluster=\"$cluster\", namespace=\"$namespace\"}* on(namespace,pod) group_left(workload, workload_type) namespace_workload_pod:kube_pod_owner:relabel{cluster=\"$cluster\", namespace=\"$namespace\", workload_type=\"$type\"}) by (workload, workload_type)", "format": "time_series", "intervalFactor": 2, "legendFormat": "{{workload}} - {{workload_type}}", "legendLink": null, "step": 10 }, { "expr": "scalar(kube_resourcequota{cluster=\"$cluster\", namespace=\"$namespace\", type=\"hard\",resource=\"requests.cpu\"})", "format": "time_series", "intervalFactor": 2, "legendFormat": "quota - requests", "legendLink": null, "step": 10 }, { "expr": "scalar(kube_resourcequota{cluster=\"$cluster\", namespace=\"$namespace\", type=\"hard\",resource=\"limits.cpu\"})", "format": "time_series", "intervalFactor": 2, "legendFormat": "quota - limits", "legendLink": null, "step": 10 } ], "thresholds": [ ], "timeFrom": null, "timeShift": null, "title": "CPU Usage", "tooltip": { "shared": false, "sort": 2, "value_type": "individual" }, "type": "graph", "xaxis": { "buckets": null, "mode": "time", "name": null, "show": true, "values": [ ] }, ...Observe
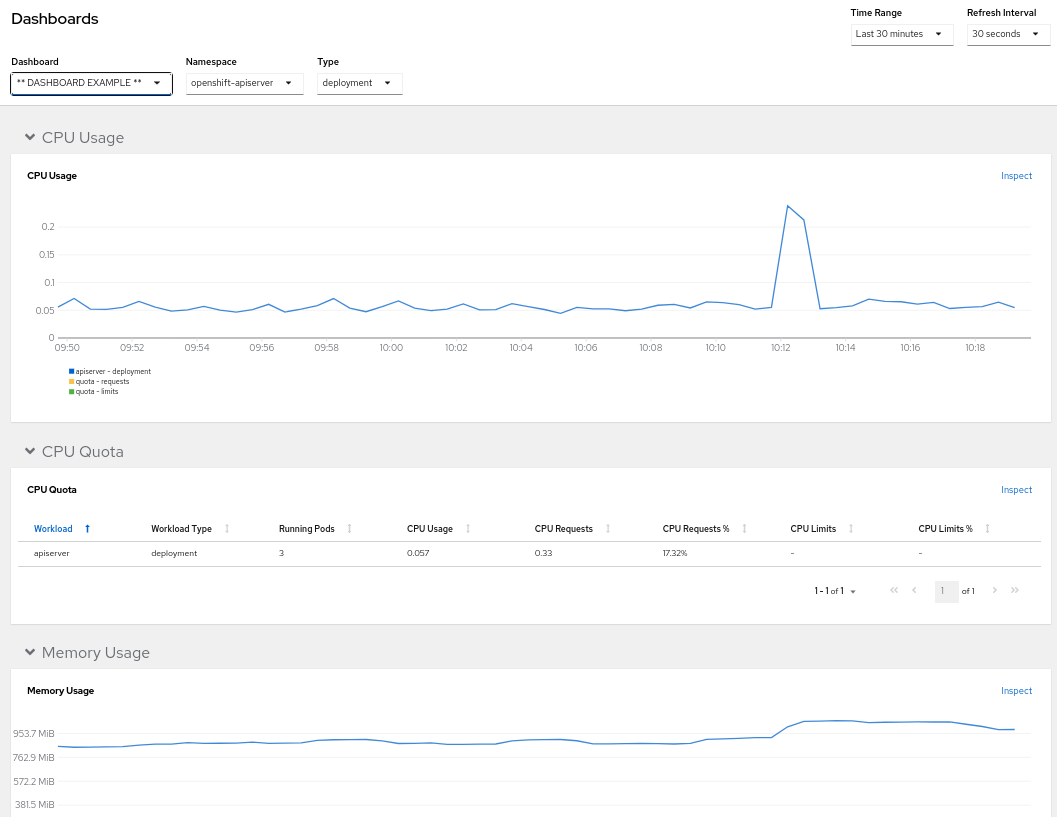
Dashboards をクリックすると、 prometheus-dashboard-example.yamlの設定に基づく ** DASHBOARD EXAMPLE ** というタイトルのカスタムダッシュボードを使用できます。
UI で、ダッシュボードの namespace、時間範囲、更新間隔を設定できます。
5.2.3. 関連情報
- console-dashboards-plugin GitHub リポジトリーで 新しいデータソースを追加 する方法を参照してください。